
Gold Price Forecast Hinges on CPI and Warsh Testimony
Gold bounced higher earlier this month on a weaker dollar and the move looked like it had legs until the FOMC minutes landed. Warsh’s committee made it clear this Fed is not easing into sticky inflation, rate cut bets collapsed, and the rally stalled without breaking down. CPI and Warsh’s testimony both arrive Tuesday and that single session will likely decide whether the bid comes back or the stall turns into something worse.
Spot Gold (XAUUSD) settled at $4,120.67 last week, down $55.02 or 1.32%.
Weekly Spot Gold (XAUUSD) Technical Analysis
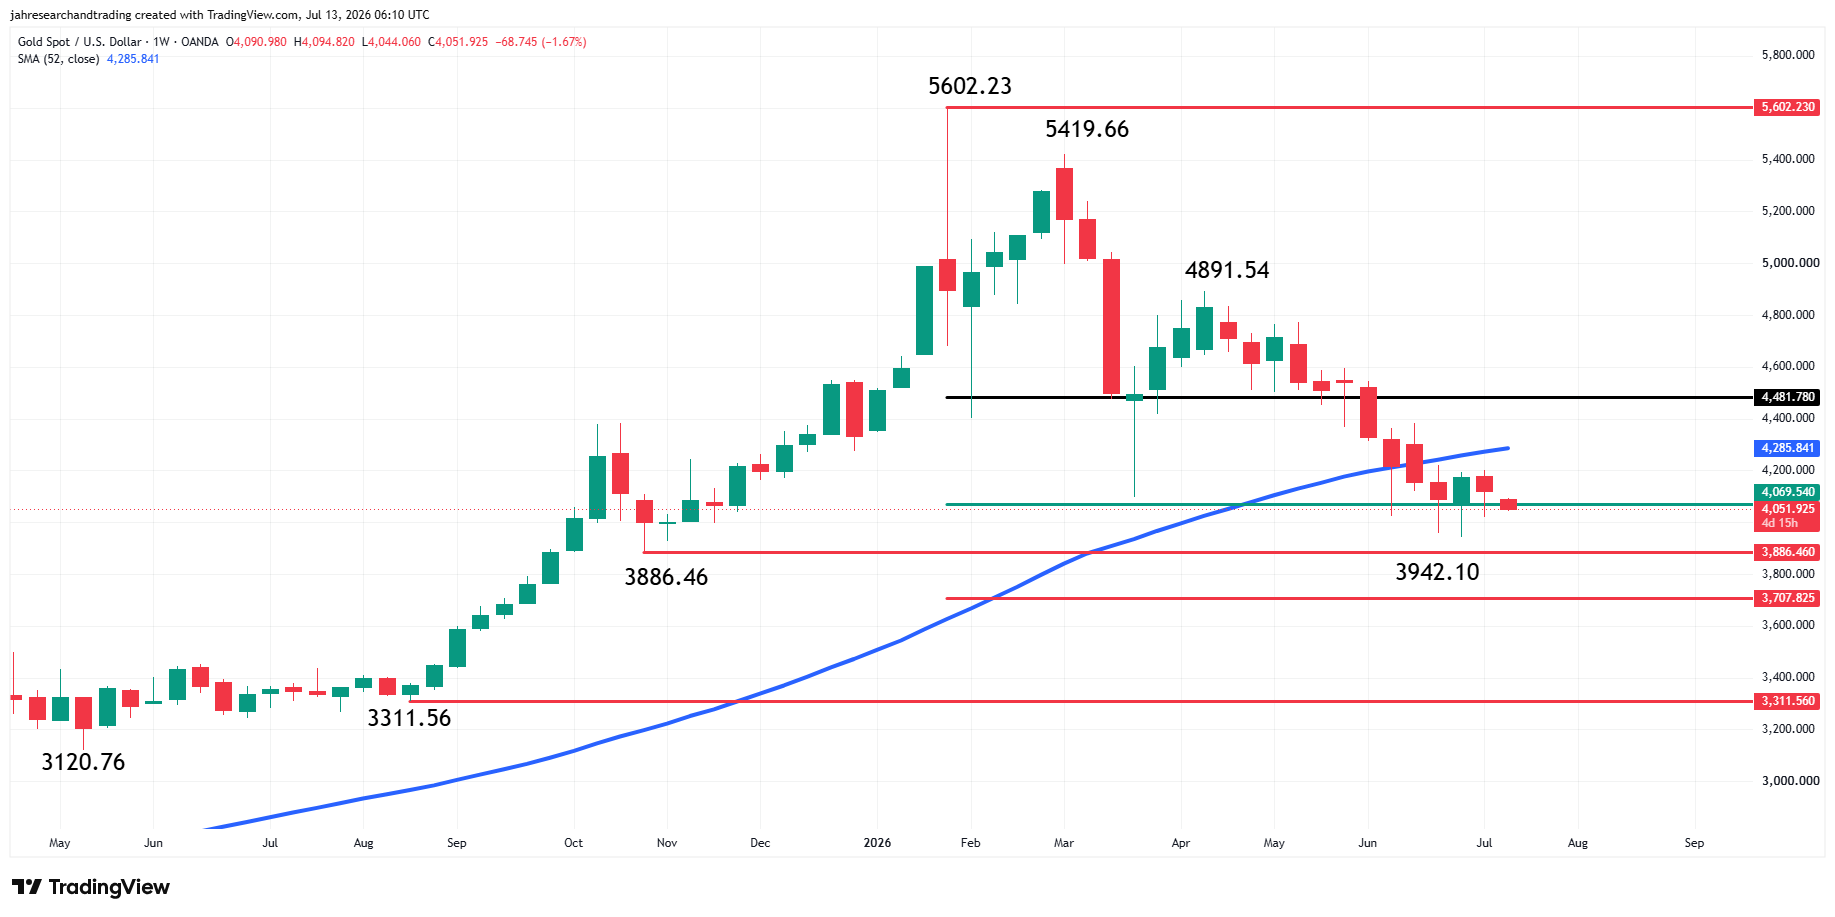
Last week, XAUUSD settled at $4,120.67, down $55.02 or -1.32%. This was one week after a closing price reversal bottom at $3,942.10 that didn’t pay off for bullish counter-trend buyers. The weak close last week could bring in the sellers this week.
The main trend is down according to the weekly swing chart. The nearest swing top is $4,891.54. Buyers would have to take out this level to change the trend to up. This is too far at this time and highly unlikely so we’re waiting for a tighter “W” pattern to form at lower levels to give us a better entry. A trade through $3,942.10 will negate the potentially bullish reversal bottom and signal a resumption of the downtrend.
Some traders may prefer to use the 52-week moving average as their trend indicator, which is perfectly fine. It comes in at $4,286.02 at the start of the new week. At this time, XAUUSD is on the weak side of this indicator.
I haven’t seen a lot of traders taking offers lately, which is causing an upside momentum issue. They seem to be content with bidding or buying dips. They are searching for value.
One long-term range I’m watching is $2,536.85 from November 2024 to $5,602.23 from January 2026. The market is currently testing its retracement zone at $4,069.54 to $3,707.82. In fact, the recent low at $3,942.10 fell inside this zone. Could the current consolidation around the 50% level at $4,069.54 mean that investors are recognizing value? The only way we’ll know is if buyers can recapture and sustain a rally over the 50-day MA, in my opinion.
I don’t think it’s that important to pick the exact bottom. Let the big-monied bidders do that, all you need to do is catch the turn at the right time.
Gold Price Forecast
Every new Gold analysis as it publishes, today's technical signal and key levels, live price — on one page.
See all Gold forecastsGold’s Rate Bid Lives or Dies With CPI
The FOMC minutes killed upside momentum and CPI has to undo the damage or the selling resumes. June CPI reports Tuesday morning with every economist’s forecast well above 2%, and Warsh testifies before the House Financial Services Committee that same afternoon. The Q&A starts while desks are still positioning off the CPI number. Gold needs a miss to the downside big enough that Warsh cannot dismiss it on live television. If inflation prints at consensus or hotter, he has the data behind him to stay hawkish. Slower growth, stickier inflation, a labor market refusing to crack. Nothing in that combination gives him a reason to open the door and gold loses the rate trade for the rest of July.
Crude running higher on the Hormuz closure compounds the problem independently. Iran closed the Strait, and every dollar oil adds while the Strait stays restricted resets inflation expectations forward regardless of what last month’s CPI showed. The fear money from the Middle East escalation is flowing into the dollar and the 10-year, not into gold. The conflict that would normally attract safe-haven buying into the metal is instead strengthening the two instruments working against it. That tells you the rate trade is running this market completely.
What to Watch
The way I see it, gold’s week comes down to one afternoon. CPI prints Tuesday morning and Warsh testifies that same day. If the inflation number comes in soft and Warsh does not immediately push back in the Q&A, the rate bid comes back fast because the market is already positioned for the worst case. But if CPI prints at consensus or hotter, Warsh has no reason to give ground and gold loses the rate argument for the rest of the month.
Oil is the variable nobody can model. The Hormuz closure is repricing energy costs forward in real time and that math works against gold no matter what CPI says. A soft inflation print Tuesday morning means less if crude is $5 higher by Wednesday because the next print already has a problem built in.
Long-term investors are looking for value, short-term traders are watching for a momentum shift. The first line of value is the 50% level at $4069.54. That level is currently being tested after the market rebounded from a trade to $3942.10. If it holds, then upside momentum is likely to increase after the 52-week moving average is overtaken. However, we could see further downside pressure if $3942.10 fails as support.
If you’d like to know more about how to trade gold, please visit our educational area.