
Currencies Reflect Divergent Monetary Policies and Economic Fundamentals
On July 13, the dollar, euro and pound will keep being defined by competing central bank stances and economic fundamentals. Latest FOMC meeting minutes saw a hint of a shift towards the hawkish side with some officials thinking rates might well be firmed up on the back of core inflation being too sticky, while risks from energy price volatility, and demand from artificial intelligence. The dollar is thus supported by the prospect of relatively restrictive monetary policy being sustained for a period of time. Strong underlying domestic demand and a status quo as a global reserve currency are key structural positives for the dollar.
Economy-wide growth across the euro zone is currently uneven, and is likely to remain so in the months following the ECB’s June rate increase to 2.25%. Different fiscal positions at the country level and heterogeneous inflation dynamics are key factors influencing monetary policy transmission in the euro zone. The euro currency remains susceptible to activity and wage data.
Sterling is facing a similar dilemma, as policymakers at the Bank of England juggle elevated service-sector inflation risks against signs of softer economic growth. Domestic fiscal and labour market policies are likely to continue playing a key role in the currency’s outlook as relative policy stances with the Fed and the ECB impact on exchange rates.
Key economic fundamentals remain divergent, with different paths in inflation dynamics, fiscal settings and underlying growth resilience, all of which will sustain two-way market risks for the three major currencies. External trade flows and capital movements will further differentiate the currency markets depending on which central bank can most easily maintain stability and growth.

DXY Holds $101.07 – Fib 0.618 Retest on 4h
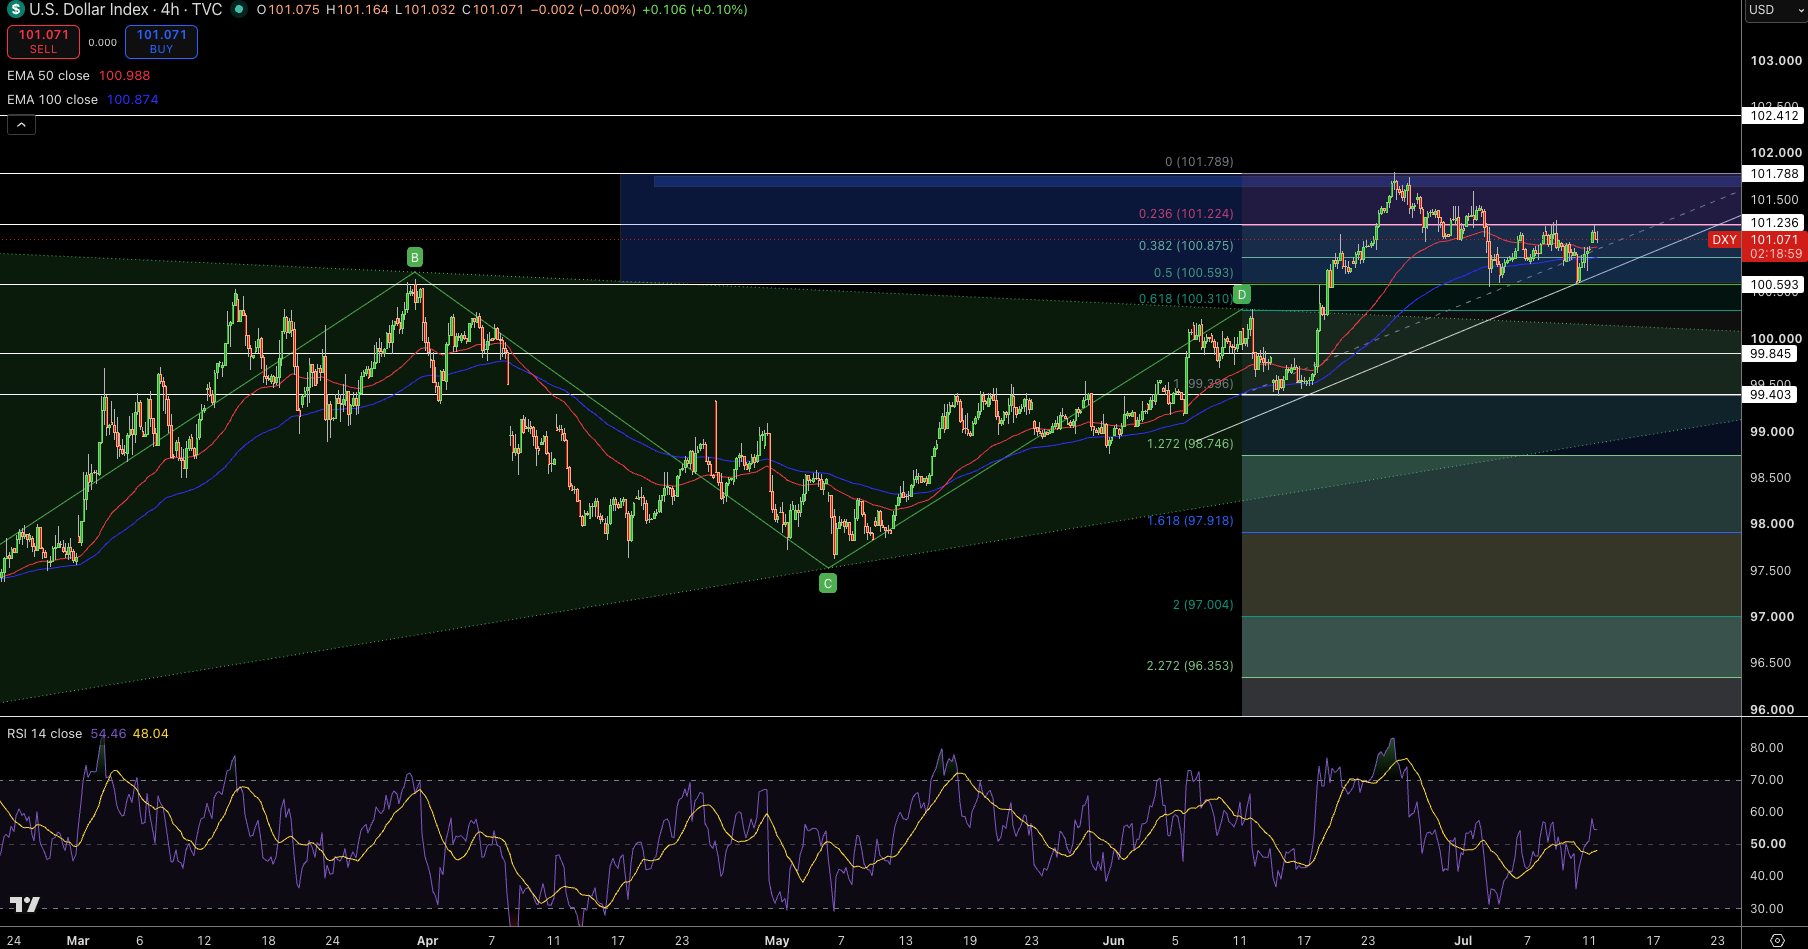
The USD index (DXY) was up slightly at $101.07 on the 4h timeframe chart. We can see from the 4h DXY chart that the mixed candles had just tested 0.618 Fib level near 100.31 after a strong breakout from the swing low at 97.67.
The bullish bodies with higher highs are confirming the buyer’s control, while still maintaining respect for the 4h chart 50-EMA near 101.02. We can also observe that the RSI sits near 55. Meanwhile, the volume profile identifies 100.59-101.06 as a significant breakout point.
Fib retracement implies the next resistance will come around 103.09 in the next few weeks. In short, the market remains decisively bullish in the 4h chart above 100.59 inside a well-defined ascending channel, confirming a higher high and a higher low formation to keep the buyers firmly in control.
Based on this technical outlook, I would consider a long position around $101.07, targeting $103.09, while placing a stop below $100.59.
GBP/USD Price Forecast
Every new GBP/USD analysis as it publishes, today's technical signal and key levels, live price — on one page.
See all GBP/USD forecastsGBP/USD Holds $1.3388 – EMA 50 Defense on 4h
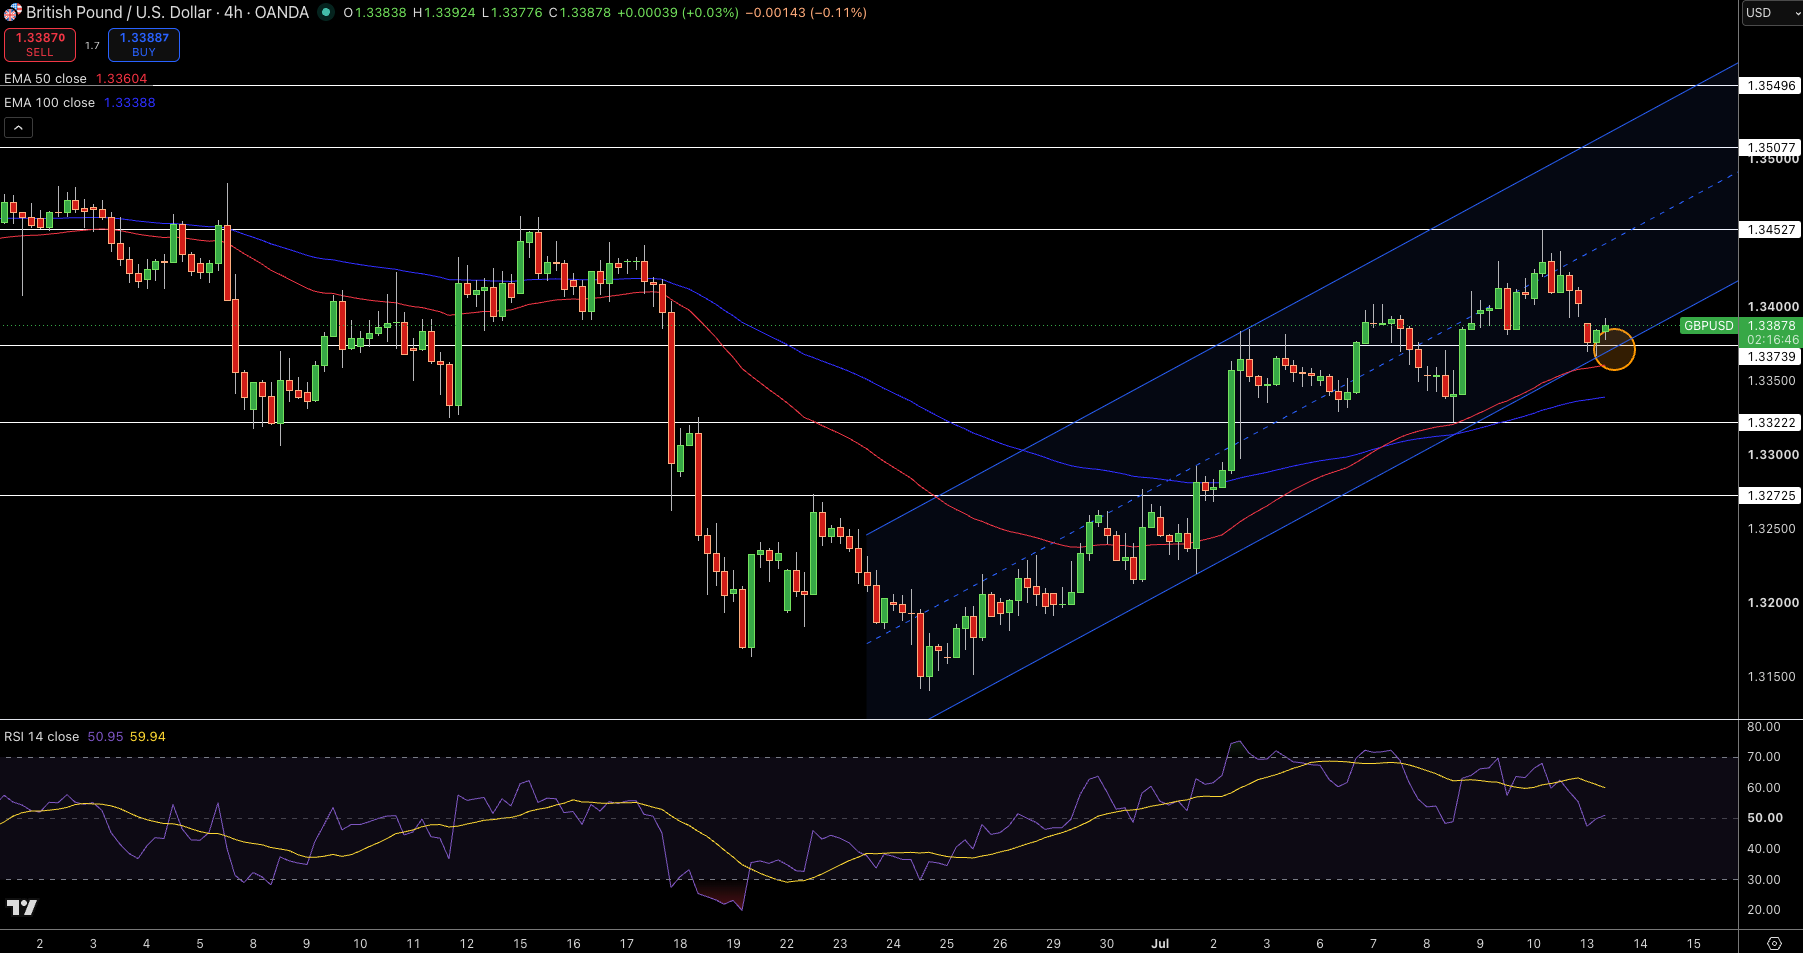
The British pound was trading near $1.3388 on the 4h timeframe chart. The mixed candles defending the 4h chart 50-EMA near 1.3360 were kicked off near the red MA around 1.337, according to the 4h GBP/USD price chart.
The bullish wicks represent buyers’ absorption around support levels, confirming higher lows are still in tact. The RSI sits near 51. The volume profile identifies 1.331-1.338 as a reliable pivot. We note that the resistance is located around 1.345-1.350.
The GBP/USD is maintaining a neutral-to-bearish structure at the 4h 1.345 EMA-50 as the price oscillates inside a sideways trading range. The higher lows indicate that the buyers remain on the sidelines, looking to buy at any pullback.
Based on the current technical outlook, I would consider a long position around 1.3388, targeting 1.345, with a stop below 1.325.
EUR/USD Holds $1.1440 – EMA 50 Defense on 4h
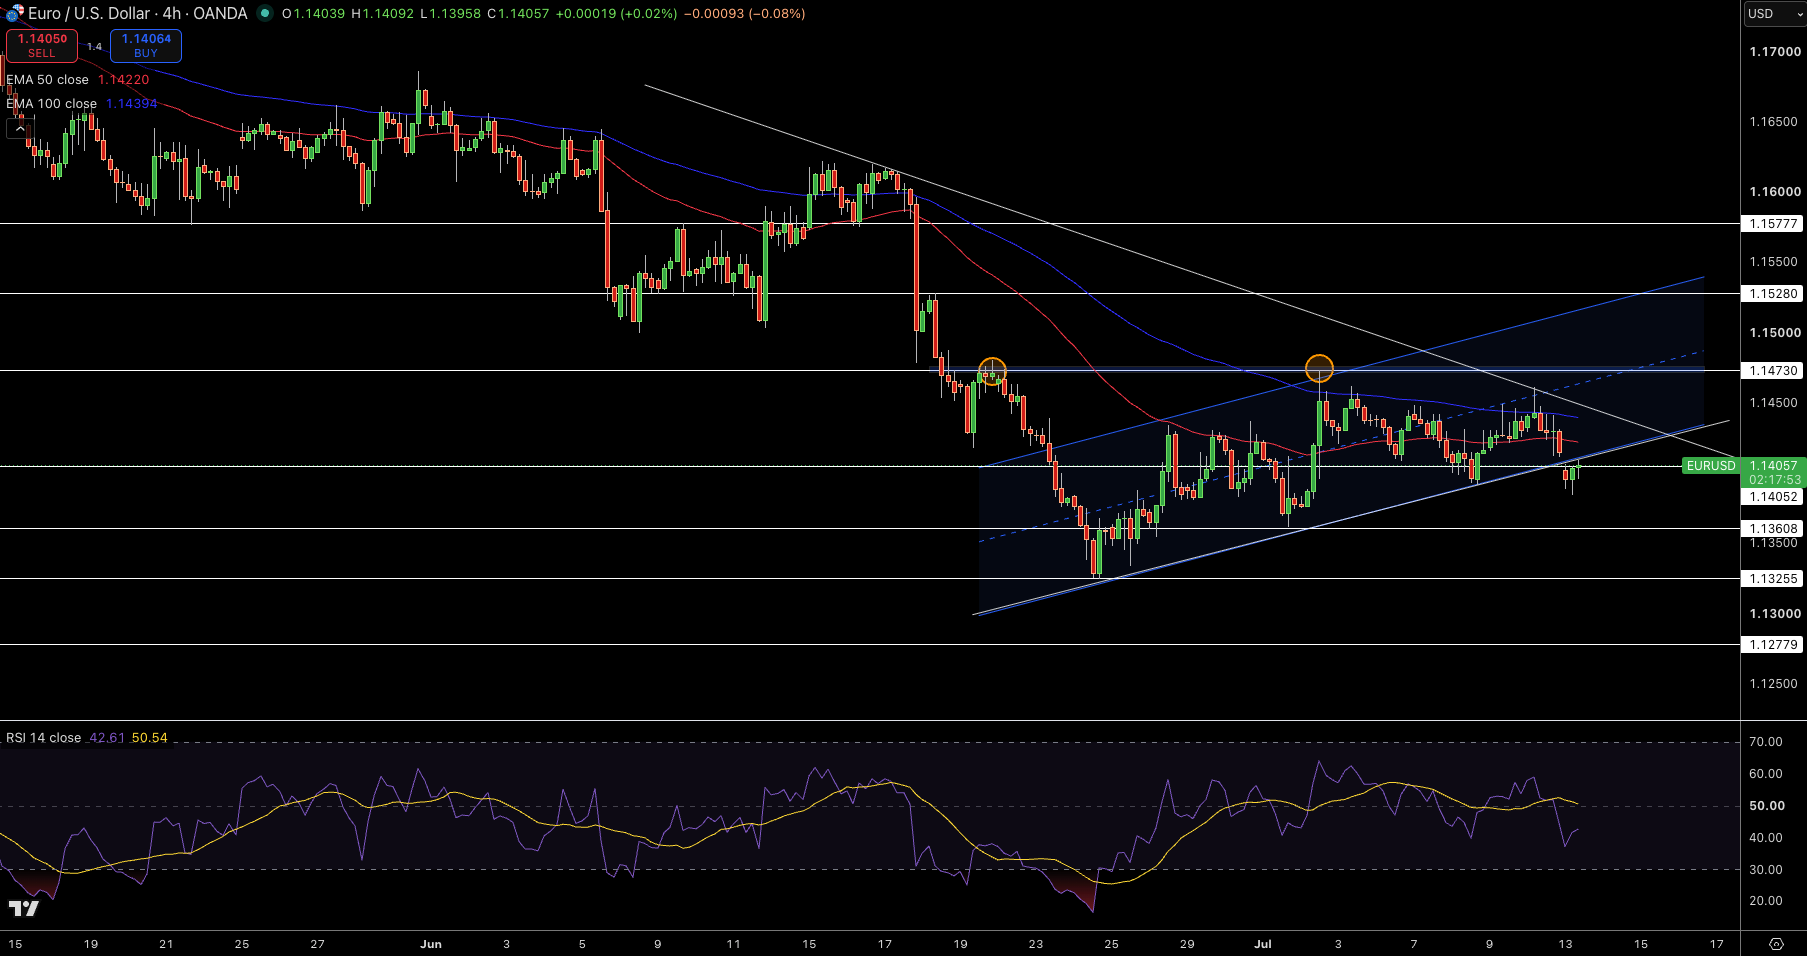
The euro (EURUSD) was trading near $1.1440 on the 4h timeframe chart. The 4h EUR/USD chart shows that the mixed candles are defending the 4h chart 50-EMA near $1.1423 after the bears were kicked off near the $1.162 red MA. We see that the bullish wicks represent buyers’ absorption near support levels while the higher lows are being held on the 4h EUR/USD.
The RSI sits near 43. The volume profile confirms a reliable pivot around 1.140-1.150. The next resistance is located around 1.155-1.162. The EUR/USD price action remains neutral-bearish near the 1.150 EMA-50 on the 4h timeframe chart as the price trades inside the long-term downtrend. Higher lows keep the buyers engaged, as they enter at any dips in this zone.
Based on the current technical outlook, I would consider a long position around 1.1440, targeting 1.155, with a stop below 1.140.