Gold (XAU) prices plunged early Monday and dipped below $4,100 as Middle East tensions returned. Oil prices rose on fresh U.S. attacks targeting Iran and as Tehran closed the Strait of Hormuz. Higher energy prices reignited the inflation concerns and reinforced expectations that the Fed will maintain the tight policy. The US dollar also bounced back from the key support that had weighed on gold.
Traders are now waiting for the US CPI data and Fed Chairman Kevin Warsh’s testimony for clues regarding inflation and interest rates. If the oil prices, the dollar and Treasury yields remain strong, gold could continue to decline.
Silver (XAG) also follows the gold prices when precious metals continue to decline. But if energy prices stay strong, there could be some support for silver on the industrial side. Higher energy prices accelerate the shift towards renewable energy such as solar. The renewable energy sector uses a massive amount of silver for conductivity. This provides the industrial support for silver.
The short term direction for metals depends on the US-Iran conflict, oil prices and CPI data. The higher inflation data may put further pressure on gold and silver prices.
Gold Price Forecast: $3,950 Support Faces a Critical Test
XAUUSD Daily – $4,200 Resistance Caps the Rebound
The daily chart for spot gold shows that the price has achieved the target of the ascending broadening wedge pattern at $3,950. The price has been consolidating for the past two weeks and is trying to rebound higher from the support zone. But the rebound so far is weak, and the price remains capped below the initial resistance of $4,200.
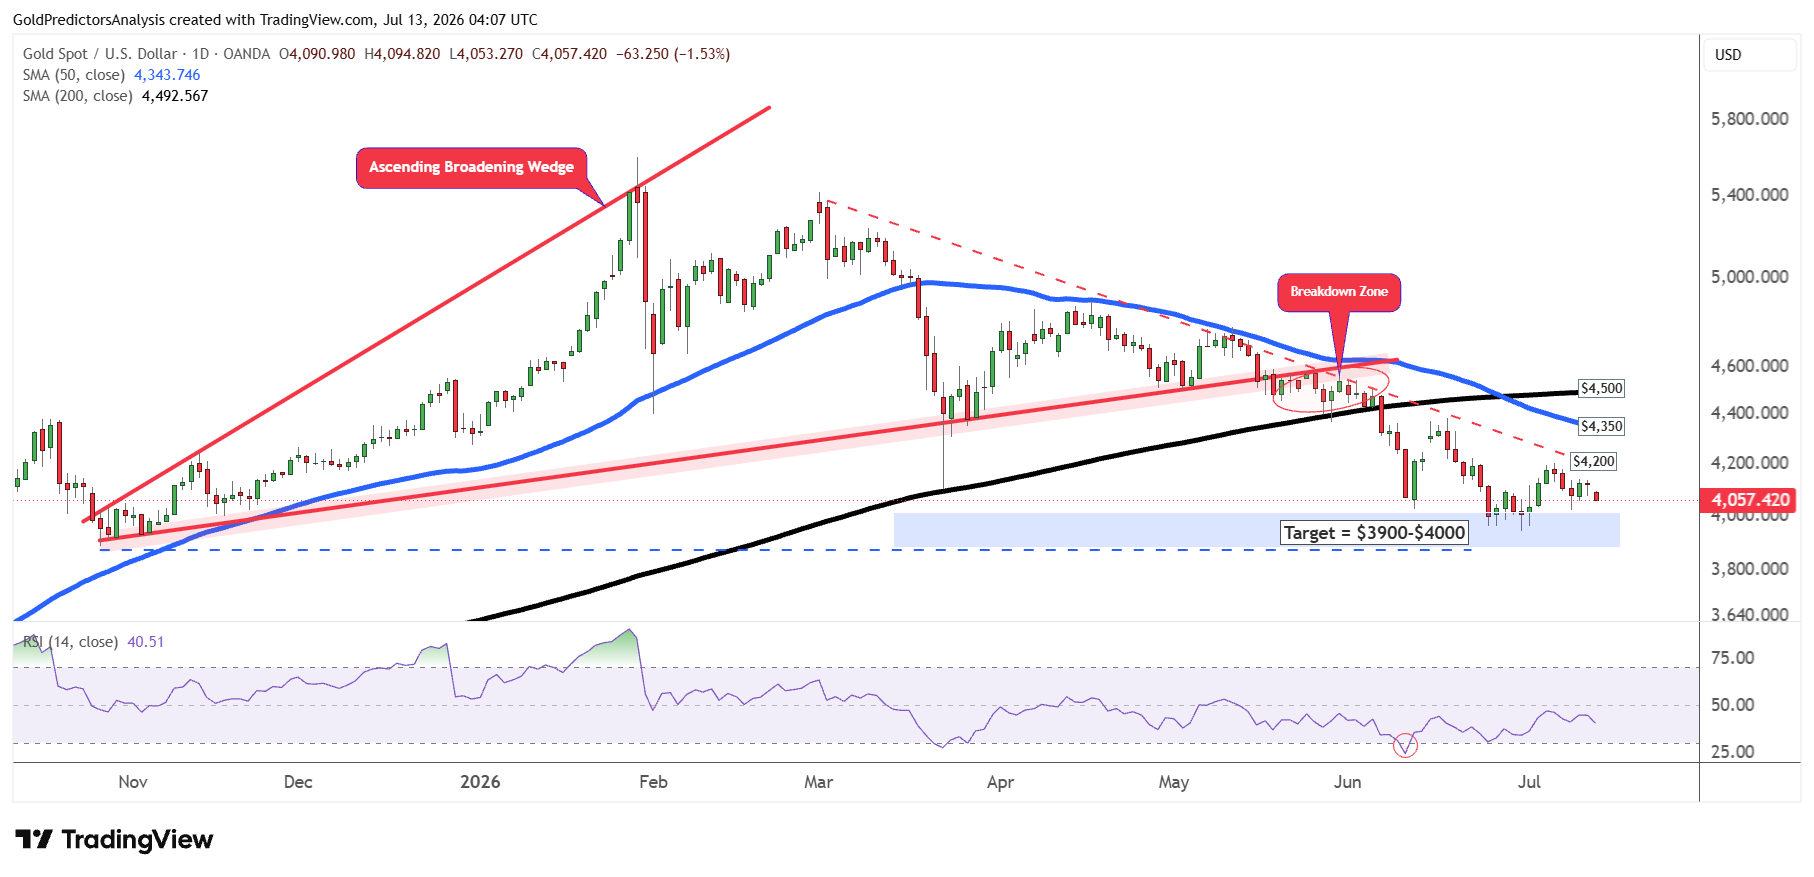
This resistance is defined by descending trend line extending from the March 2026 highs. A break above $4,200 will push the price toward the 50-day SMA at $4,350. A break above $4,350 will push the price to $4,500. As long as the price remains below $4,500, the gold price remains negative.
A break below $3,950 will put further pressure on gold prices and introduce further downside toward $3,800. The importance of the current support zone in the gold market is shown by the descending broadening wedge pattern that extends from the January 2026 highs.
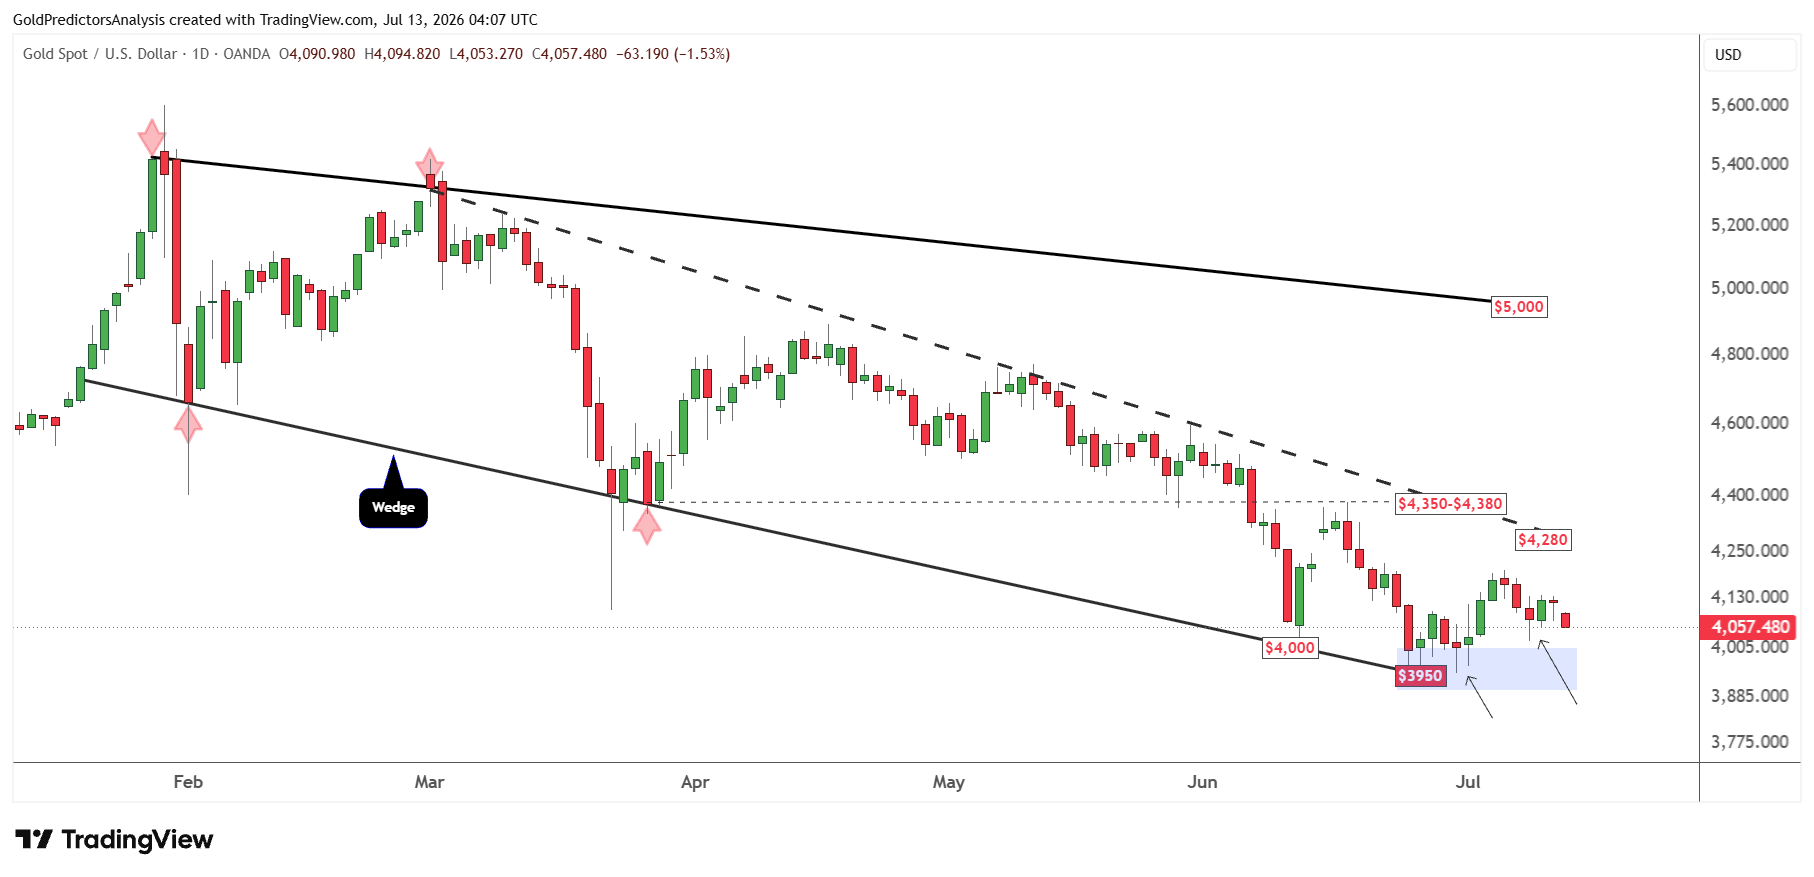
A break above $4,350 is required to show some short-term strength and push the price toward the $5,000 area.
Gold Price Forecast
Every new Gold analysis as it publishes, today's technical signal and key levels, live price — on one page.
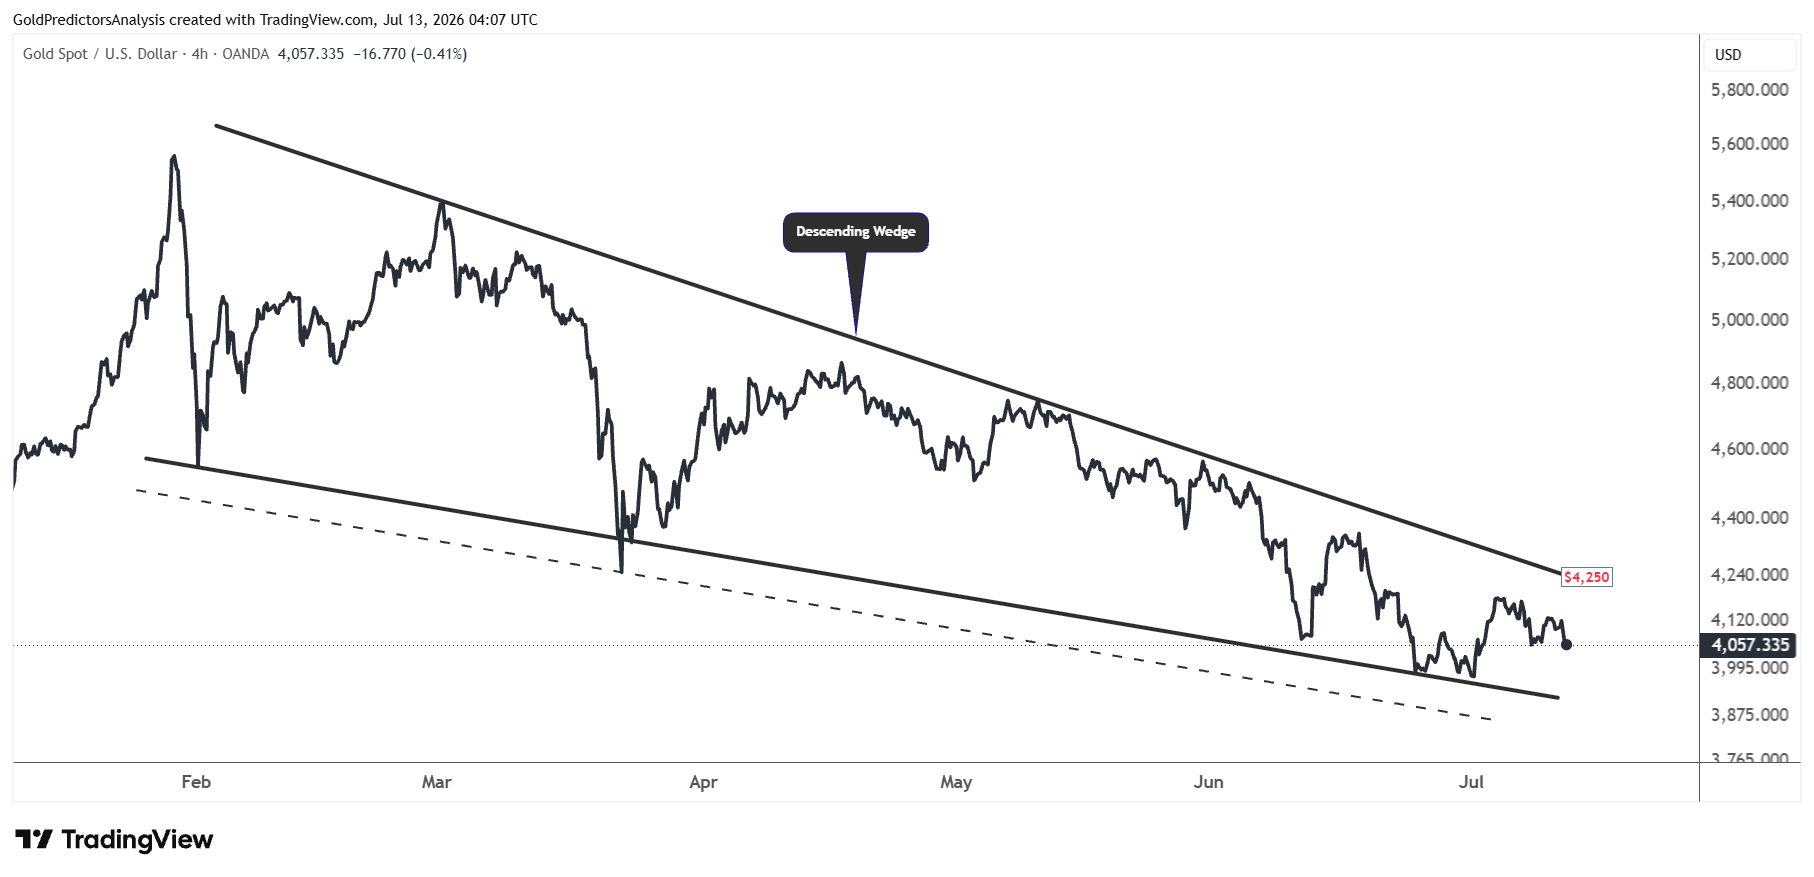
See all Gold forecastsXAUUSD 4-hour – Wedge Breakout Could Trigger the Next Move
The 4-hour chart for spot gold also shows that the price is approaching the apex of the descending wedge pattern. A break above $4,250 would indicate a strong move to the upside. However, a break below $3,950 will indicate pressure in the gold market.
The emergence of this pattern indicates that prices may be compressing within a tight range in the short term before the next strong move.
Silver Price Forecast: $55 Support Holds the Key to the Next Move
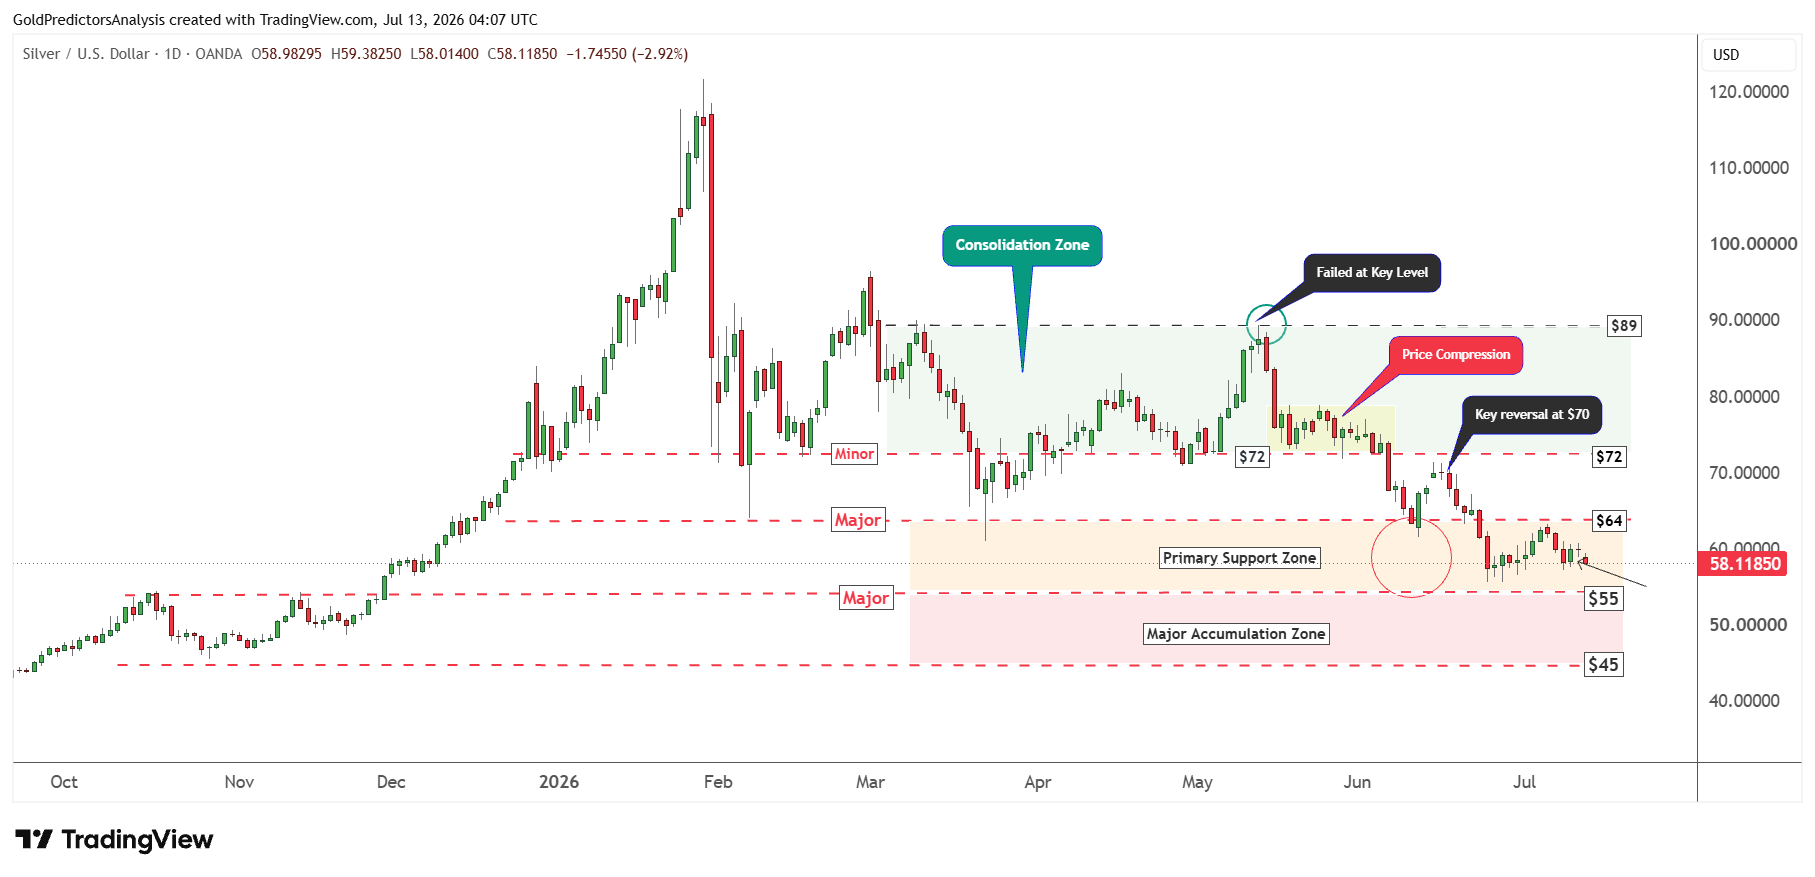
XAGUSD Daily – Silver Under Pressure Below $72
The daily chart for spot silver also shows similar consolidation and price compression between $55 and $64. This zone remains the primary support zone. A break above $64 will push the price toward $72. On the other hand, a break below $55 will introduce further downside and push the price toward the $45 area.
The $45 to $55 range remains the major consolidation zone in silver prices. A drop toward this zone will likely offer a strong long term buying opportunity for silver investors. But the silver price must break above $72 to confirm a bottom and initiate a rally toward $89.
XAGUSD 4-hour – Wedge Break Above $72 Could Target $90
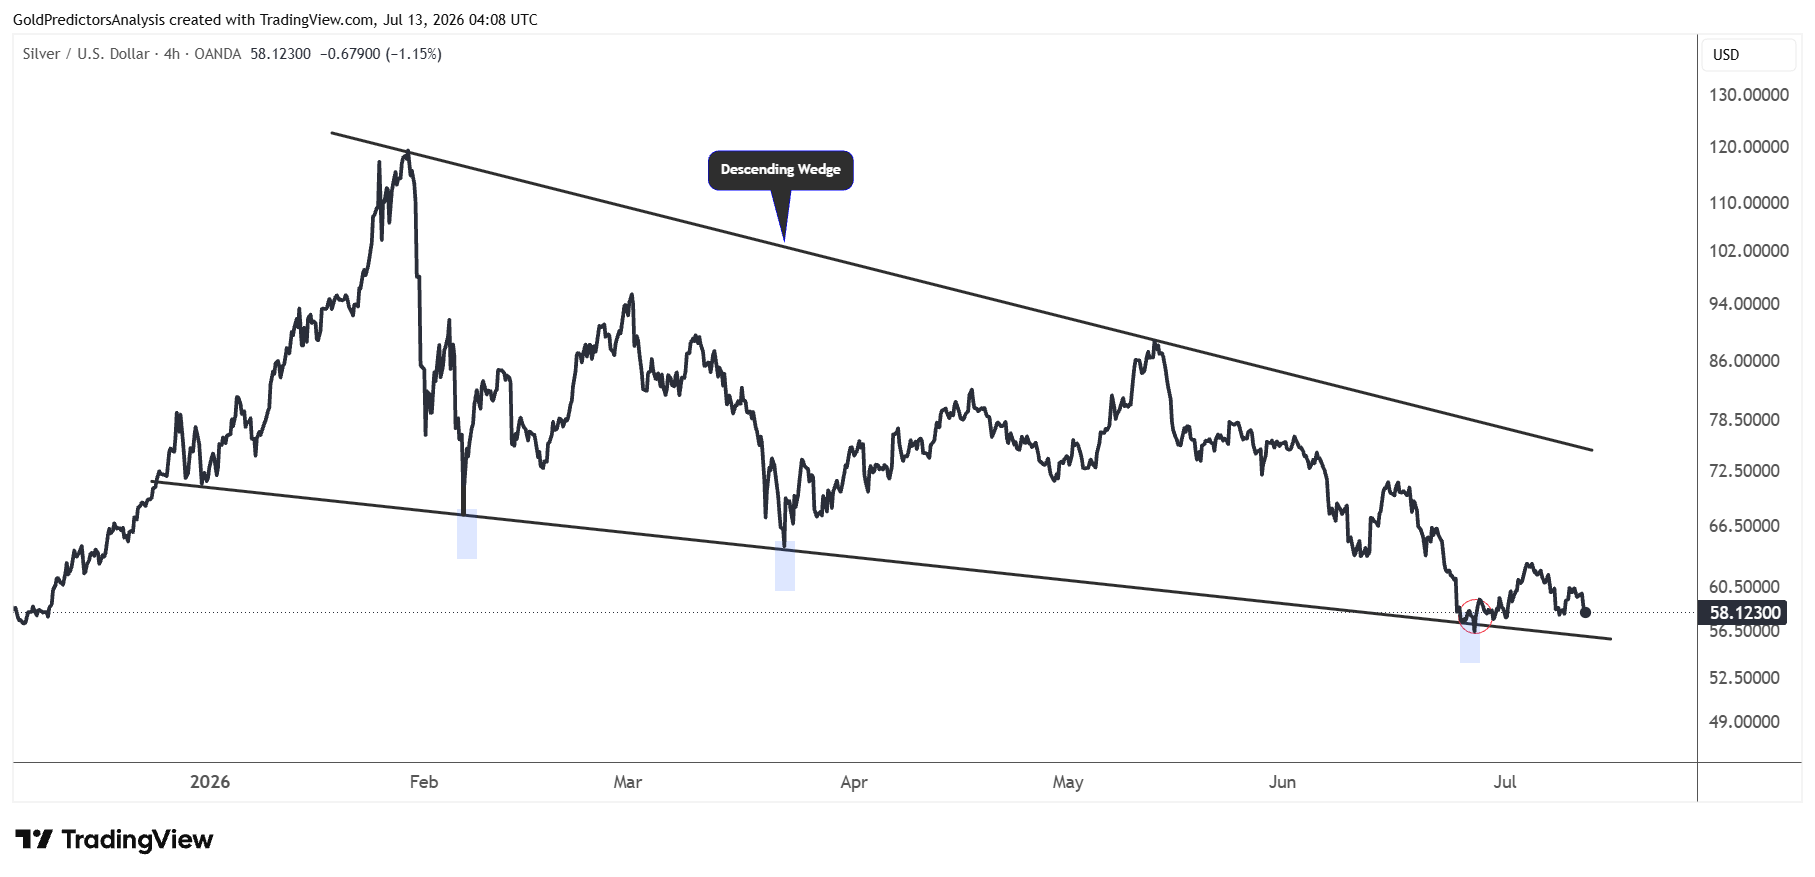
The 4-hour chart for spot silver shows that prices are compressing near the apex of the descending wedge pattern. The $72 level remains the resistance defined by the descending trend line of this wedge pattern. A break above $72 will signal a strong surge toward $90 and then the $100 region.
Bottom Line
Higher oil prices, inflation worries and a stronger U.S. dollar are keeping gold and silver under pressure. A break above $4,200 will push the price to $4,350, but gold needs to hold above $3,950 to avoid another drop to $3,800.
Silver is also consolidating between $55 and $64. A break of these levels will likely define the next move in the silver market. A break above $72 may push silver to $89. On the other hand, a break below $55 will likely open the door for a final drop to $45. The next move in both metals will depend on the developments in the US-Iran conflict, oil prices, CPI data and Fed policy signals.