Fed Day Bounce Looks Like Positioning, Not Conviction
Stocks are trying to build ahead of the Fed decision but the early move has no conviction behind it. Tuesday told the real story. The Nasdaq dropped 0.78%. The Dow lost 0.63%. The S&P 500 fell 0.45%. Growth sold first when the 10-year broke 5% and the bounce Wednesday morning has not changed the order. The index leading the futures higher is the same one that took the hardest hit when yields climbed.
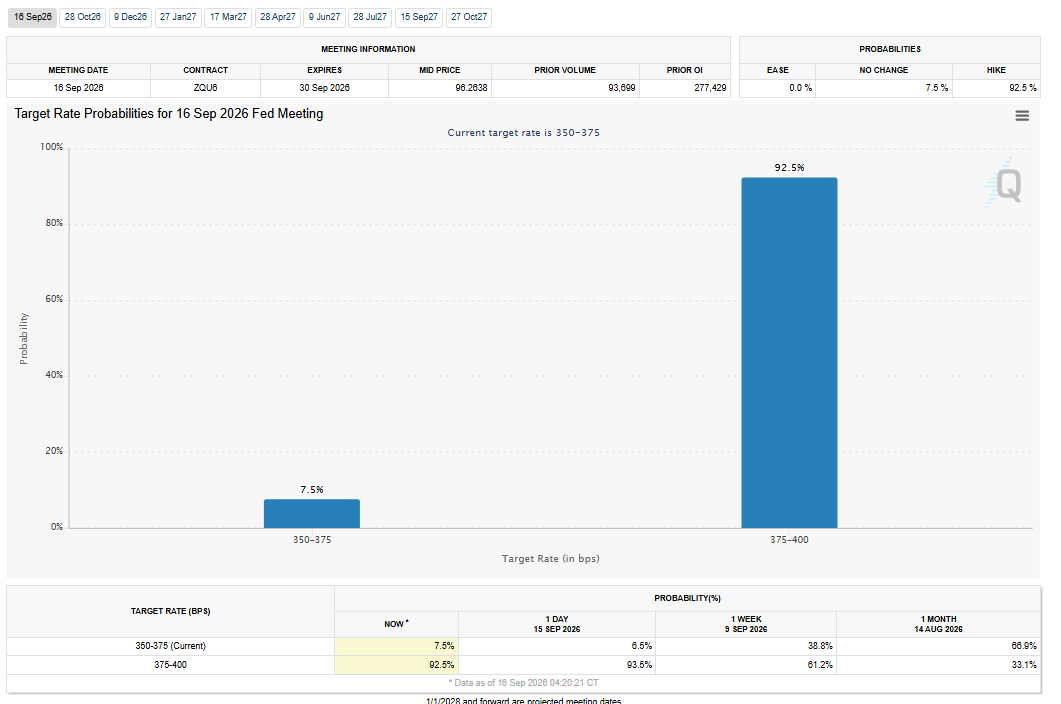
The hike is priced at better than 90% odds. What is not priced is Warsh’s tone on oil, on December, and on whether one adjustment is enough with crude still near $105 and the 10-year sitting at 2007 levels. That is the only thing that matters today and it does not arrive until 18:00 GMT.
December E-mini Dow futures are trading 52,580.00, up 54 points or 0.10%. December E-mini S&P 500 futures are at 7,670.75, up 14.75 or 0.19%. December E-mini Nasdaq-100 futures are trading 29,368.25, up 121.50 or 0.42%.

Daily December E-mini S&P 500 Index Futures Technical Analysis
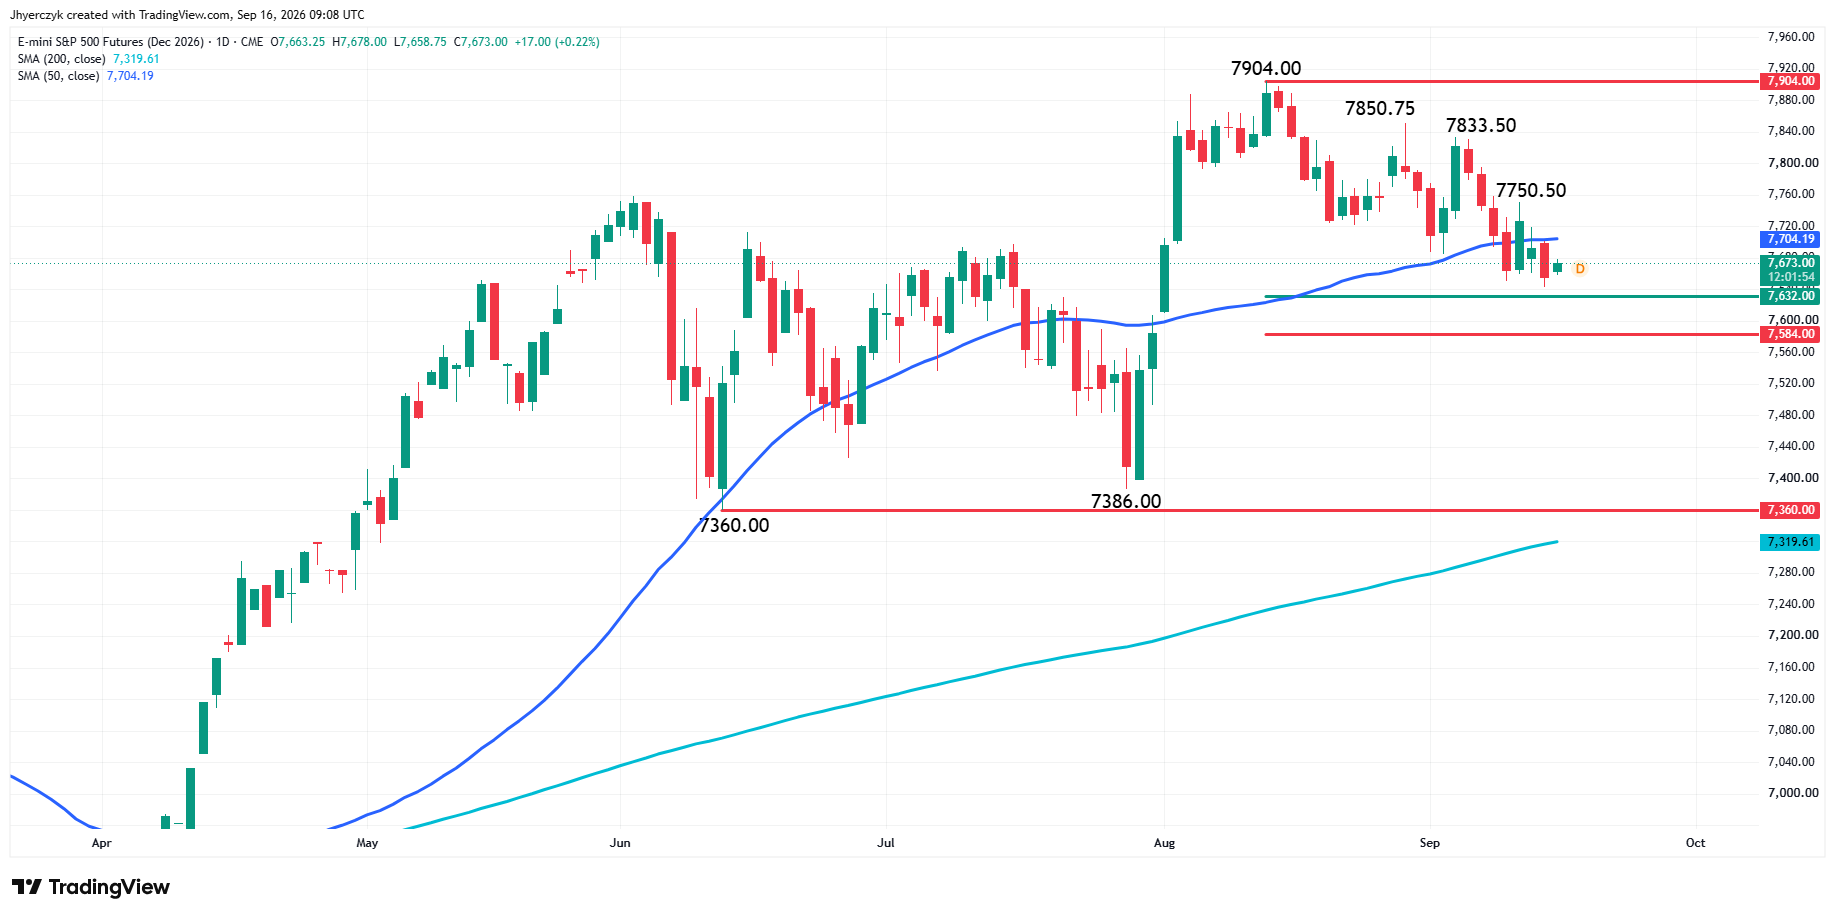
December E-mini S&P 500 Index futures are edging higher early Wednesday. The main trend is down according to the daily swing chart. A trade through 7833.50 will change the main trend to up. A move through 7643.50 will signal a resumption of the downtrend.
The minor trend is also down. A trade through 7750.50 will change the minor trend to up and shift momentum to the upside.
The index is also trading on the weak side of the 50-day moving average at 7704.10. This indicator is controlling the strength of the current downtrend.
The short-term range is 7386.00 to 7904.00. Its retracement zone at 7632.00 to 7584.00 is the primary downside target area.
Dow Jones Price Forecast
Every new Dow Jones analysis as it publishes, today's technical signal and key levels, live price — on one page.
See all Dow Jones forecastsWarsh’s Press Conference Is the Whole Trade
The Fed announces at 18:00 GMT with updated projections. Warsh talks at 18:30 GMT. The quarter-point is already done in the market’s eyes. Nobody in equities is trading the rate move itself.
The bond market is not waiting. The 10-year broke 5% Tuesday and stayed there with oil near $105 sitting behind the move. Bond sellers have been comfortable all week and nothing short of Warsh closing the door on December is going to change that. Stocks need him to call this a one-time adjustment and move on. That is the only version of Wednesday that pulls the 10-year back from 5% and gives this morning’s bounce a chance to hold into the close. Anything less and the long end stays in charge of the equity market the same way it has been since Tuesday morning.
The API Number Helped Futures. It Did Not Fix the Oil Story.
The American Petroleum Institute reported a 7.1-million-barrel build in U.S. crude inventories. WTI slipped toward $105 and Brent fell toward $108. Futures caught a lift from the pullback.
Crude is still within striking distance of four-month highs. Saudi Arabia is working to restore part of the East-West pipeline but repairs could take weeks. Hormuz and Bab el-Mandeb shipping risks are still in the price. The API build gave traders a reason to take a breath. It did not change the supply picture. Oil does not have to rally from here to keep the inflation argument alive going into Warsh’s press conference. It just has to stay where it is.
The Nasdaq Is Leading a Rally It Cannot Sustain Alone
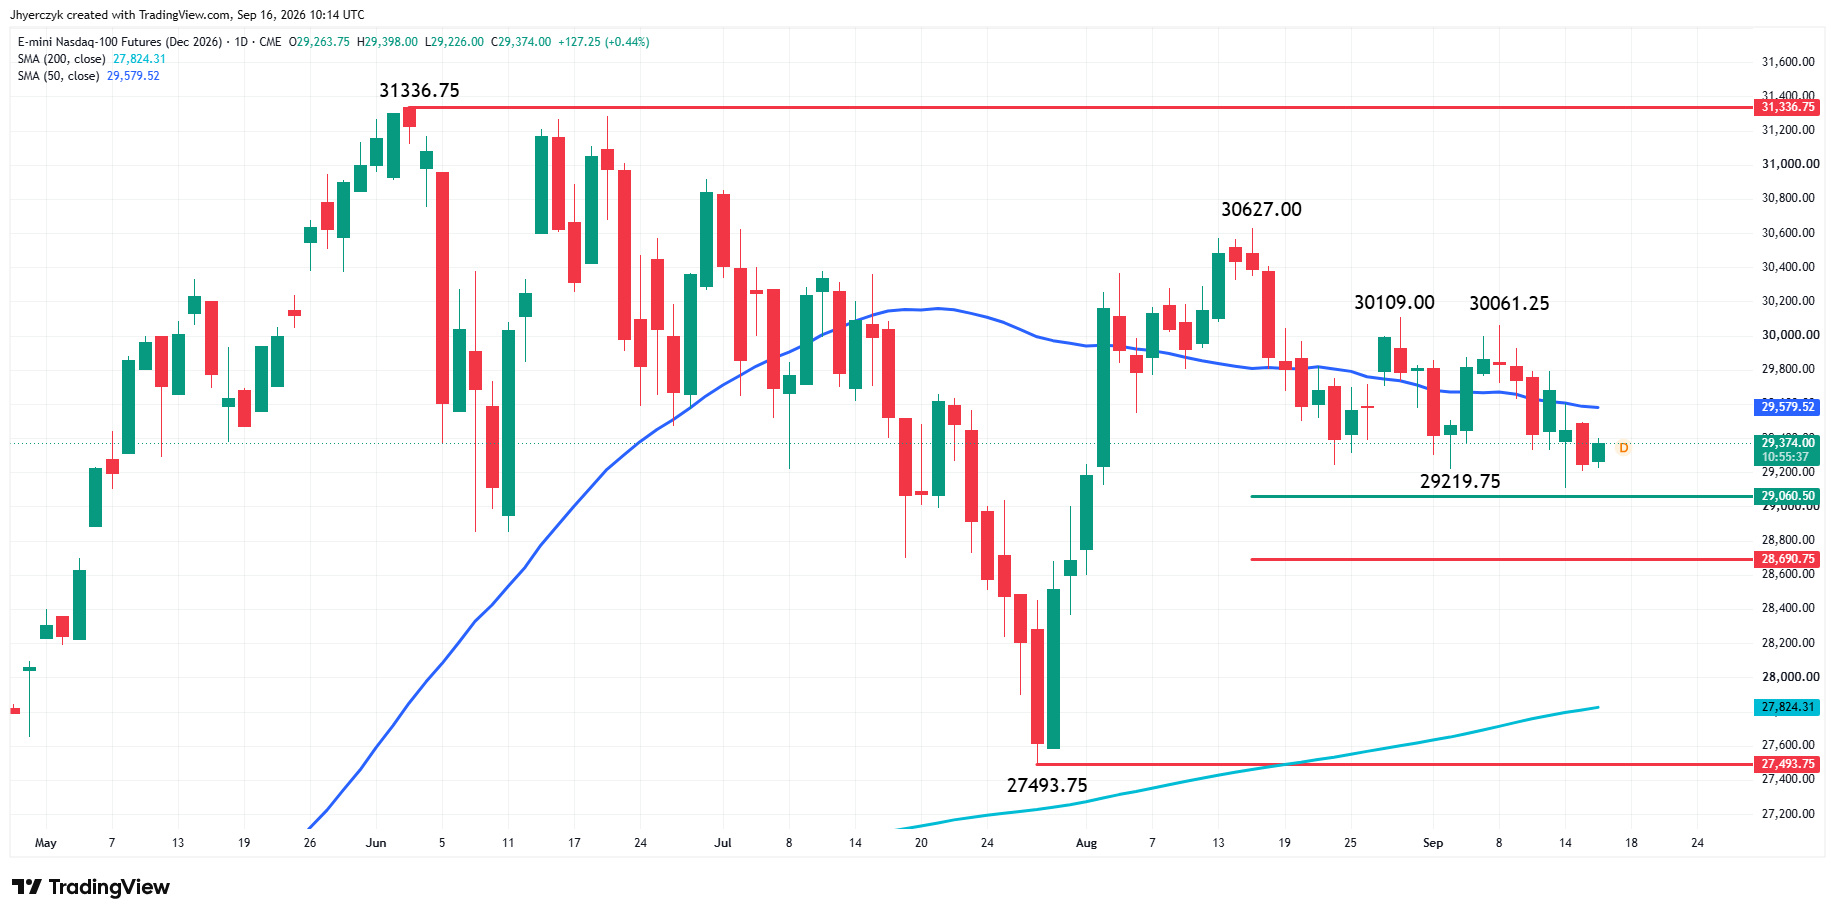
The Nasdaq is up 0.42% in the pre-market and the Dow is barely moving at 0.10%. That gap tells you who is buying. Chips and big tech came in off Tuesday’s lows because that is what they do after a hard down day. The trade is reflexive at this point.
That pattern works until the bond market breaks it. Tuesday proved the order. Tech sold first when yields moved. The AI rebound helped Monday. It did not prevent Tuesday from being the worst session for growth since last week’s selloff started. Wednesday’s early bid is the same trade and it is running straight into a Fed decision where the press conference can pull the yield either direction.
The Dow is not getting the same lift because its heaviest names are the ones most exposed to higher borrowing costs. Goldman took 180 points out of the average Tuesday. UnitedHealth, Home Depot and American Express added to the damage. Those stocks are not bouncing on an AI bid. They need yields to retreat and there is no reason for that retreat to start before 18:00 GMT.
What to Watch
Everything before 18:00 GMT is noise. The 10-year yield at 5% is the line the market drew this week and the Fed decision determines whether it holds or breaks. Warsh’s press conference at 18:30 GMT is where the stock market finds out if the early bounce has any legs. Oil near $105 is sitting in the background making it harder for Warsh to sound comfortable. The API build gave crude a reason to ease but the supply story behind it has not changed. If crude stays firm into the close, the inflation argument walks right into the press conference with Warsh.
The bias leans bearish on the S&P 500 with the main trend down and the index trading below its 50-day moving average at 7704.10. That moving average is resistance until proven otherwise. A push through 7750.50 would flip the minor trend to up and start to weaken the bearish case, but the main trend does not change until 7833.50 is taken out and that is nowhere near Wednesday’s pre-market levels. On the downside, a break through 7643.50 resumes the selling with the retracement zone at 7632.00 to 7584.00 as the first target. Value buyers may show up there. They have not shown up yet.
More Information in our Economic Calendar.