



Copper (XCU) prices recovered toward $6.50 after finding support near $6.36, but the outlook remains uncertain in the short term. The strong factory activity in China and rising demand from AI and power grids support the market. But the weak Chinese investment, higher LME inventories and strong U.S. dollar may limit the recovery. In my view, the reaction around the $6 and $7 levels will determine the next major move. This article presents the key macro drivers, technical levels and trends that may shape the next move in copper.
China Factory Growth Supports Copper as Investment Weakens
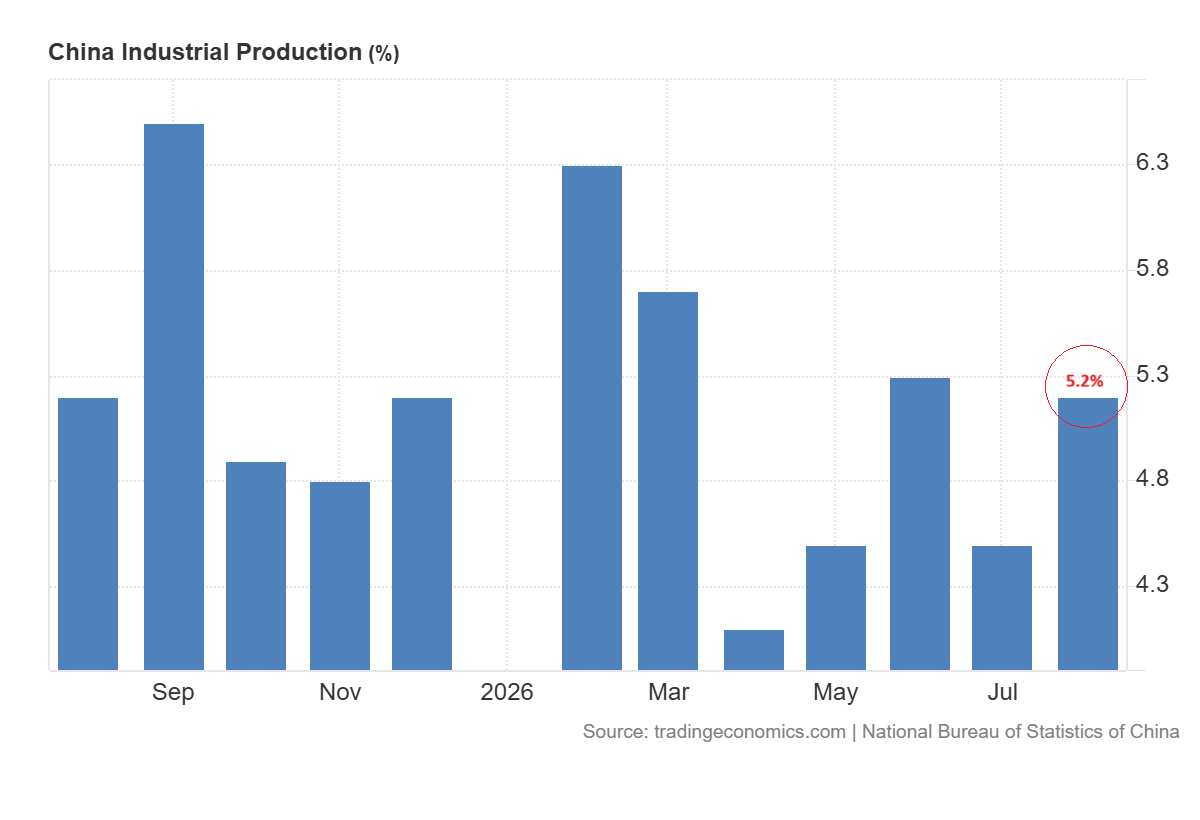
Copper prices moved back above $6.40 per pound on Wednesday as the data from China was strong and improved market sentiment. Industrial output increased 5.2% year over year in August. This was above 4.5% in July and the forecast of 4.8%. The manufacturing output also increased to 6.1%. These figures supported the demand for copper because electrical equipment, machinery and power systems consume large amounts of the metal.
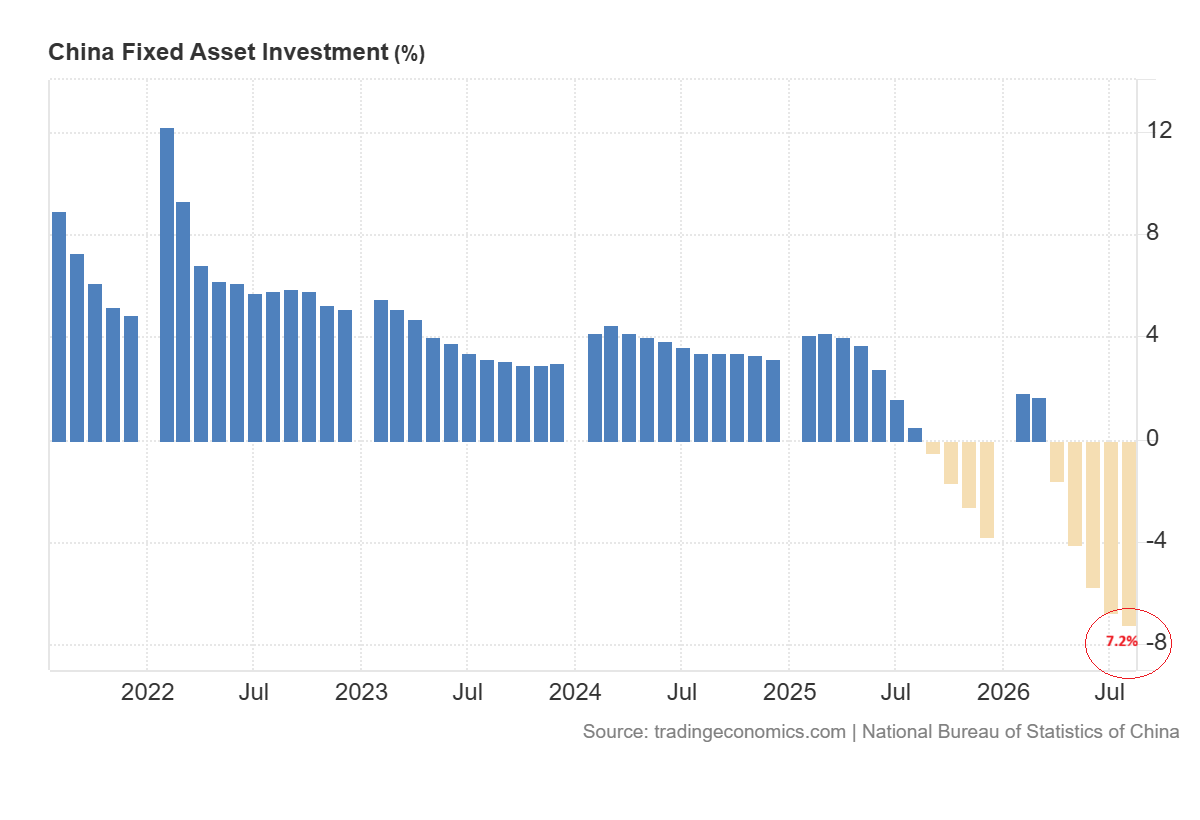
But the recovery in China remains uneven. The chart below shows that fixed asset investment dropped 7.2% during first eight months of 2026.
The property investment also plunged 19.9% while infrastructure investment declined 4.0%. Retail sales grew only 0.4% in August.
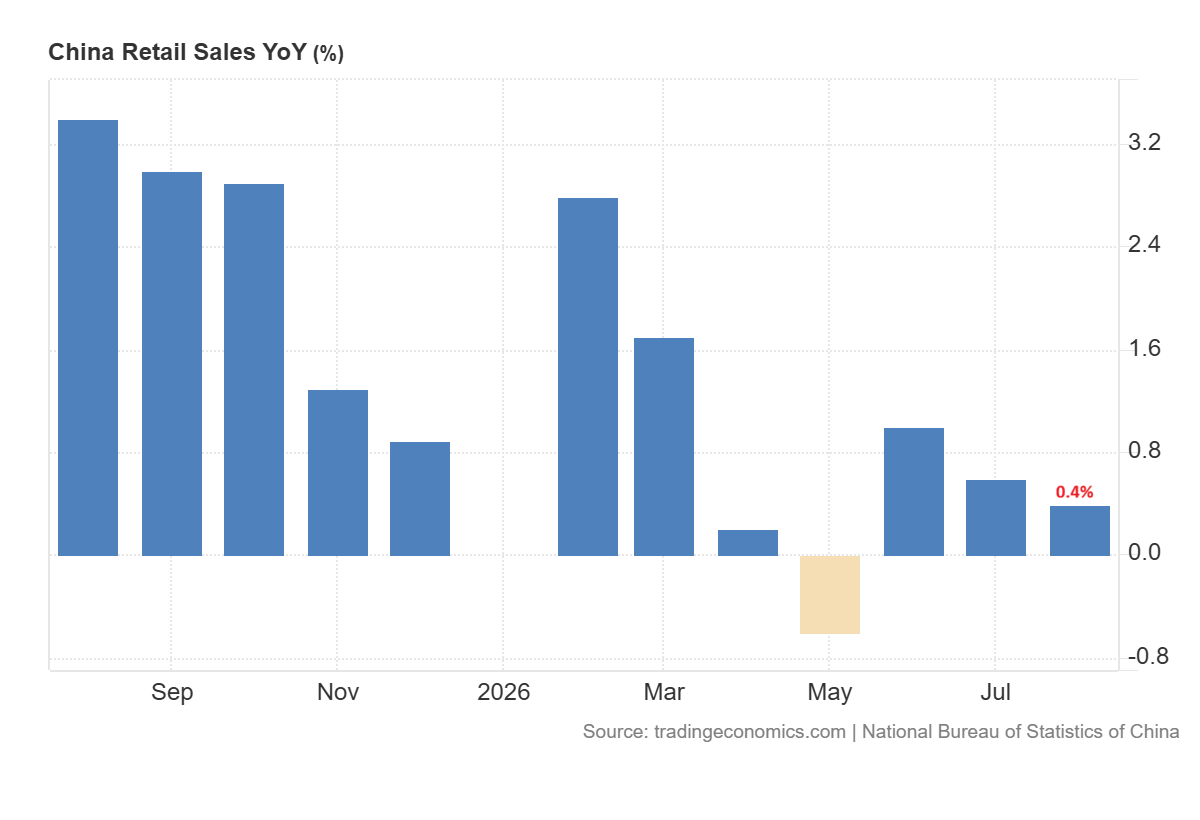
This weakness is important as the major sources of demand for copper are construction and infrastructure. The factory data support the price of copper but the broad rally needs stronger domestic demand and policy support to be more effective.
Copper Price Forecast
Every new Copper analysis as it publishes, today's technical signal and key levels, live price — on one page.
See all Copper forecastsRising LME Inventories and Strong Dollar Limit Copper Gains
The physical market has also become less tight. LME warehouses recorded largest copper inflow in nearly four weeks and the cash contract moved into contango. This change shows that metal availability has improved in the near term.
U.S. tariff uncertainty still distorts the flows of trade. Buyers had moved copper into the United States before possible tariffs but reports of a delayed decision removed part of that supply premium.
The wider macro picture remains mixed. The dollar index eased to 99.59 on Wednesday but it remained near multi-week highs. The strength in the US dollar can limit the demand for copper outside the United States.
Brent crude near $108 also raises mining, smelting and transport costs. But high energy prices can weaken global growth. The Fed decision may add the volatility in the short term.
In my view, the demand for China and LME inventory trends will have the stronger influence on copper. But AI and grid investment support the outlook for copper in the long term.
Copper Price Technical Analysis: $6 Support and $7 Resistance
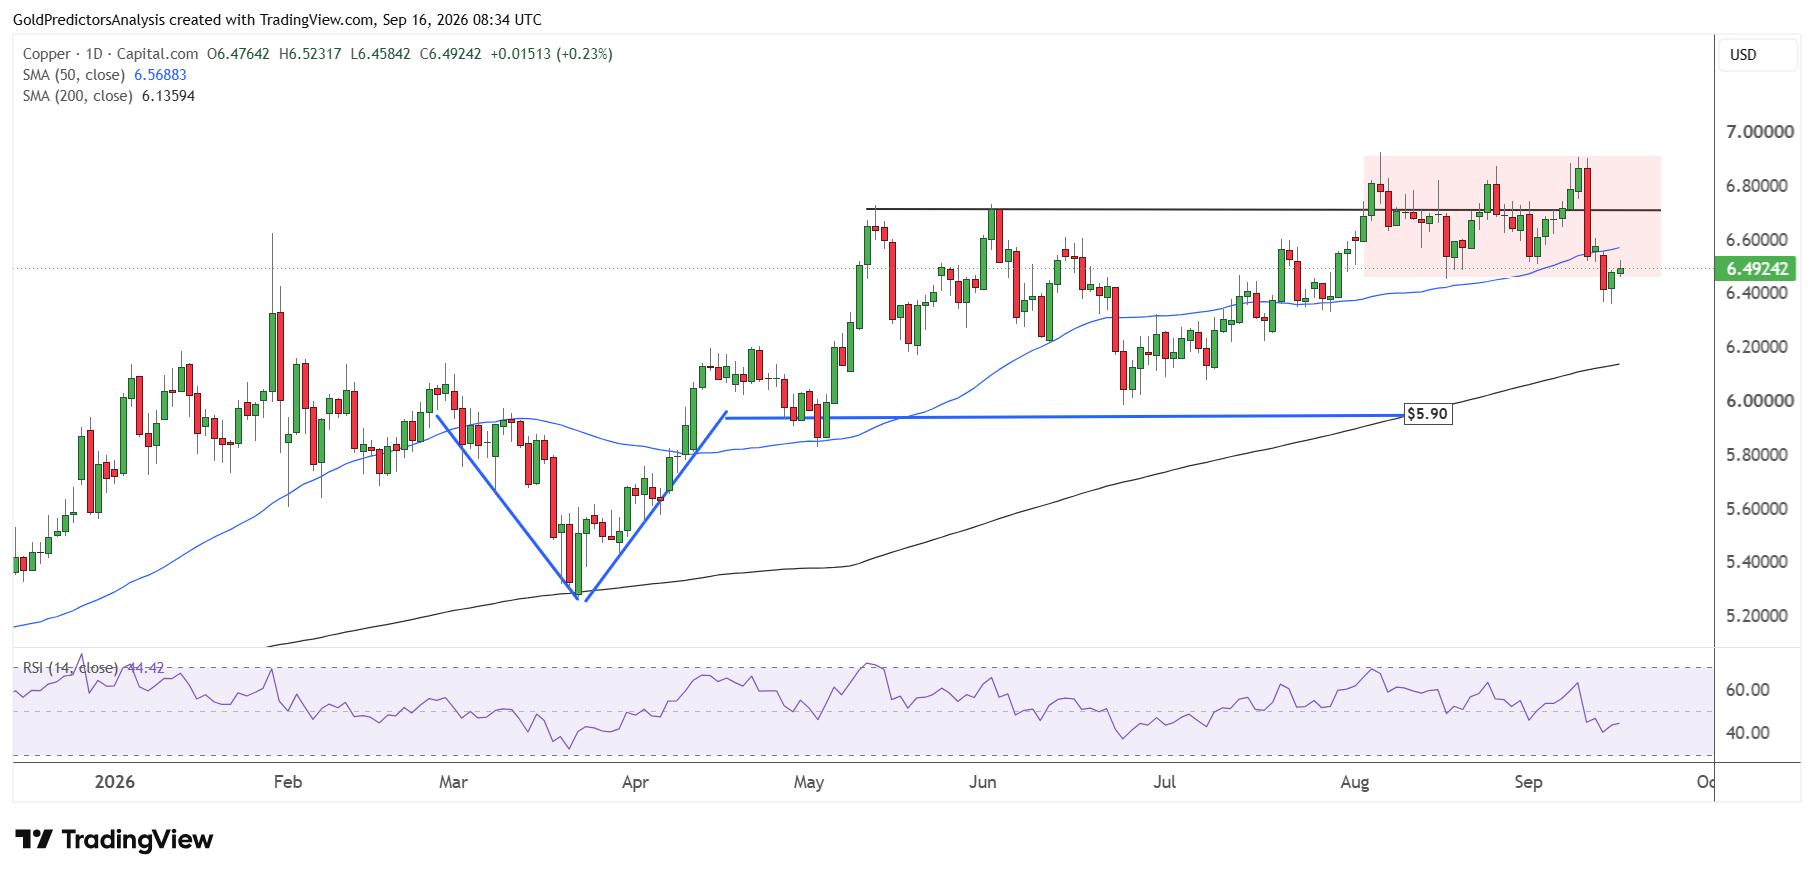
Copper prices faced strong resistance near $7 and produced a strong drop last week. Prices continued to decline on Monday and Tuesday and marked a low of $6.36 on Tuesday. The reversal on Tuesday produced a bullish hammer candle.
Now, the price is again moving toward the 50-day SMA near $6.55. If the price remains below this level, it will likely increase the chance of another drop toward the 200-day SMA near $6.15.
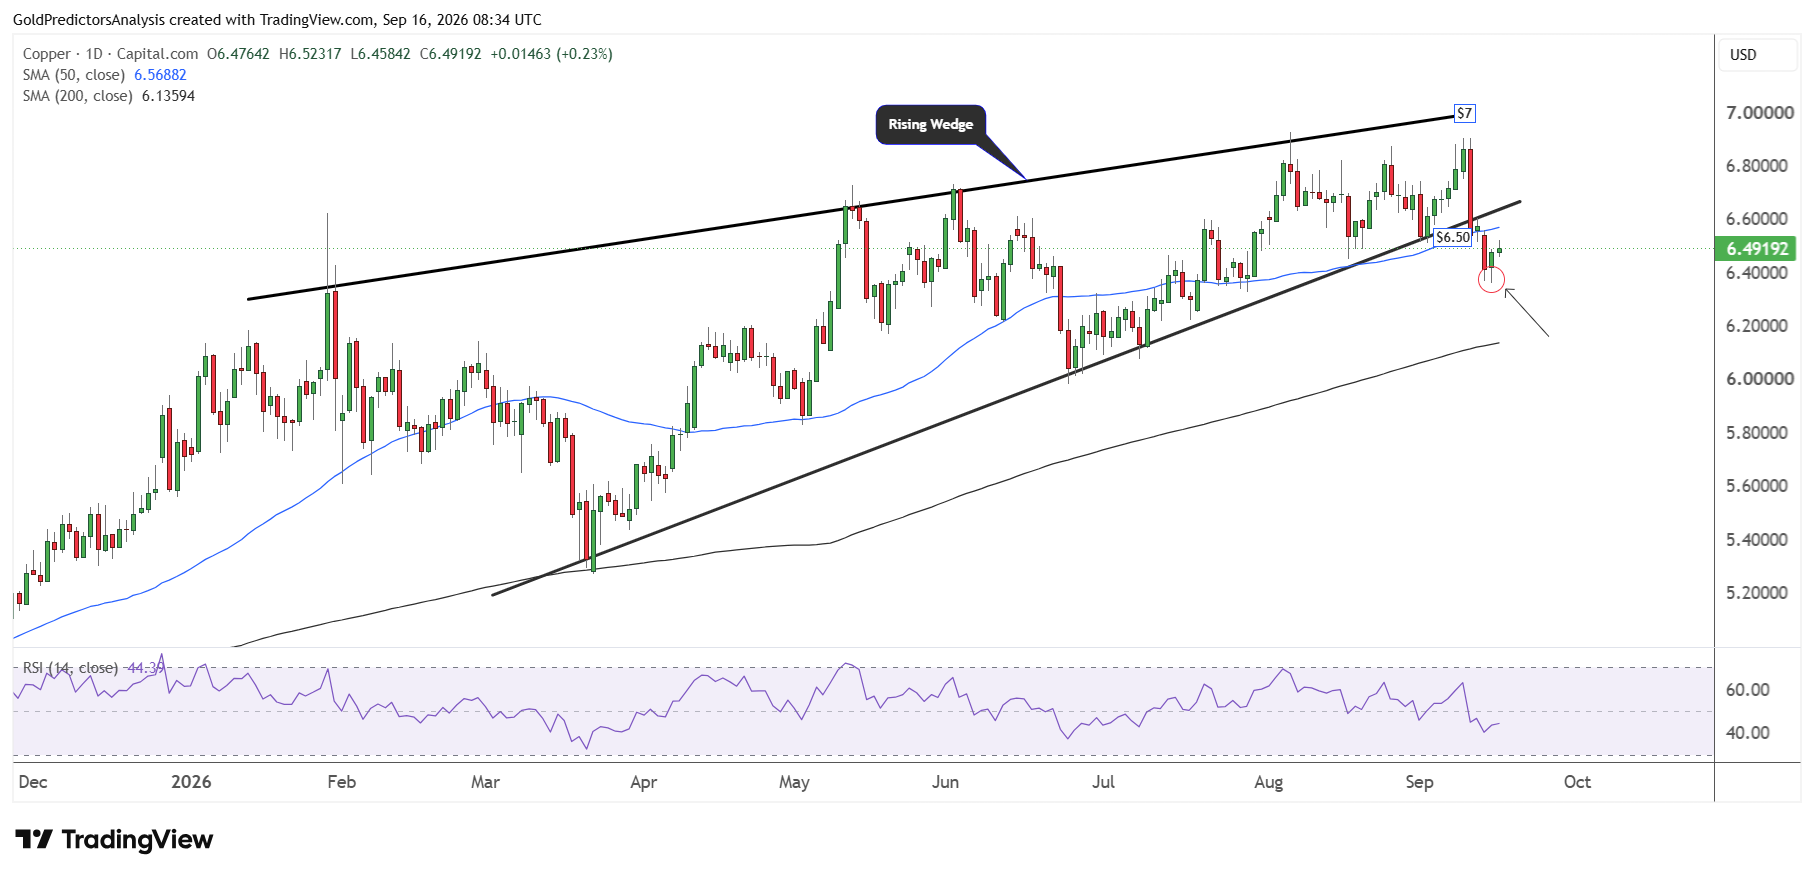
But the RSI remains below the midline, which increases pressure in the copper market in the short term. Moreover, copper has already broken the wedge pattern, which suggests that it may continue to drop toward the $6 area in the short term.
The strong uncertainty around the current resistance zone is also observed on the weekly chart, which shows that prices remain in expensive zones. If prices remain above the $6 area, they may show strong volatility. A clear break of $6 or $7 is required to define the next move in the copper market.
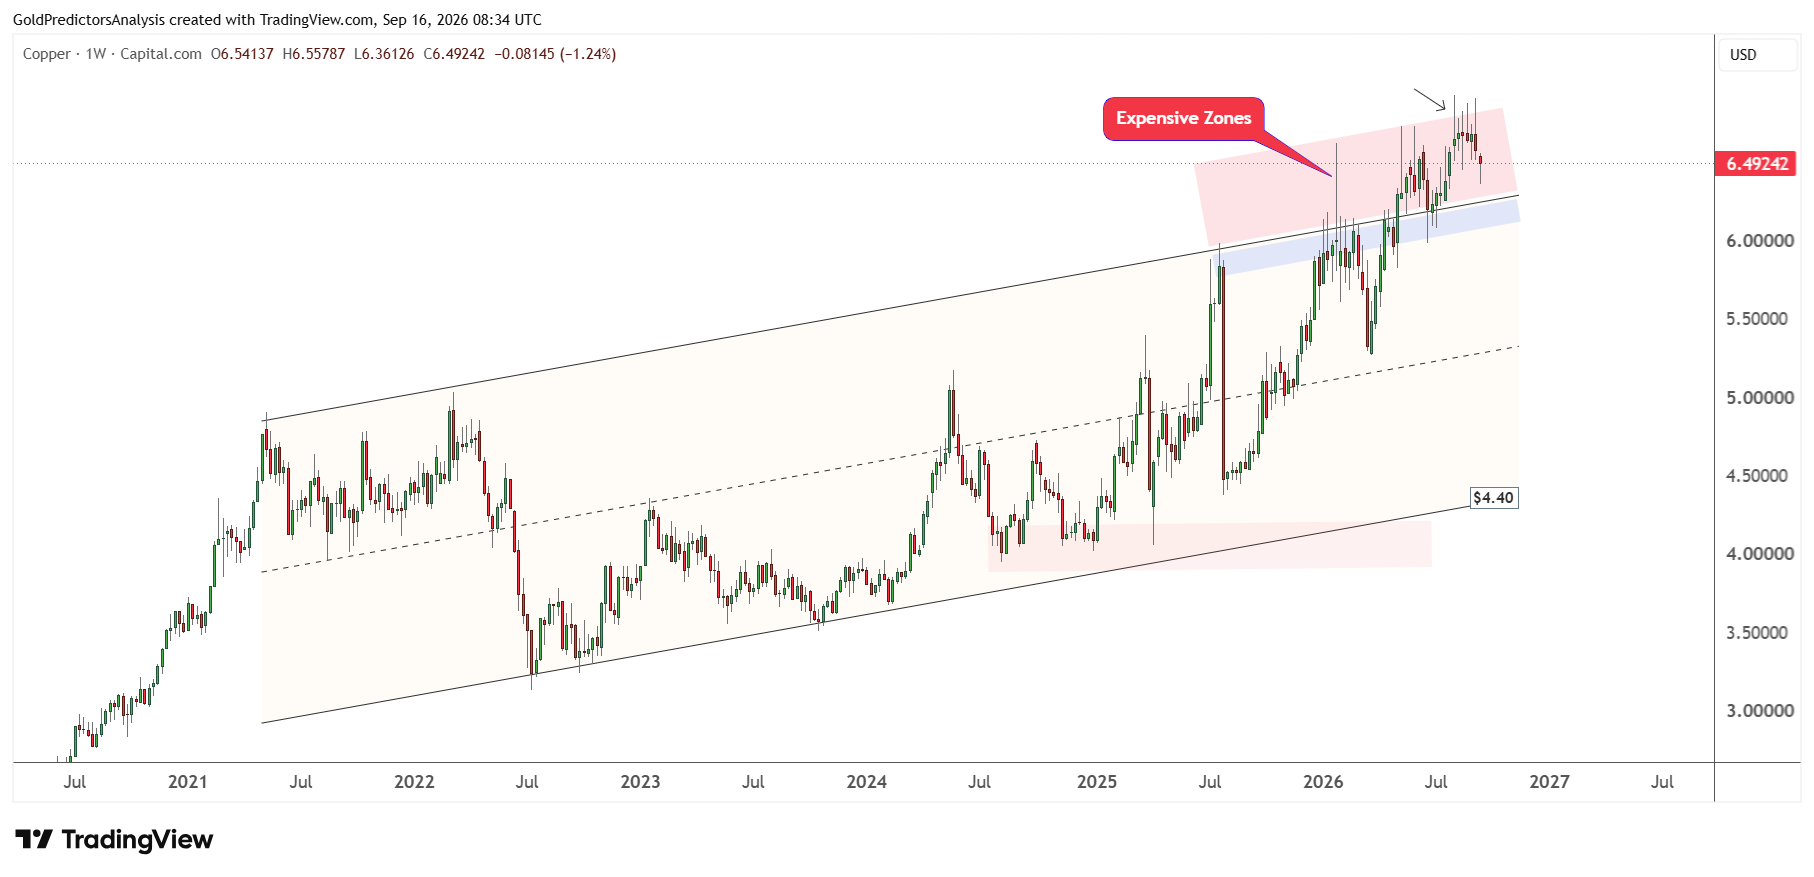
Despite the expensive zones in the copper market, the price structure remains strongly bullish. There is still no sign that the copper market is going to develop a strong drop in the near term. Therefore, a recovery in copper prices above $7 will likely continue the positive trend.
The daily chart for copper also shows consolidation between $6.50 and $6.90 in August and September. But the drop on Monday pushed prices below $6.50. This indicates that price is trying to continue lower. But the strong recovery on Tuesday has already pushed prices back near the $6.50 zone.
A clear break above $6.55 will likely continue higher again in the short term. But a break below $6.30 will likely increase the possibility of another drop toward the $6 level.
Copper vs. U.S. Dollar: Long-Term Bull Market Remains Intact
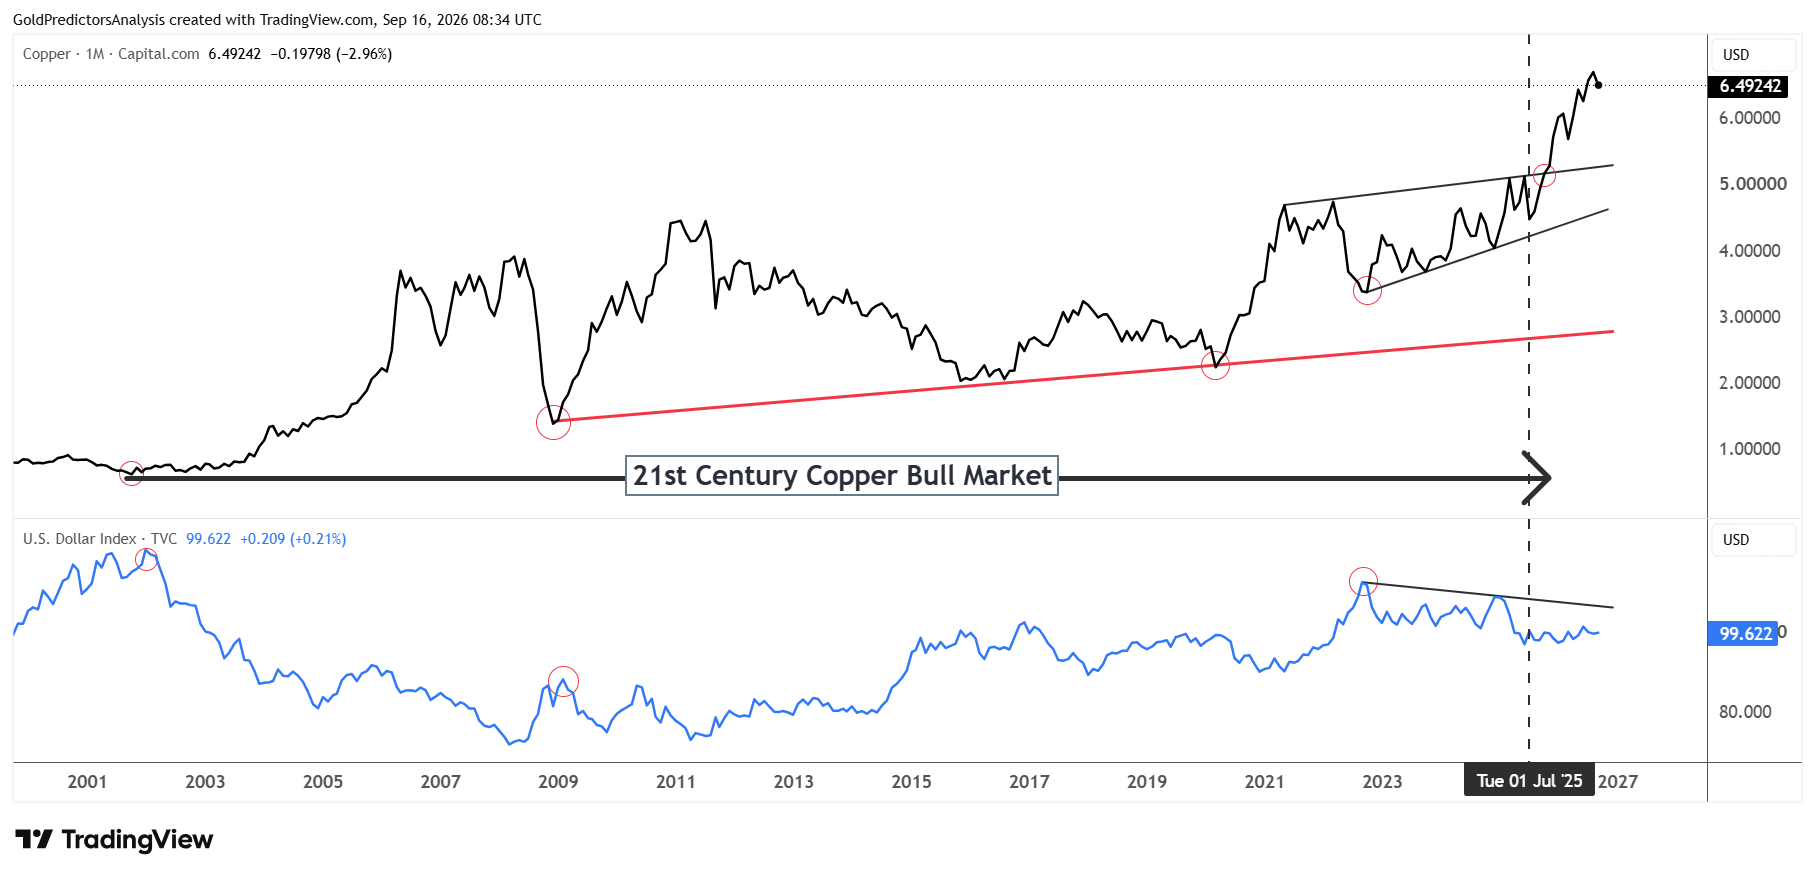
The monthly chart shows that copper has remained in a bull market since the early 2000s. The rising red trendline connects the major lows in 2002, 2009 and 2020. Each major low in copper price formed above the previous one.
Copper also broke above the upper boundary of the rising channel near $5 in 2025. The price now trades around $6.49 and remains above breakout area. This structure keeps the broader outlook bullish despite the volatility in the short term.
The U.S. dollar index also supports the same view. Major dollar peaks in 2002, 2009 and 2022 appeared close to important lows in copper. The dollar now trades near 99.62 and remains below the descending resistance line from the 2022 high.
If the US dollar continues to trade lower in the long term, copper prices will likely remain strong. In my view, copper remains bullish while the price stays above the $5 breakout area. But a strong dollar recovery could slow the rally and trigger deeper correction.
What to Watch Next
Copper faces a mixed outlook in the short term. Strong factory data from China and rising demand from AI and grid investment support the market. But weak property investment, higher LME inventories and strong U.S. dollar may limit further gains in copper prices. Copper also remains below the 50-day SMA near $6.55 while the RSI stays below the midline. Therefore, the price may remain volatile between $6 and $7 until a clear breakout develops.
The broader price structure remains bullish. Copper continues to trade above the important $5 breakout area and the long-term rising trendline. A clear break above $7 would confirm the next move higher. But a break below $6 could trigger deeper correction. In my view, demand from China, LME inventory trends and the direction of the U.S. dollar will guide the next move. But the bull market in the long term remains intact as copper stays above $5.
Read more: Will the Sell-Off Deepen in Copper, Uranium and Lithium?