XRP (XRP) is approaching a technical inflection point, with a short-term breakdown threatening a move toward $1.10 even as a broader bull flag keeps a rally toward $1.97 in play.

XRP Symmetrical Triangle Breakdown Points to $1.10
XRP was trading near $1.29 on Sept. 16, after slipping below the lower trendline of a symmetrical triangle that had formed on its daily chart.
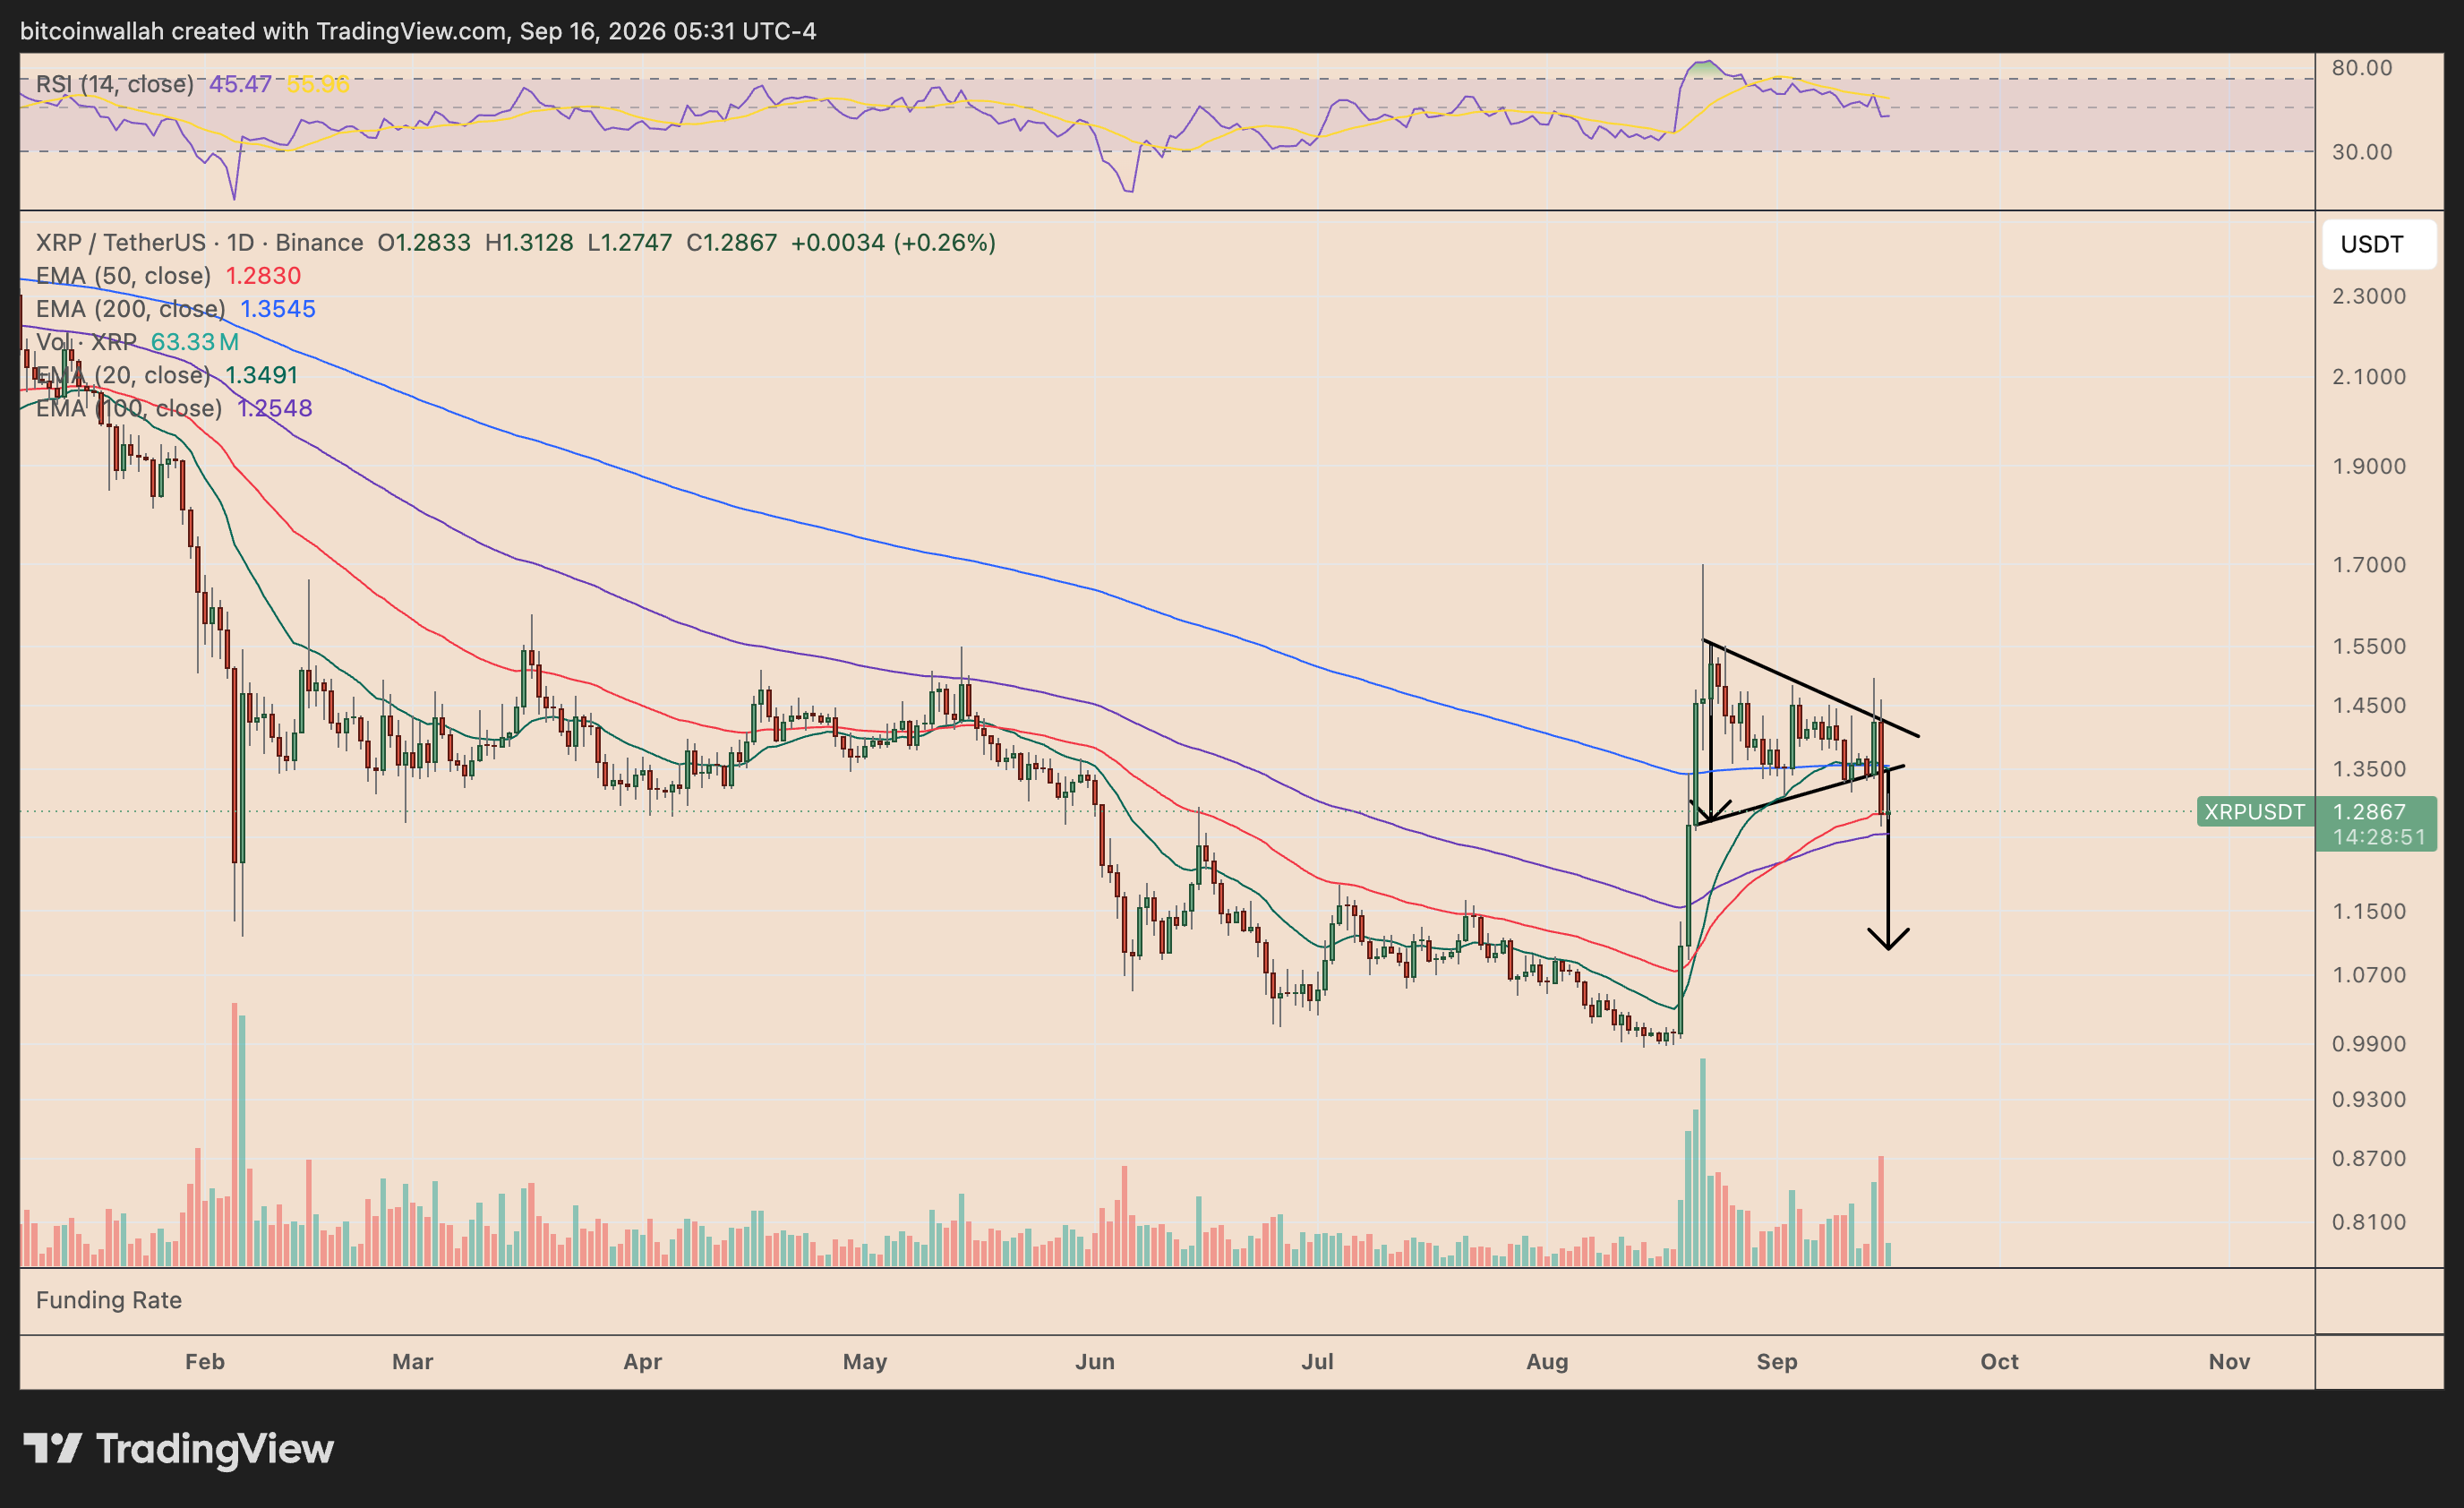
The triangle’s measured downside target sits near $1.10-$1.12, roughly 14% below current prices.
For now, XRP is attempting to hold its 50-day exponential moving average (50-day EMA, the red wave) near $1.28. The 100-day EMA (purple), currently around $1.25, provides another important support level immediately below.
A decisive daily close beneath the $1.25-$1.28 area would strengthen the bearish setup and increase the probability of XRP extending its decline toward $1.10.
XRP’s daily relative strength index (RSI) has fallen toward 45, dropping below the neutral 50 level and signaling fading buying pressure.
Ripple Price Forecast
Every new Ripple analysis as it publishes, today's technical signal and key levels, live price — on one page.
See all Ripple forecastsXRP Bull Flag Keeps $1.97 Rally Scenario Alive
Zooming out slightly, XRP’s price action since August can also resemble a bull flag, a bullish continuation pattern that typically develops after a sharp advance.
XRP initially rallied from roughly $1.00 to $1.55, establishing the flagpole. It has since moved lower inside a descending consolidation structure, forming what could become the flag portion of the setup.
For the pattern to confirm, XRP would need to reverse higher and decisively break above the flag’s upper trendline around $1.38-$1.40.
Such a breakout could put the pattern’s measured target near $1.97 in focus, representing more than a 50% advance from current levels.
XRP would first have to reclaim the cluster of resistance around its 20-day and 200-day EMAs near $1.35, followed by the August swing high around $1.55.
That leaves the $1.25-$1.28 area as the immediate technical battleground. Holding it could preserve the bull flag scenario, while a confirmed breakdown would favor the bearish triangle target near $1.10.