Bullish Structure Survives Wednesday Selling
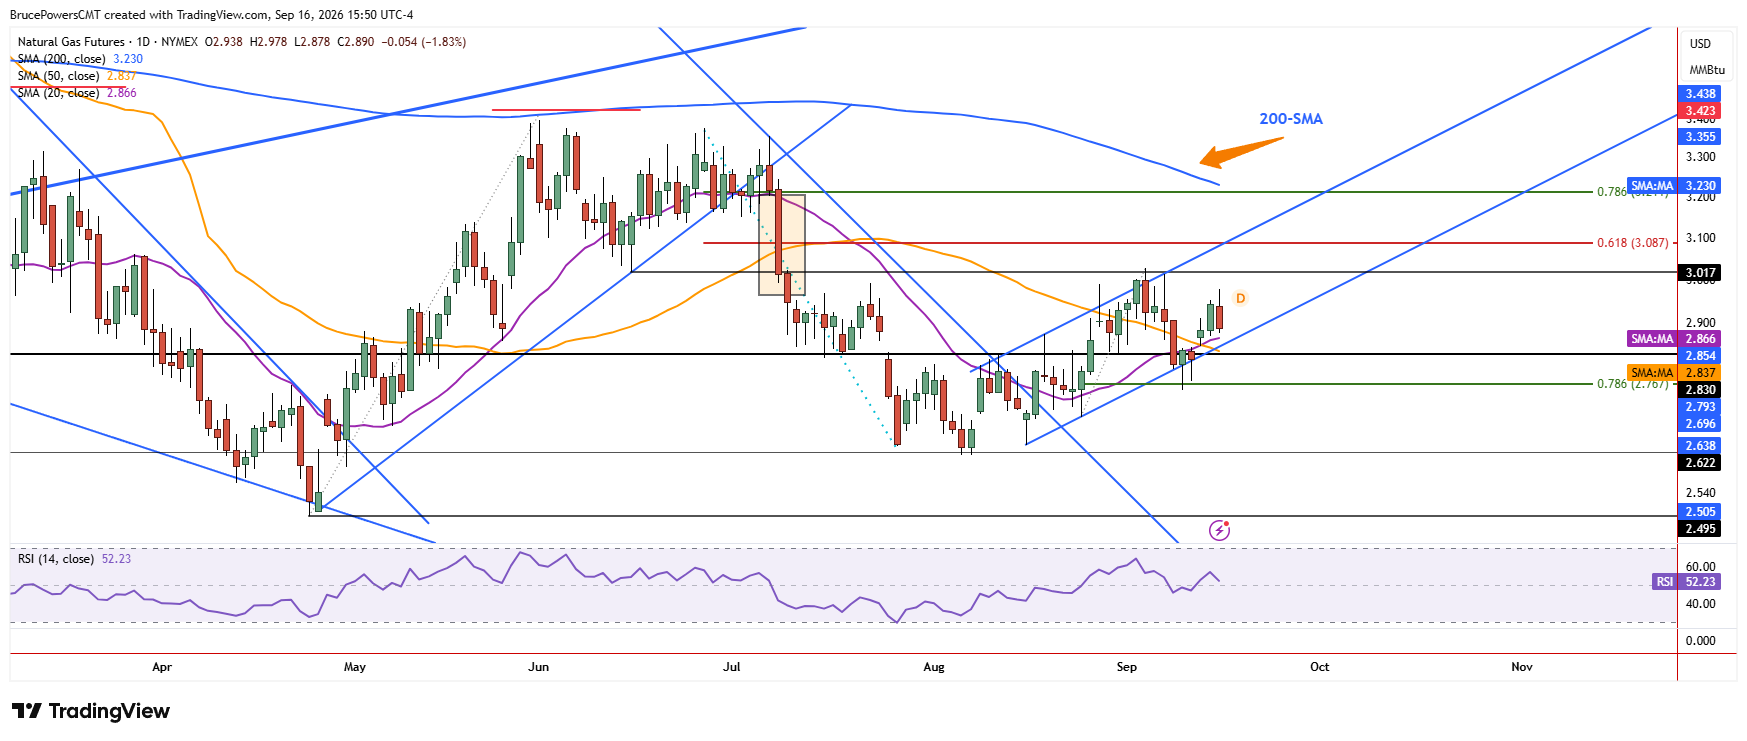
Natural gas rose to a six-day high of $2.98 on Wednesday and generated a slightly higher daily low of $2.88. However, sellers regained control after the advance and drove price lower, currently trading near the lows of the day. Although this is short-term bearish behavior, the developing uptrend structure is retained, and it remains bullish.
This is the third consecutive day that confirmed support above both the 20-day and 50-day moving averages, since they were reclaimed on Monday. That is a sign of strength, which was reinforced by the 20-day moving average recently crossing above the 50-day average, indicating improving short-term momentum.

WTI and Brent Forecast: Oil Pulls Back as Supply Fears Ease
Forecasts · Brent Oil · 2 min readHigher Low Defines Key Structure
The developing bullish trend is anticipated to continue unless there are clear signs of weakening a failure to hold key support levels. There has been only one advance from the bottom in August, and a second advance is possible since two swings in the same direction is common in markets. Key structure support is the recent higher swing low of $2.75, which completed a 78.6% Fibonacci retracement of the prior advance.
Given that new swing low the rising channel lines have not been adjusted on the chart, but they are only a guide. Key short-term dynamic support should be found either near the 20-day moving average at $2.87 or the 50-day moving average near $2.84. Since the 20-day moving average has been tested as support this week, the market has identified it as key dynamic support for the short-term rising trend.
Natural Gas Price Forecast
Every new Natural Gas analysis as it publishes, today's technical signal and key levels, live price — on one page.
See all Natural Gas forecasts$3.03 Marks Next Major Test
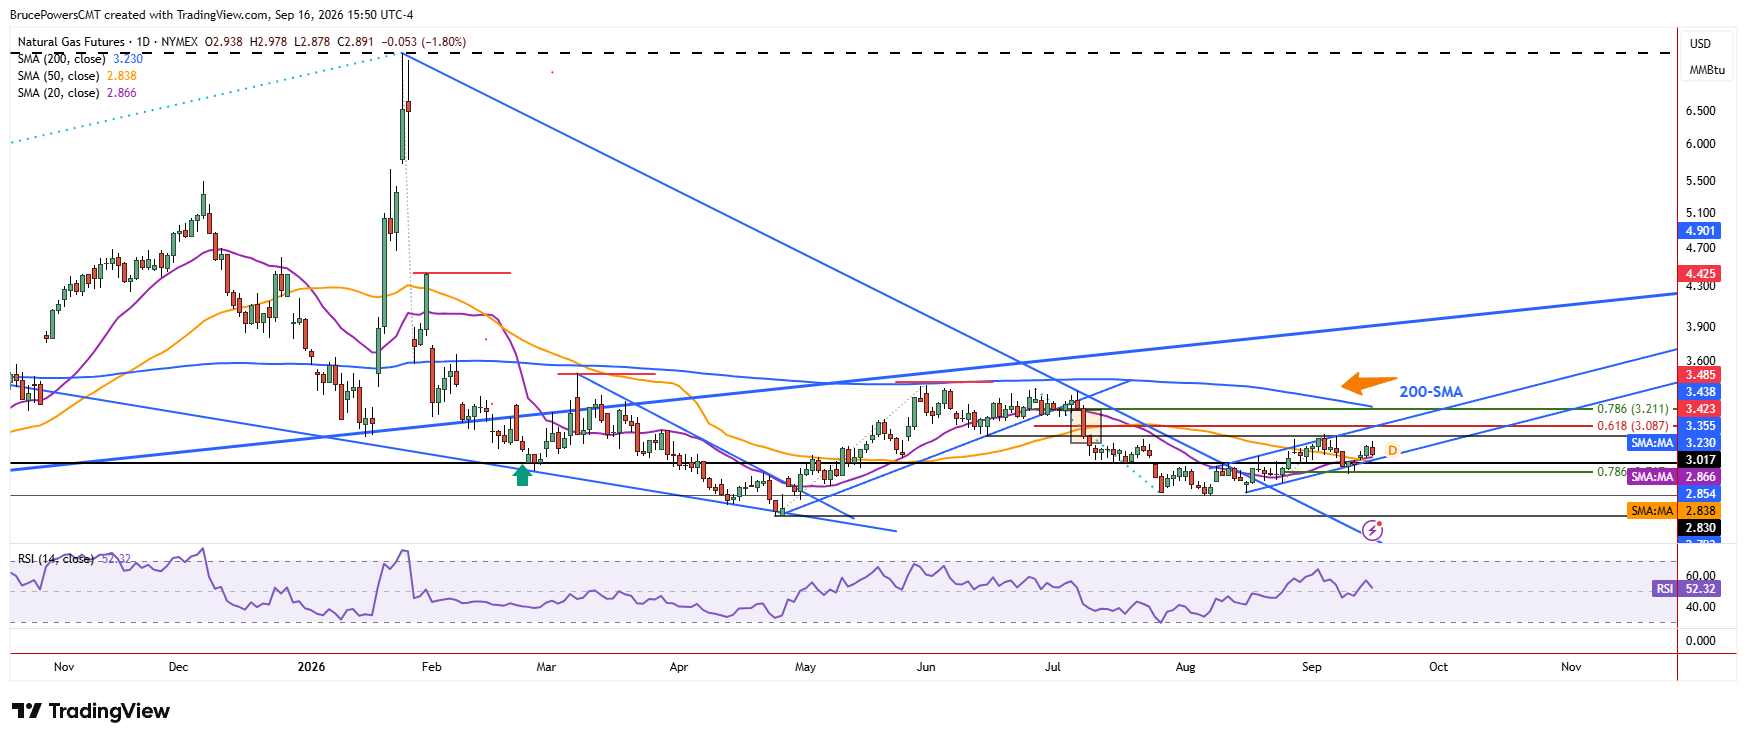
An initial upside target is the recent high of $3.03. On the weekly chart, resistance near that high is reinforced by the 20-week moving average near $2.96 and the 200-week moving average near $3.03. The longer timeframe is more significant, and it is rapidly falling toward the recent high. That would strengthen the significance of that indicator as a key pivot, for either resistance or a rally back above that average and a bullish signal.
If you’d like to know more about how to trade natural gas, please visit our educational area.