



USOIL, UKOil & Natural Gas Outlook: Saudi Rerouting Eases Supply Fears as Hormuz Traffic Collapses
Saudi Arabia has identified alternate routes for some of its Oil shipments to alleviate the impact of the damaged East-West Pipeline, which resulted in a significant disruption to the Kingdom’s crude oil exports. As such, the Oil market has shifted to more of a balanced position, from the tight market conditions that had prevailed earlier in the week.
The East-West Pipeline carries crude oil from the oil fields of the Eastern Province to the Red Sea port of Yanbu. Due to the restriction of the flow of crude oil through the Strait of Hormuz by Iran, Saudi Arabia used the Port of Yanbu for export of its crude oil.
As reported by Kpler, on Wednesday (6/26) only three (3) vessels transited through the Strait of Hormuz, compared to (12) the day before. On average, about 17 vessels transited the Strait of Hormuz over the last 10 days.
Saudi Arabia and the U.S. have ramped up their military operations against the Houthi rebels in Yemen. Saudi airstrikes and the Houthi drones and missile attacks increased. Consequently, the increase in tension, and the strained relations between the countries along the Bab el-Mandeb Strait negatively impacted oil shipments in the region.
Executives are saying that the market is becoming less able to tolerate disruption. Around February, the Middle East conflict began removing crude and condensates from the market. As of now, that number is estimated to be around 1.6 billion barrels. Initially, disruption to the market was cushioned. Now, those disruption countermeasures are largely uneffective.
For natural gas, the largest fundamental shift is the decline in LNG. The loss of Qatari LNG has been estimated to be around 36 million tons. Cheaper LNG is allowing broader market disruption, allowing LNG to flow from the Middle East to Europe. This is especially troubling because Europe typically fills its gas storage facilities in preparation for the winter.
In general, the current fundamental outlook is moderately bullish for crude oil, moderately bullish for natural gas, and moderately bullish for natural gas liquids.

Natural Gas Technical Analysis: NG Holds Rising Channel as $2.95 Resistance Caps the Recovery
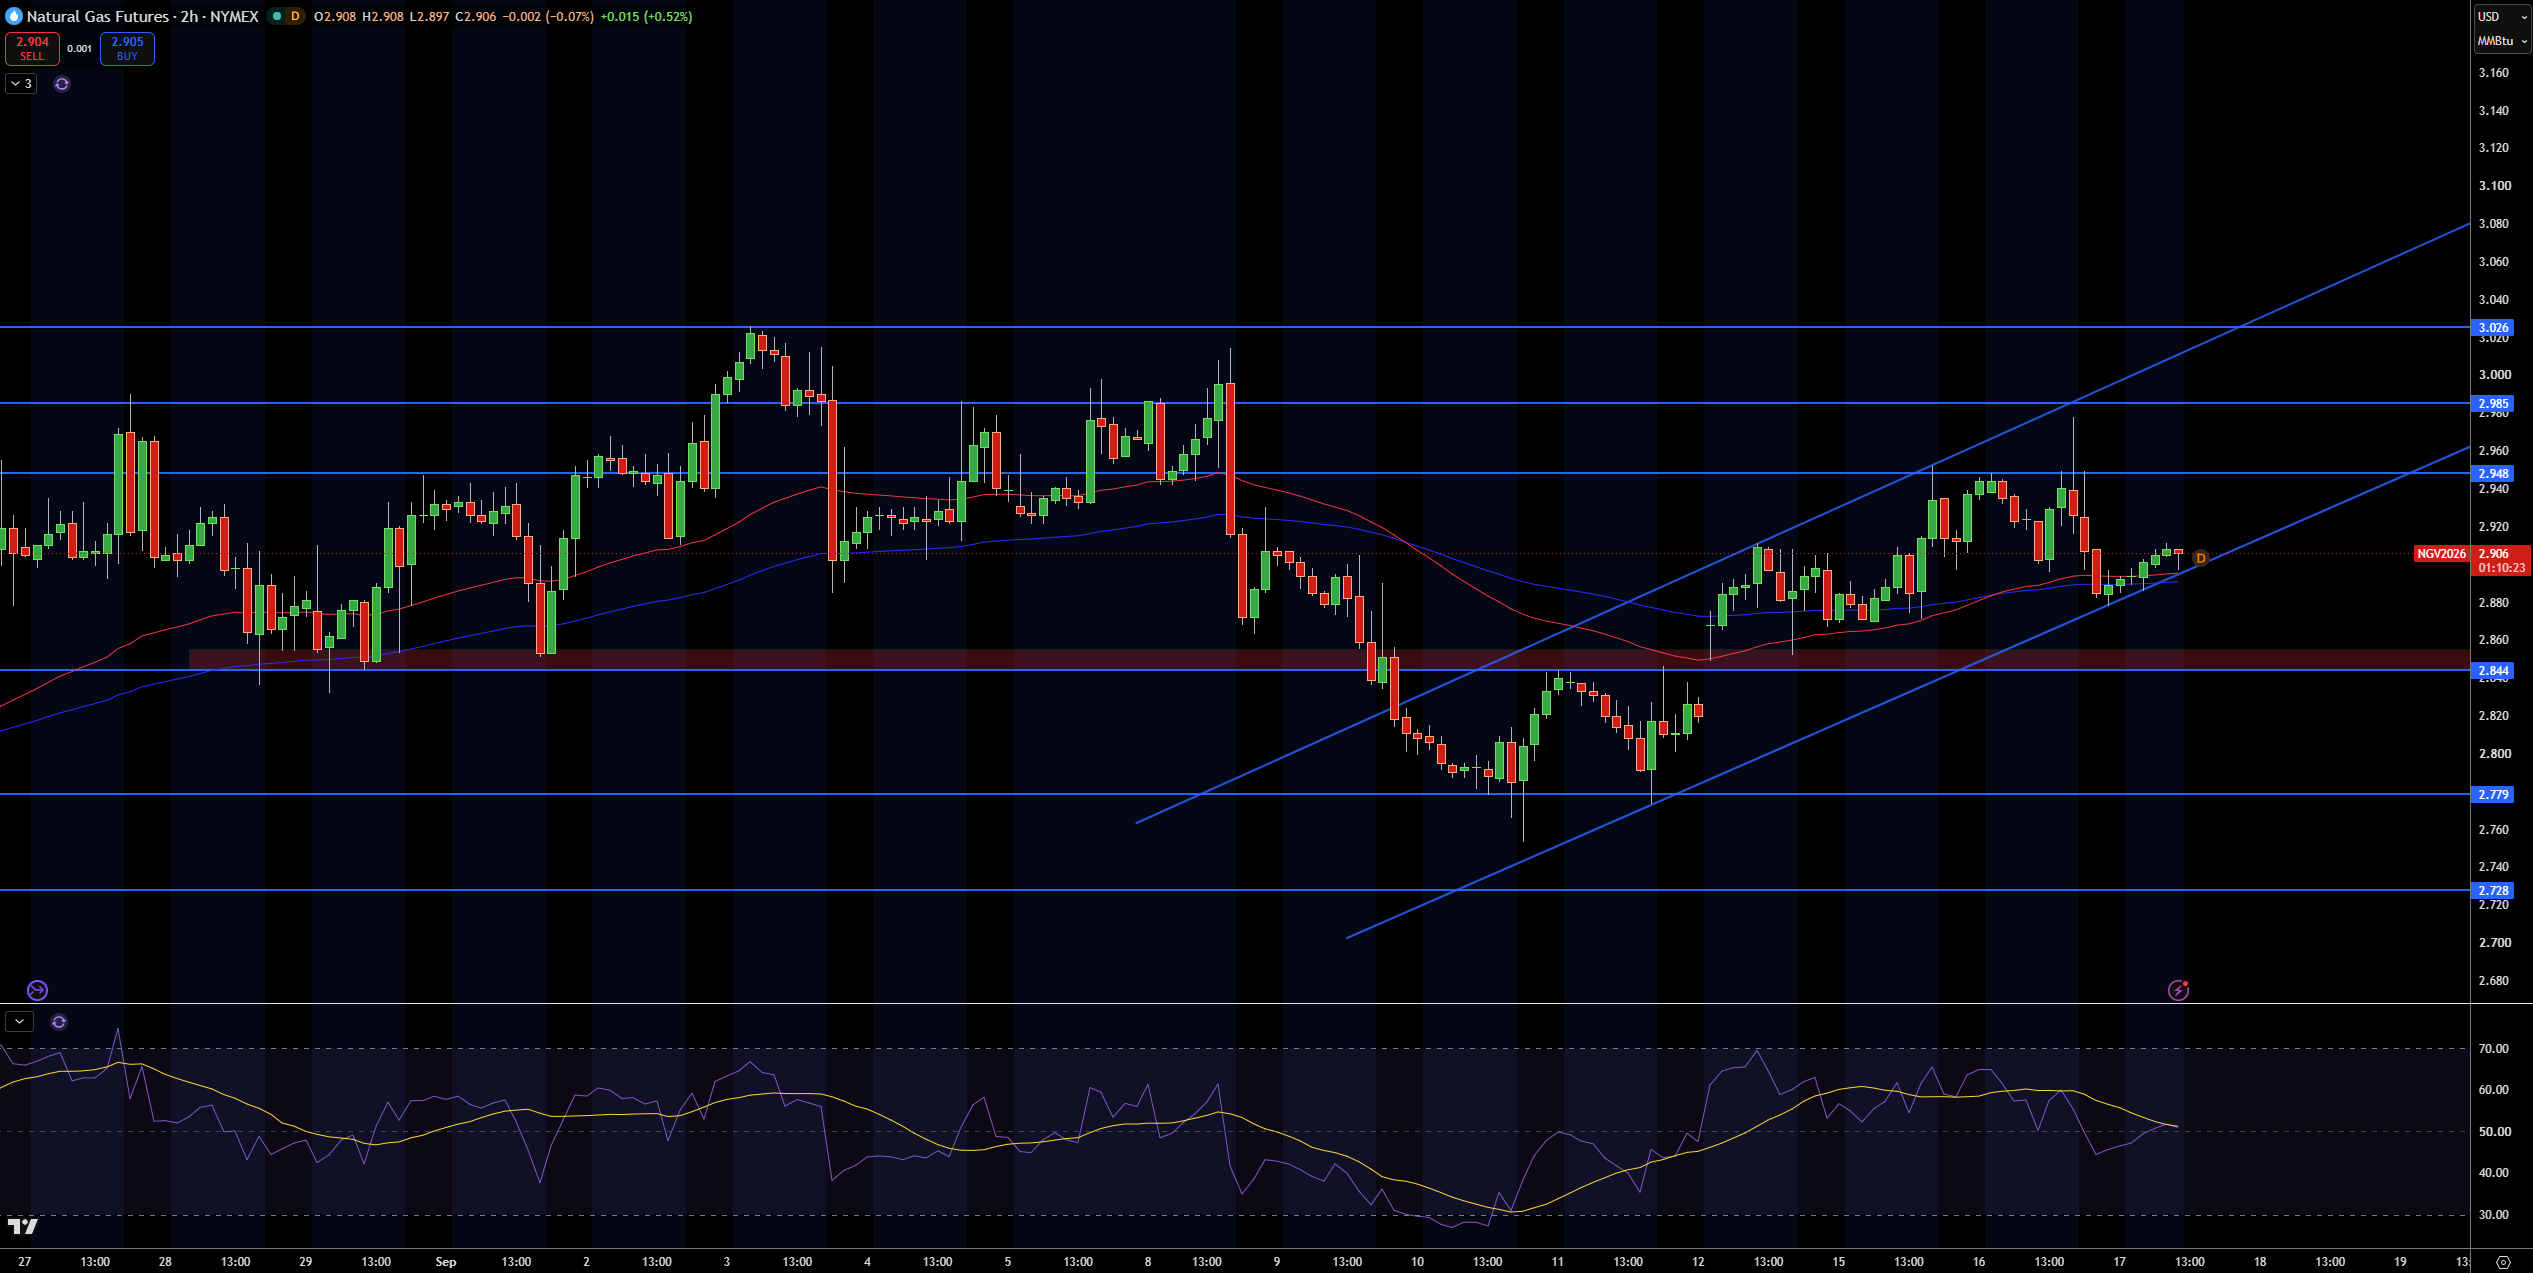
Natural gas is trading at approximately $2.91 and continues to trade within the rising channel, offering strong support at $2.84, as it recovers from recent market lows. The $2.95 area continues to act as an area of resistance and until that level is cleared, the recovery will be considered in progress but not fully complete.
The area of resistance at $2.95 would need to be tested to determine if additional resistance is located above that level at $2.99 and $3.03. Support is located at the lower boundaries of the rising channel at $2.84, with additional support located at $2.78 and $2.73.
Momentum, as denoted by the RSI, is neutral at this time and would need to trade outside of its current range to give further directional clues. I will maintain a neutral bias with a slight positive bias as long as $2.84 and the rising channel are not violated to the downside. If the $2.95 area is cleared to the upside, I would become more constructive as to the likely path of least resistance.
Natural Gas Price Forecast
Every new Natural Gas analysis as it publishes, today's technical signal and key levels, live price — on one page.
See all Natural Gas forecastsWTI Crude Oil Technical Analysis: USOIL Breaks Rising Trendline as $101.00 Support Comes Under Pressure
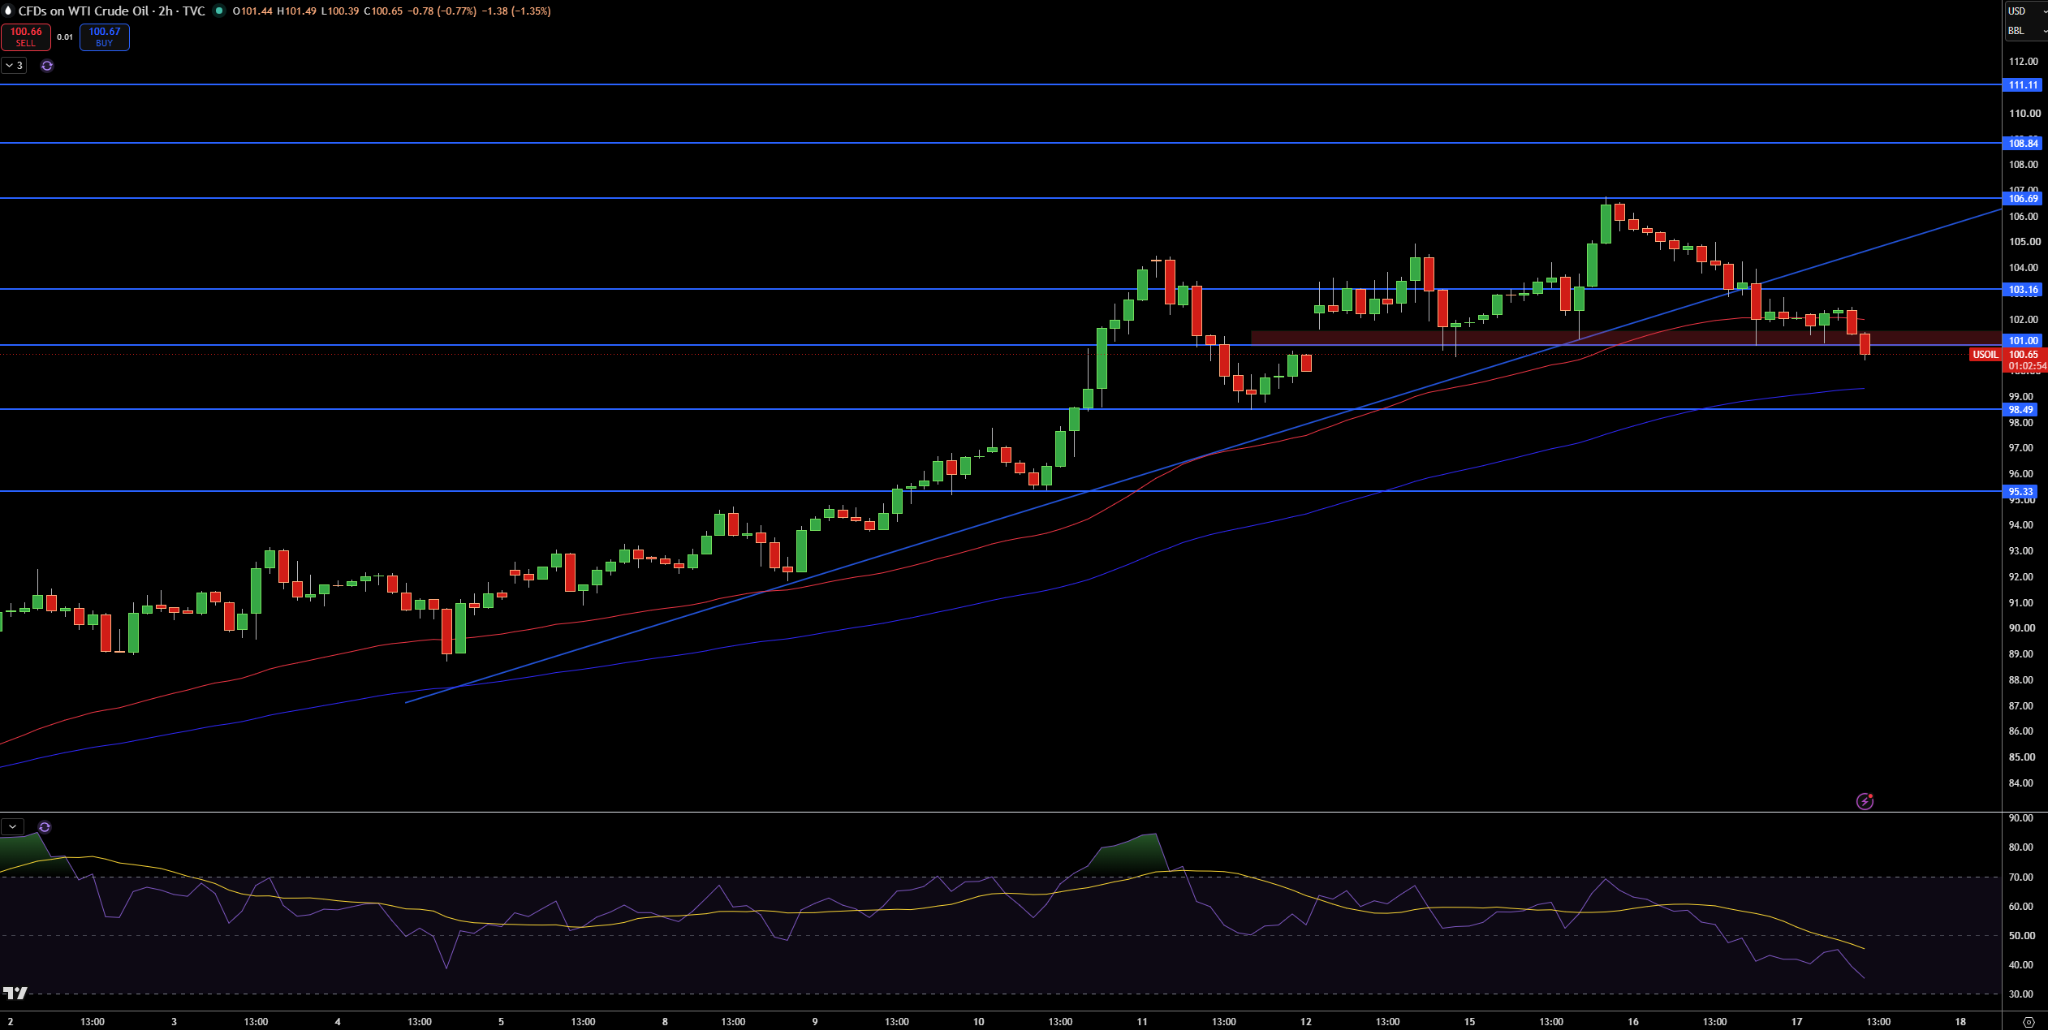
USOIL is currently trading at about $100.65. I see that the price has broken below a rising trendline and is also currently trading below the $101.00 support level. Additionally, the recent highs of $106.69 have also been falling, which indicates that the overall bullish trend may be diminishing.
The next area of support lies between $98.49 and $95.33. The $101.00 level should now act as a resistance level. Higher bullish momentum may bring the $103.16 and $106.69 levels into play.
A bearish bias may be appropriate as long as the price of USOIL is trading below the $101.00 and $103.16 levels. A break above $103.16 may negate the bearish bias. If the price of USOIL breaks below the $98.49 level, a fall to the $95.33 level may be appropriate.
Brent Crude Oil Technical Analysis: UKOIL Loses $105.94 as $103.52 Support Becomes Critical
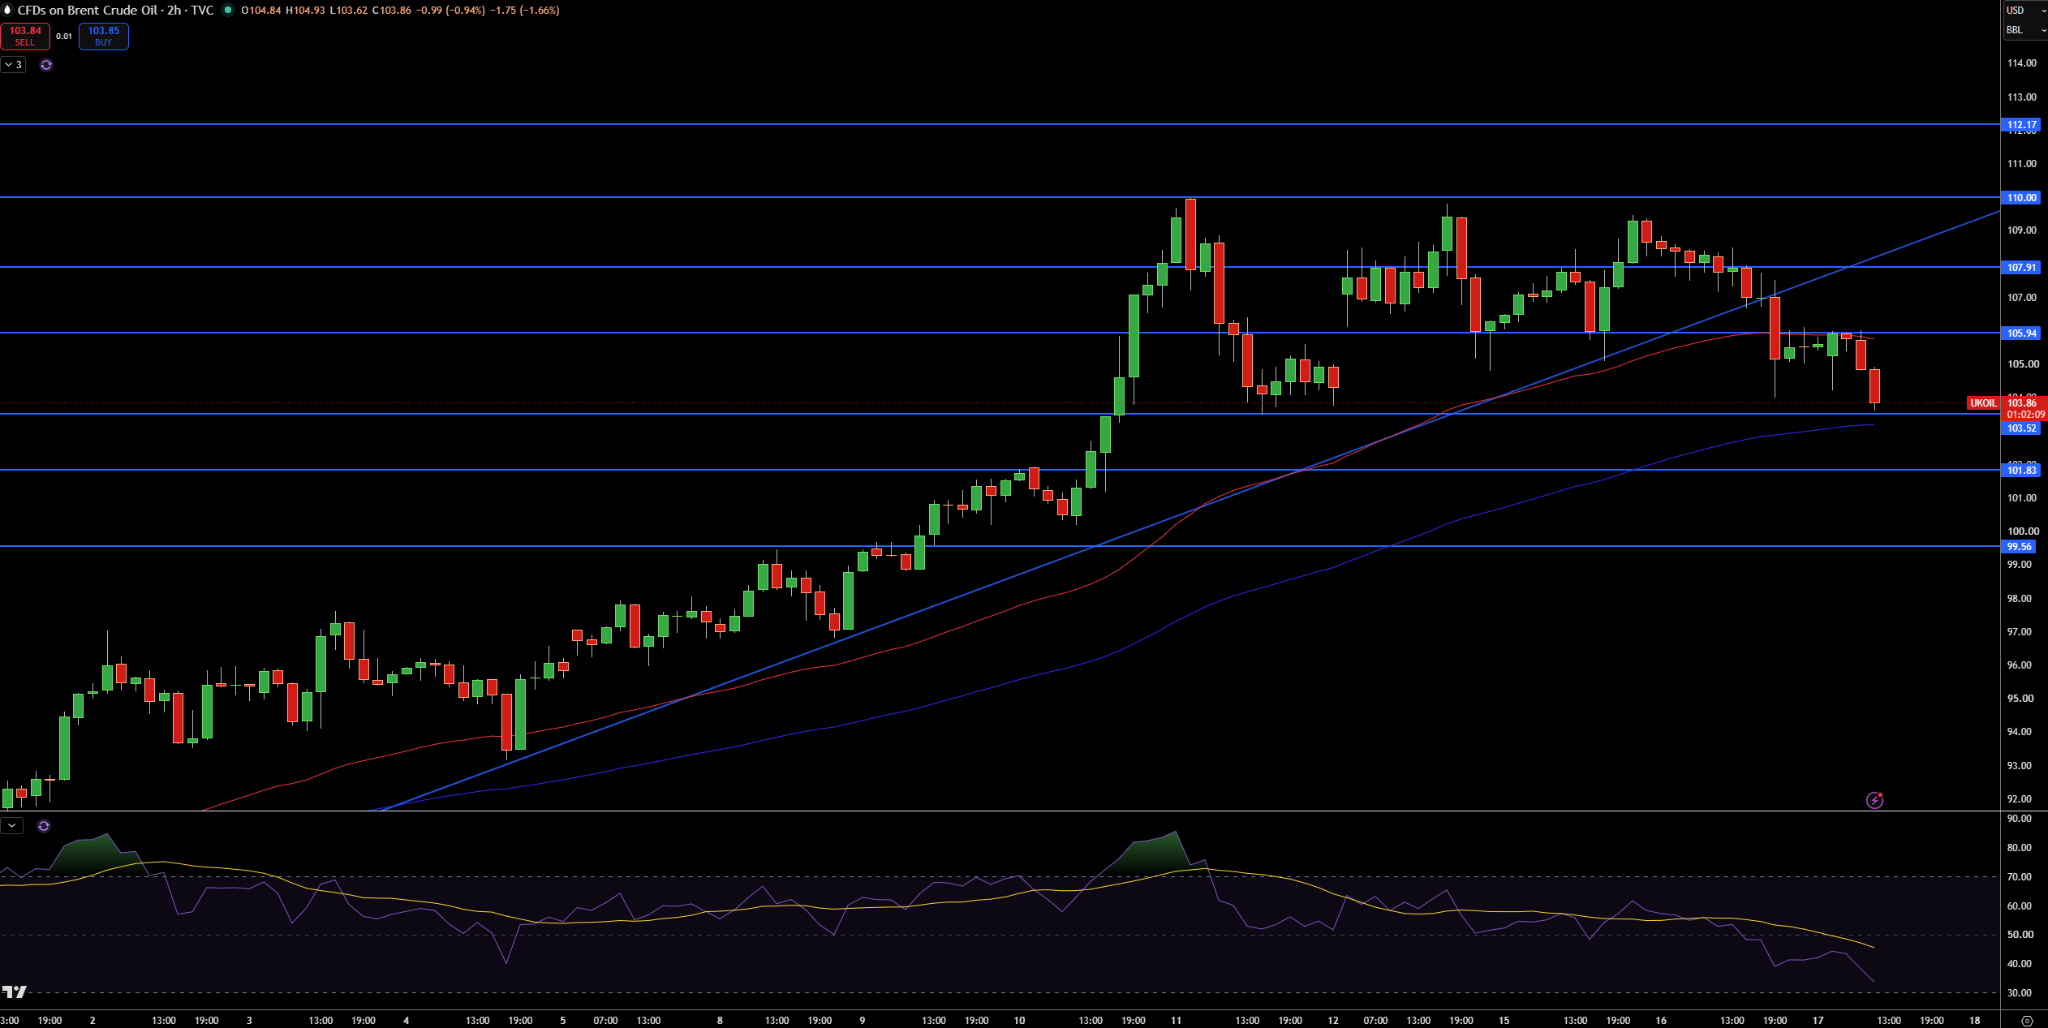
Brent crude is currently trading at $103.86, and is likely headed lower after failing to hold the $105.94 support level and trendline. Also concerning, is the fact that the price has also fallen below the 200 EMA, which in the past has provided some support.
The first major support is at $103.52. If that level is taken out, then support at $101.83 and $99.56 would be exposed. On the upside, resistance is initially at $105.94, and is followed by $107.91 and $110.00.
The RSI has also moved into oversold territory, so a bounce may be in the cards in the near term. As long as Brent crude stays below the $105.94 level, I would maintain a bearish bias. The $107.91 level would negate this outlook, and as long as the rising trendline maintains support, I would expect a test of $103.52 before further losses.


