



Oil prices extended their decline on Thursday as fears of an immediate shortage of supply eased. Brent crude dropped toward $104.60 while WTI oil slipped near $101.30. Saudi Arabia offered more crude to Asian refiners through ship-to-ship transfers near Oman.
This reduced some concerns about the suspension of loadings at the Yanbu export hub. But the timeline to repair the damaged East-West pipeline remains unclear. Fighting in the region also continues. Therefore, the Middle East risk premium has eased but it has not disappeared.
U.S. inventory data also added further pressure on prices. Crude stocks dropped by only 640,000 barrels last week compared with expectations for the decline of 1.62 million barrels. The smaller draw suggests that the domestic supply is not tightening as quickly as expected. It also encouraged profit taking after the oil price reached near the $110 level earlier this week.
In my view, the alternative export route for Saudi Arabia may limit gains in oil prices in the short term. But fresh attacks or prolonged disruption at Yanbu could quickly push oil prices higher again.

WTI Oil Price Forecast: $97 Support Keeps Bullish Outlook Intact
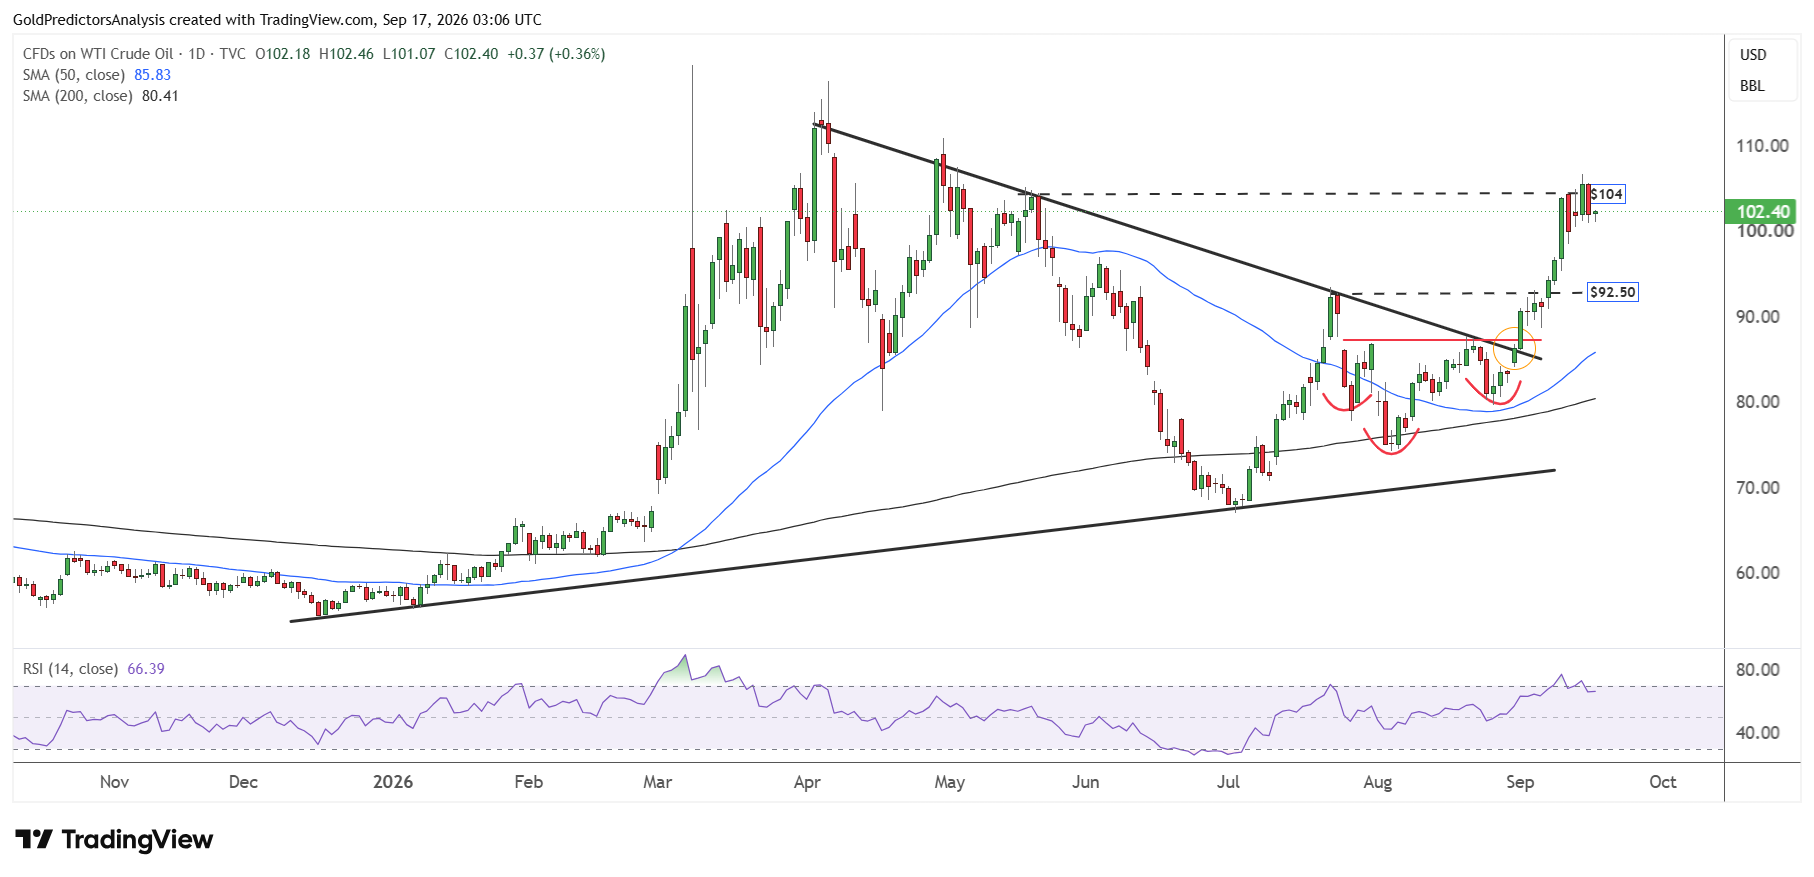
The daily chart for WTI crude oil shows that the price hit strong resistance in the $104 area and reversed lower on Wednesday. Despite this reversal, the overall price structure remains bullish in the short term. The price remains above the 50- and 200-day SMAs and both SMAs are rising. But the RSI has reached overbought levels, which calls for a correction in the short term.
The immediate support for WTI oil remains at $97. A break below $97 will push the price toward the $92.50 area. On the other hand, a confirmed break above $105 will push WTI oil to $110.
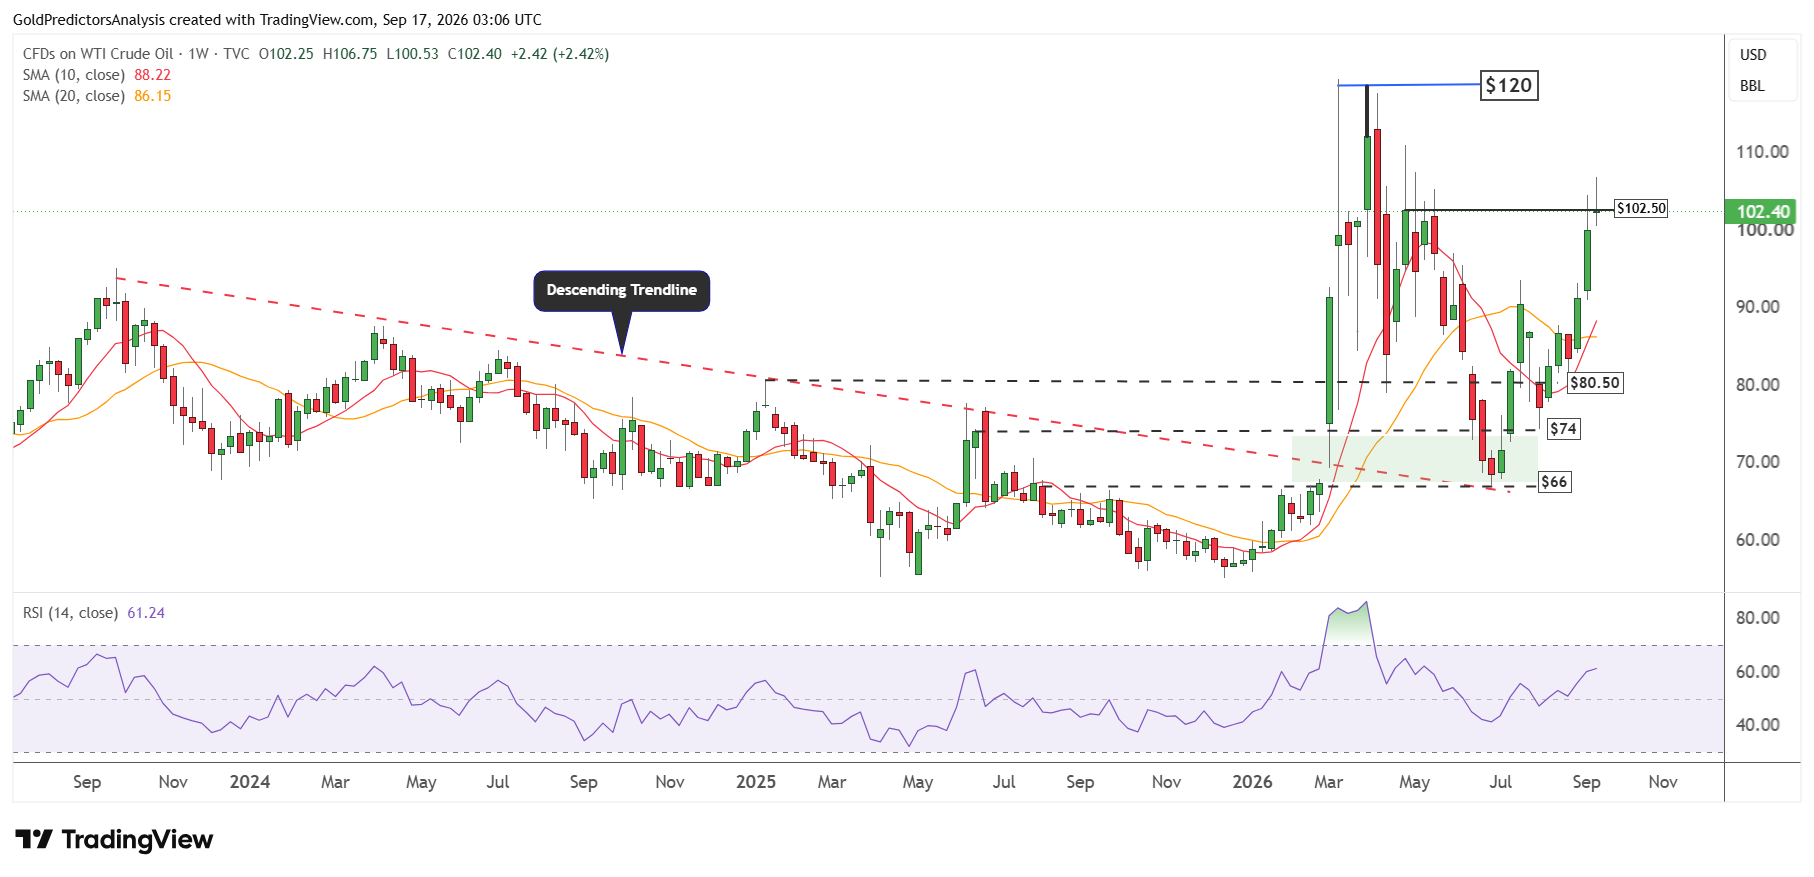
The weekly chart for WTI oil also shows constructive price action in the short term. The price shows strong volatility while the moving averages support positive moves over the next few weeks.
The RSI on the weekly chart also remains above the midline, which supports positive outlook in the short term. The significant resistance for WTI oil remains $120. A break above $120 will likely continue the positive moves in WTI.
The 4-hour chart for WTI oil also highlights the importance of $104. A break above $104 will likely push prices to the $110 region.
Brent Oil Price Forecast
Every new Brent Oil analysis as it publishes, today's technical signal and key levels, live price — on one page.
See all Brent Oil forecasts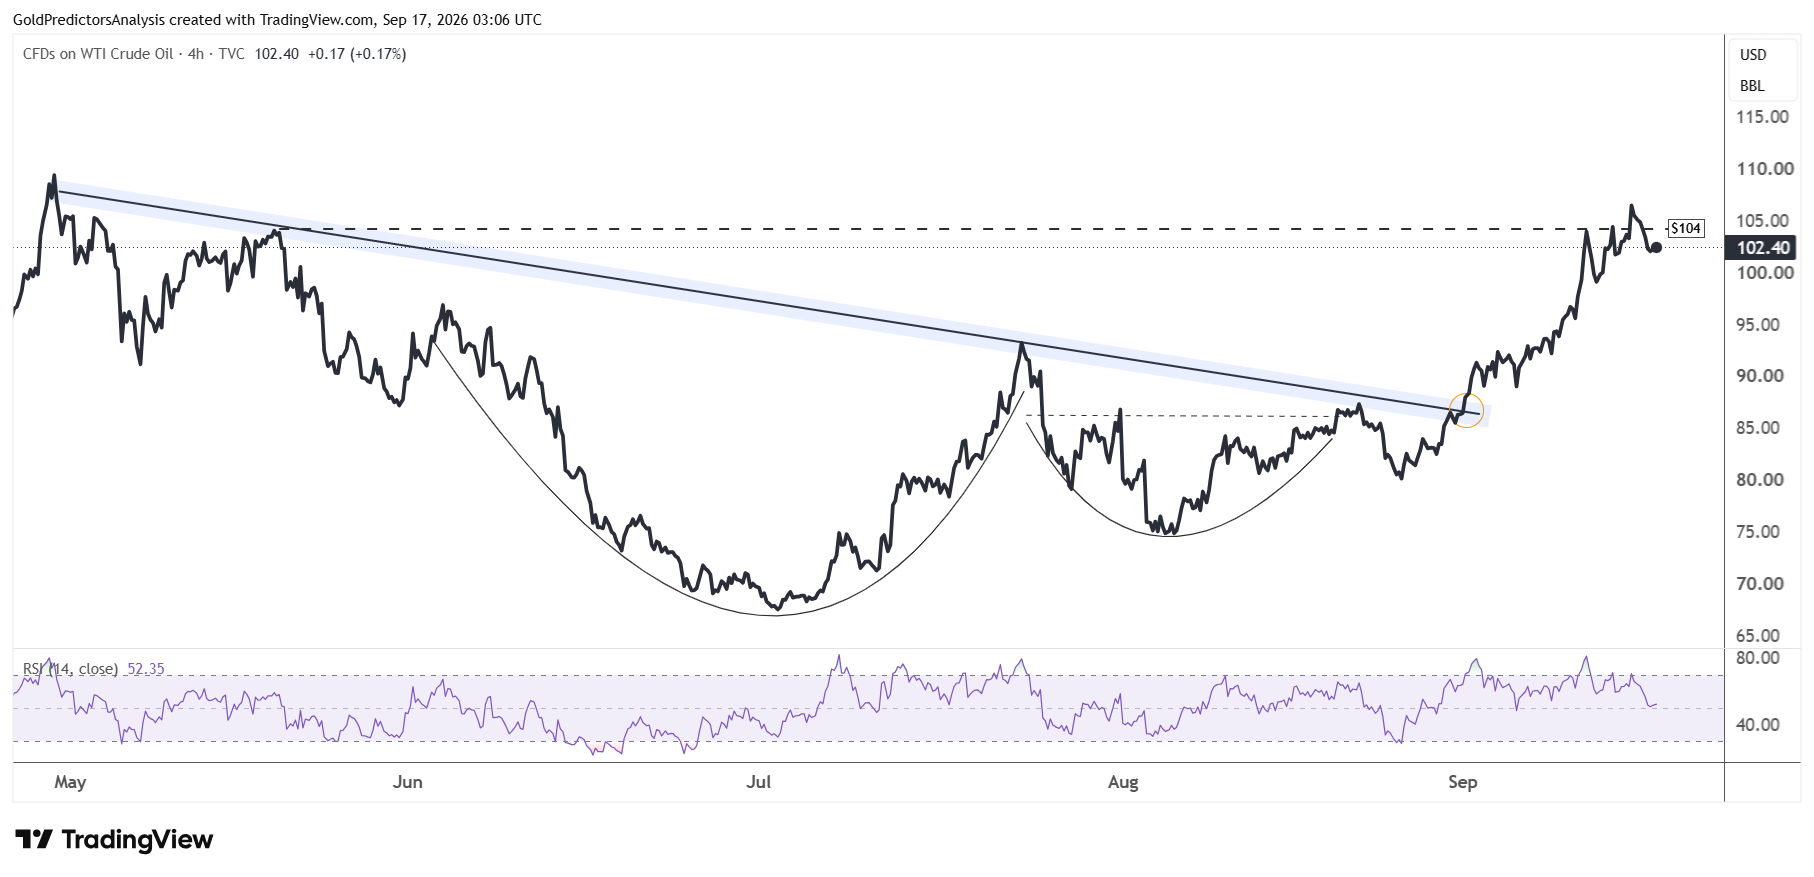
Brent Oil Price Forecast: $113 Resistance Remains the Key
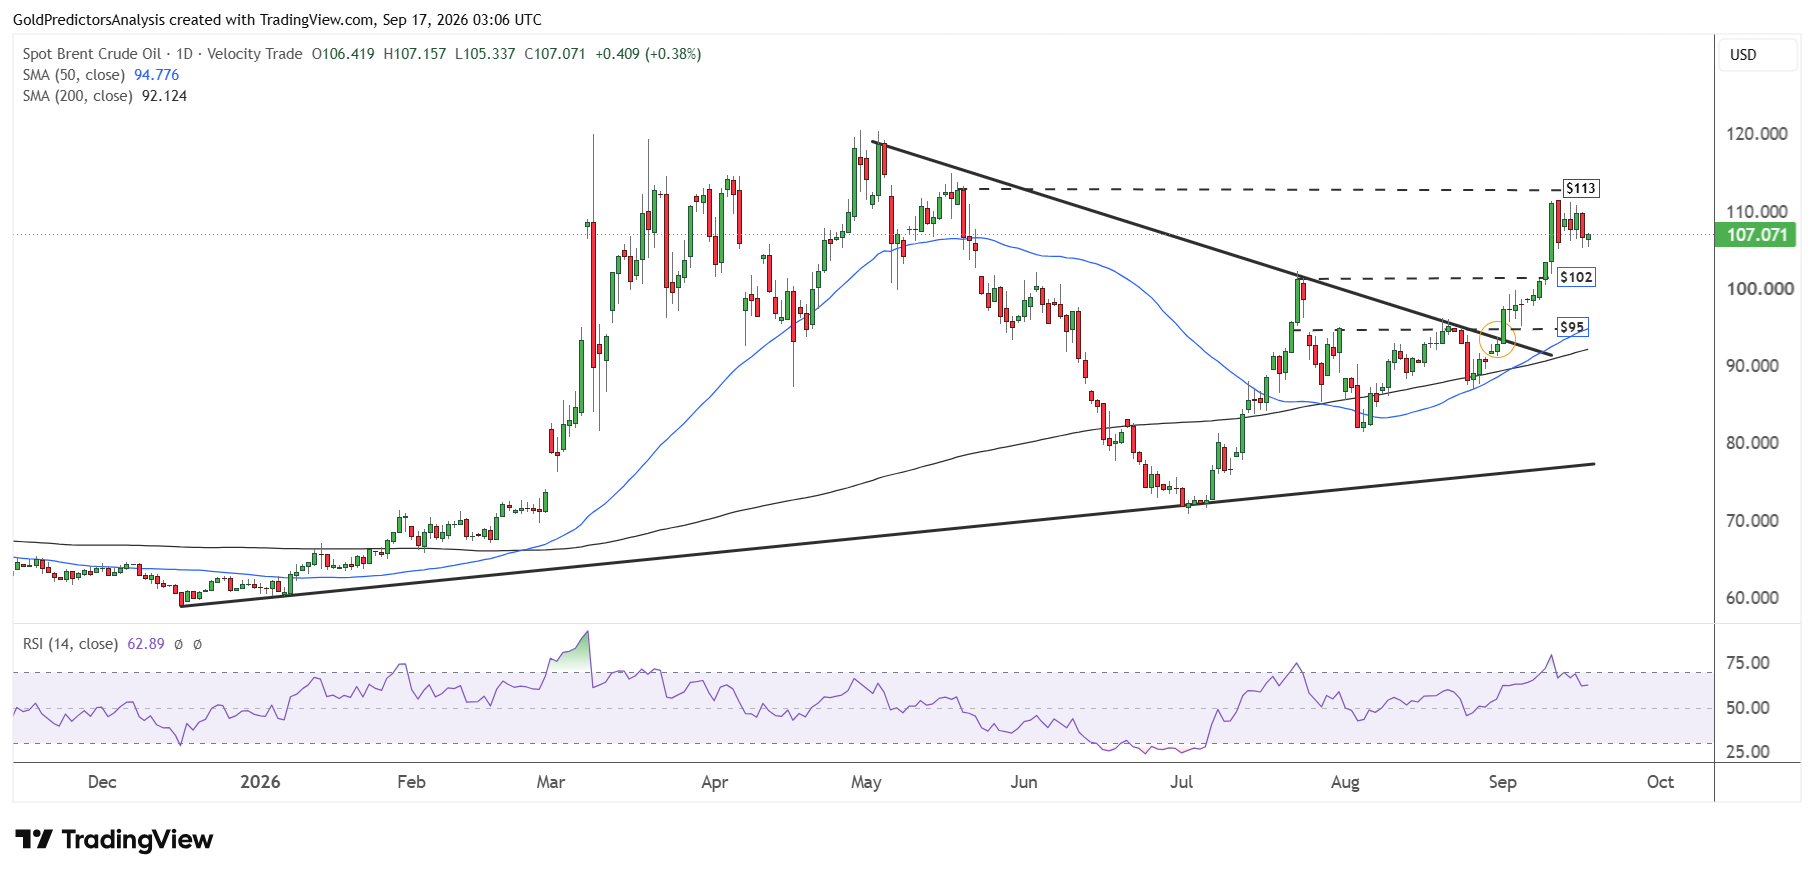
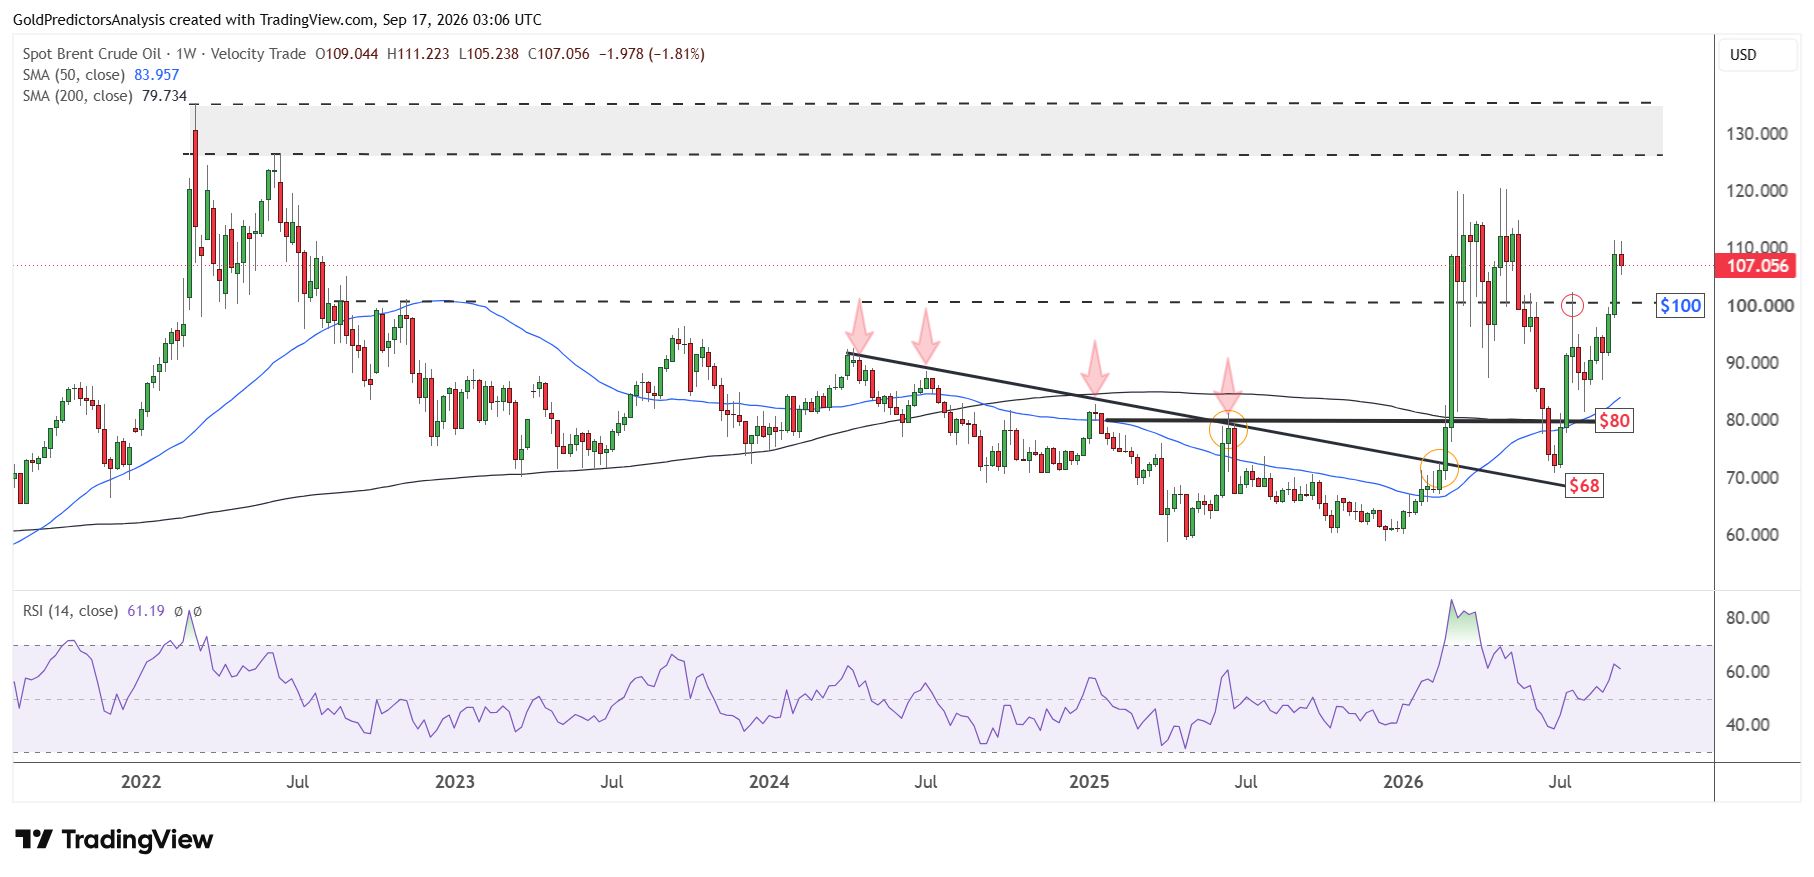
The daily chart for Brent crude oil also shows the importance of the current resistance in the $113 area. This resistance is defined by the May 2026 highs. The price already broke the triangle pattern in September 2026, which suggests a positive outlook.
The immediate support remains at $102. A break below $102 will push the price toward $95. On the other hand, a break above $113 will likely indicate strong move toward the $120 region.
The weekly chart for Brent crude oil also shows a positive price structure and suggests strong rally toward the $120 area. A break above $120 will likely push the price toward the $130-$135 region.
Bottom Line
Oil prices remain volatile as easing fears of supply shortages compete with the ongoing risks in the Middle East. Saudi exports through Oman and the smaller than expected decline in U.S. inventories may limit gains in the short term. But the technical outlook remains positive as WTI stays above $97 and Brent holds above $102. A break above $105 in WTI and $113 in Brent could open the way toward $110 and $120, respectively. But a break below these key support levels would increase the risk of deeper correction.
Read more: Saudi Pipeline Outage Puts $120 Oil in Focus


