



Gold (XAU) rebounds after the PCE data, but high Treasury yields and a strong US dollar continue to limit the recovery. The spending and growth give the Fed less reason to lower rates and mixed labor data put the next jobs report in focus. The ratio analysis for gold suggests that the gold price remains in a bull market in the long term despite the weakness in the short term. In my view, the correction in Treasury yields and US dollar would support the recovery in gold. This article presents the key economic drivers, signals from the ratio and key levels to understand the next move in gold.
Gold Fundamentals: High Yields Limit Relief From Softer PCE
PCE Inflation Offers Limited Relief for Gold
The latest PCE data shows that the headline inflation increased 0.3% in August and 3.42% from a year earlier. The core inflation increased 0.2% monthly and 3% annually. Both annual rates matched the revised July readings. The annual update by BEA lowered earlier estimates so the softer figures should not be read as a sudden drop in inflation during August.
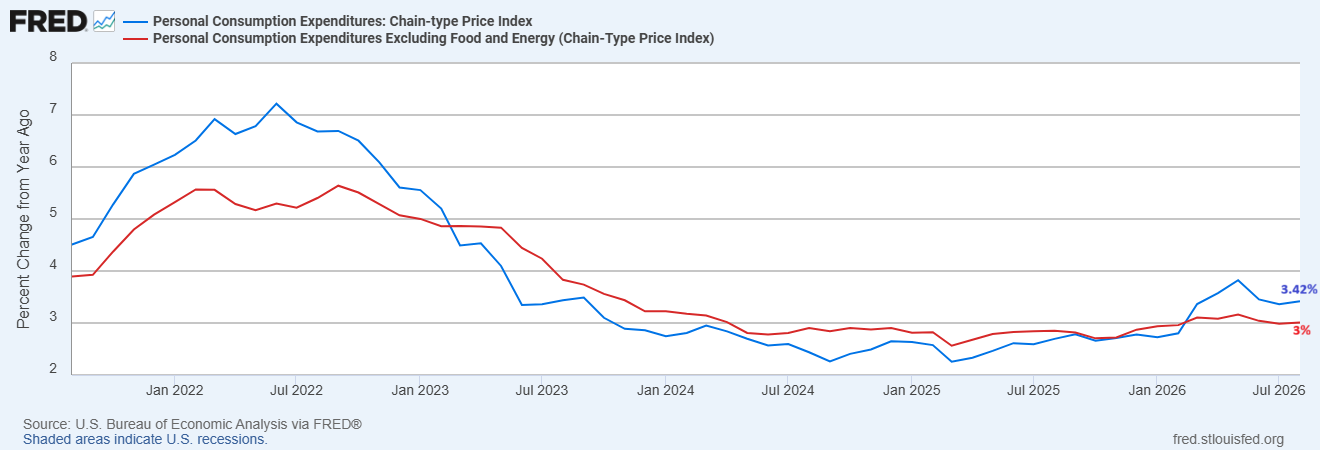
The monthly price growth increased from the revised 0.1% readings in July. The annual and monthly data show why the Fed can wait for more evidence while keeping further tightening in view. Gold received initial support from the surprise, but inflation still exceeded the 2% target set by the Fed.
Strong US Spending Limits the Case for Lower Rates
The consumer demand also limits the case for lower rates. The spending in August increased 0.9%. Real disposable income was essentially unchanged while the saving rate stood at 4.1%. The chart below shows this clear gap. Households spent more without the similar increase in purchasing power.
Gold Price Forecast
Every new Gold analysis as it publishes, today's technical signal and key levels, live price — on one page.
See all Gold forecasts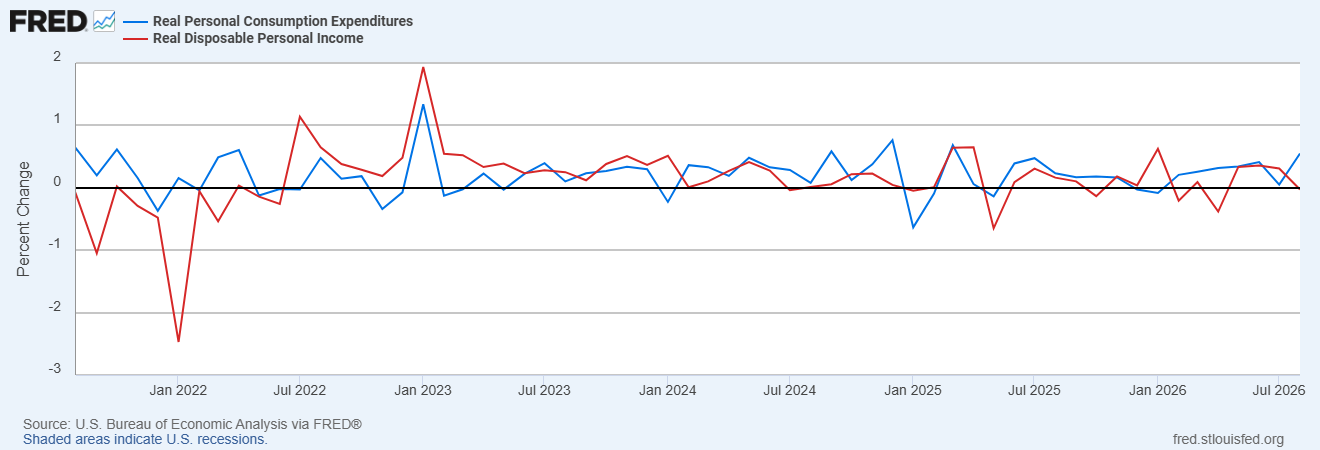
Meanwhile, BEA revised Q2 GDP growth to 2.2% annualized from 1.5%. The private domestic final sales increased 4.6% annualized and showed stronger demand beneath the headline figure. In my view, this resilience gives the Fed less reason to ease policy. But the spending cannot keep outrunning income indefinitely. A narrowing gap through weaker consumption would offer gold a more supportive growth backdrop.
US Jobs Report Could Shape Gold’s Next Move
The labor market presents a mixed picture. ADP reported 90,000 new private-sector jobs in September, which is up from revised 36,000 in August.
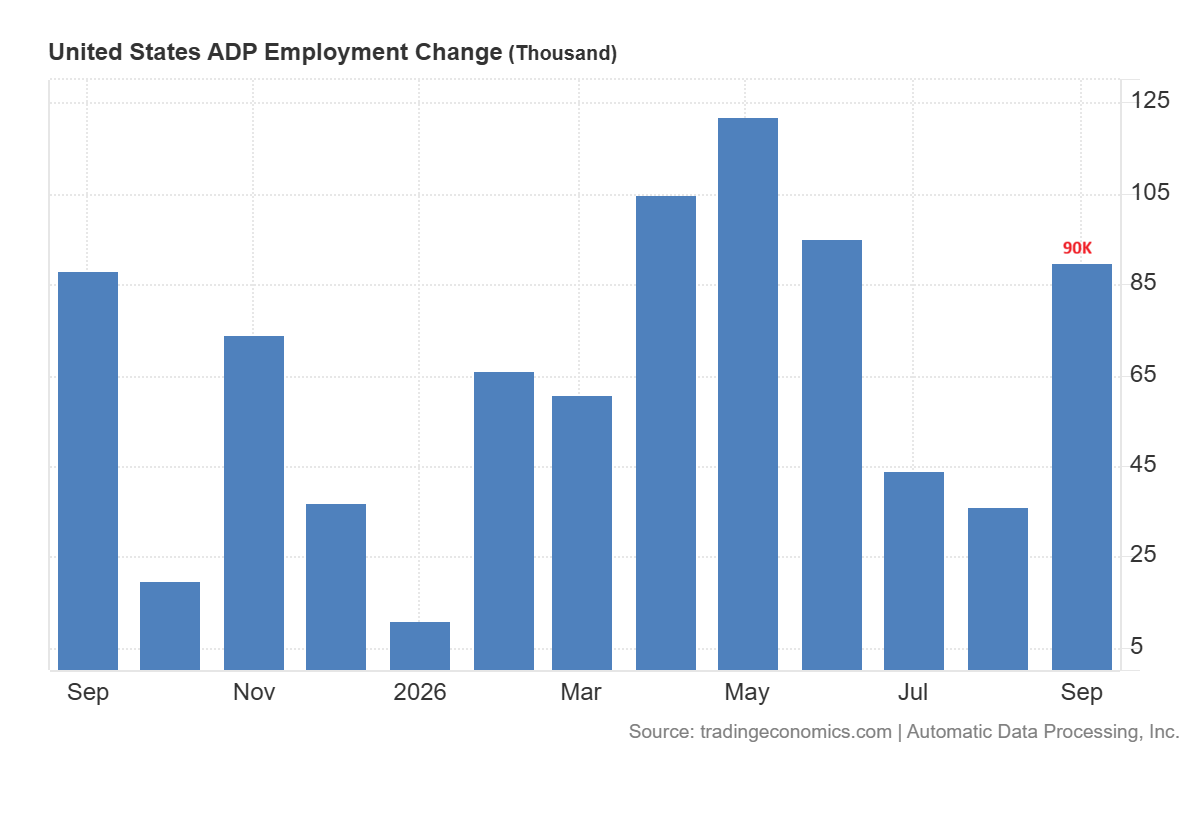
But JOLTS openings in August dropped to 7.08 million from 7.33 million in July. The stability in quits and layoffs also points to cooling rather than a sudden collapse.
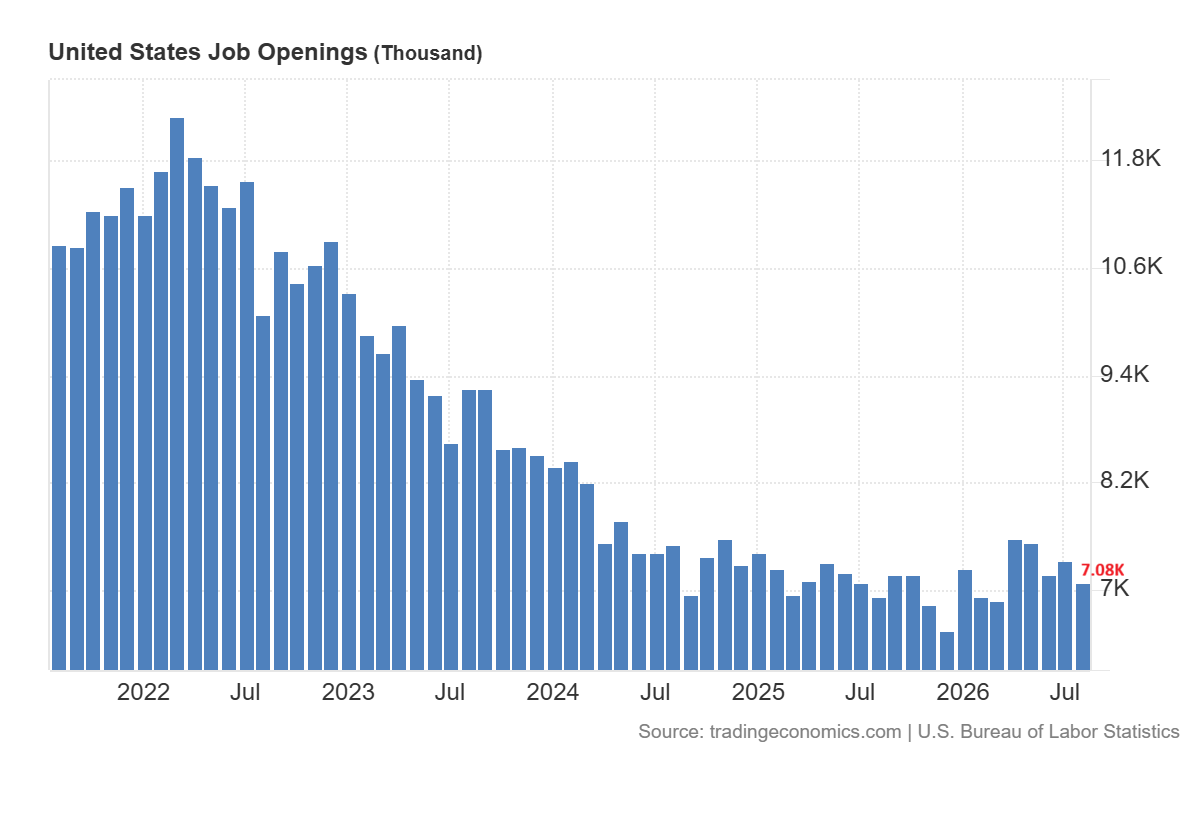
The chart below shows that the ratio of job openings to the unemployment level dropped to one vacancy per unemployed person. This suggests less pressure to compete for workers.
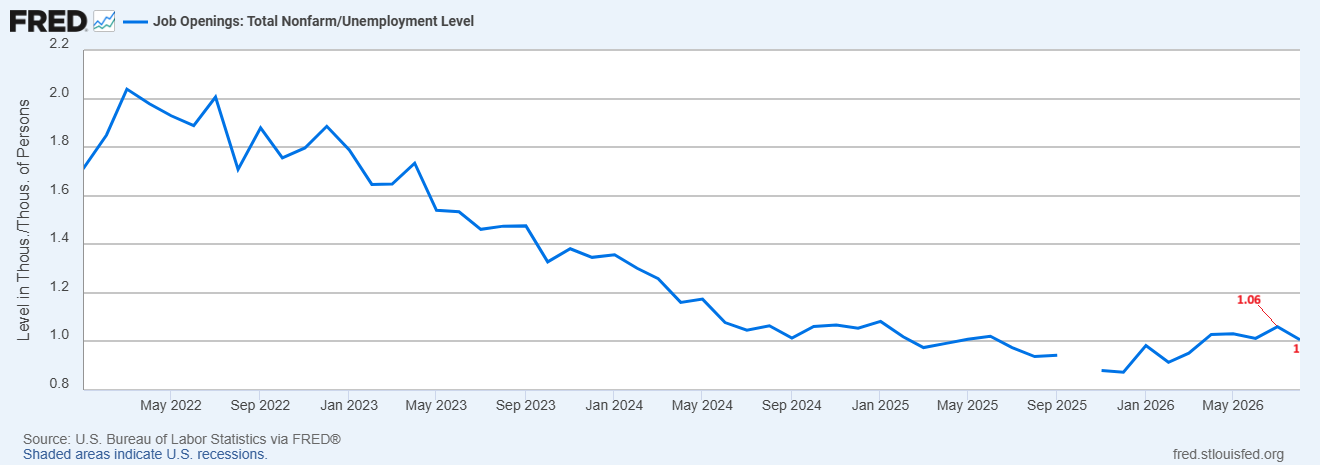
The employment report for September arrives on October 2. In my view, weak hiring and slower wage growth would support gold if they pull the Treasury yields lower. The strong data could revive the expectations of further tightening and limit the recovery.
The 10-year US Treasury yields have surged to 5.26% while the real yields have risen to 2.91%. The chart below shows that the 2-year yield stood at 4.89%.
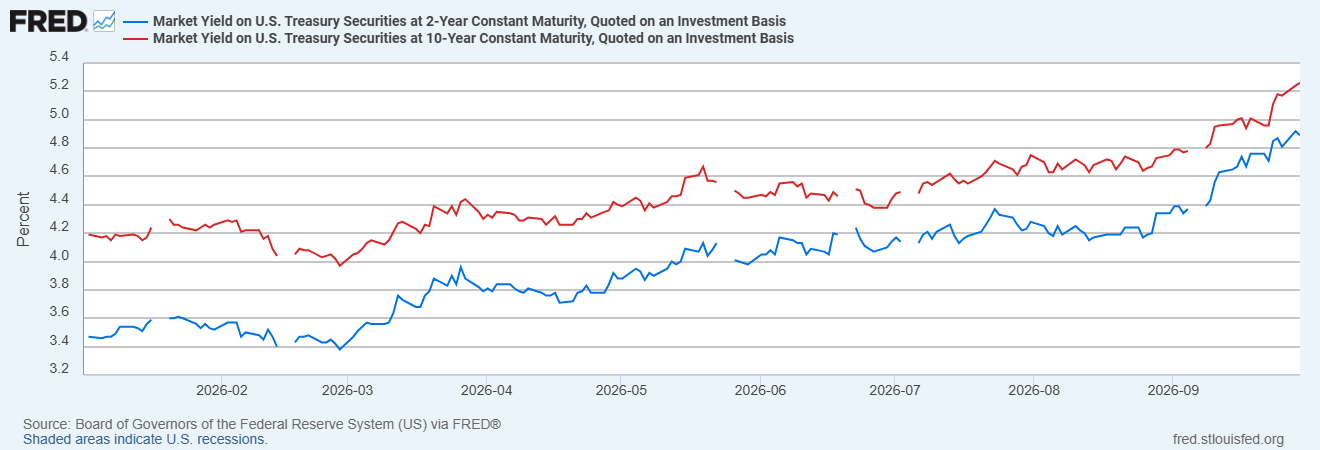
This data suggests that the policy expectations in the near term and the borrowing costs in the long term can move in opposite directions. The gap between nominal and real 10-year yields was about 2.35 percentage points. On the other hand, the US dollar index also remains strong near the key resistance zones.
In my view, the gold price needs real yields and the US dollar to retreat together before the PCE relief can develop into a stronger recovery.
Gold Technical Analysis: $4,100 Support Faces a Test
The weekly chart for spot gold shows that the price remains under bearish pressure in the short term after the peak of August 2026. This peak formed at $4,697, right at the resistance of the triangle pattern that stretches from the January 2026 highs.
The price has also lost 2.90% this week and still remains under bearish pressure despite the rebound after the PCE report. The next move in gold will likely depend on the upcoming US jobs data. A break below $4,100 will likely push prices further down towards the $3,900-$4,000 area. A break below $3,900 will open the way for a deeper correction to $3,500.
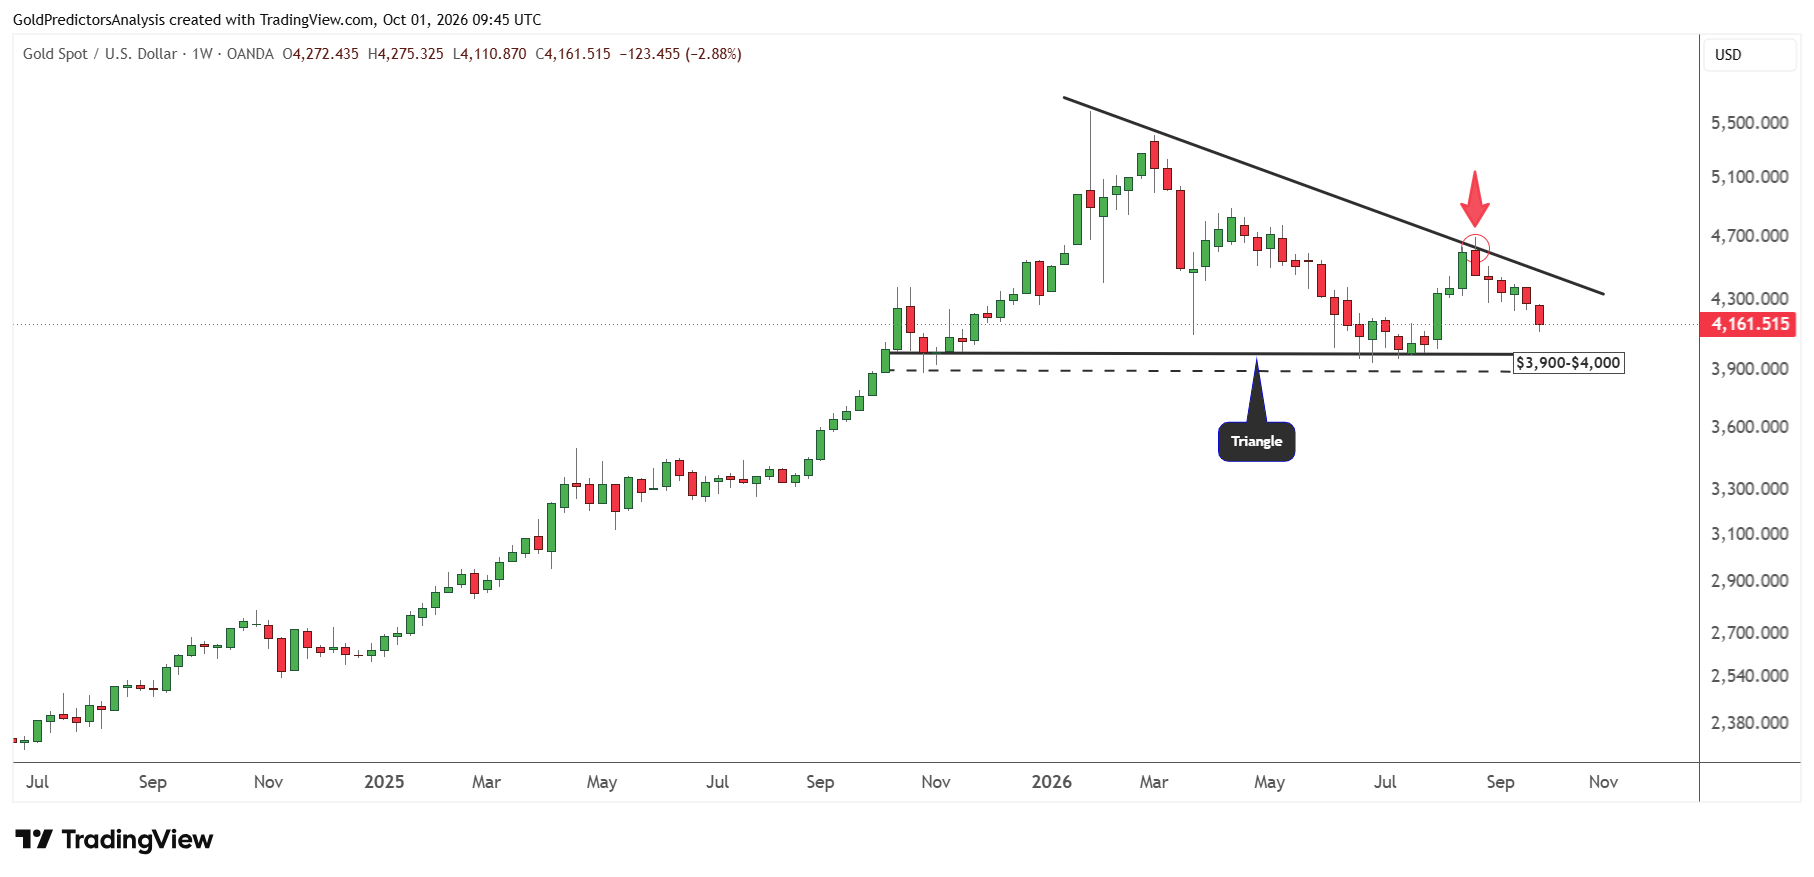
Based on the recent developments in the gold market, the outlook remains bearish in the short term. The price appears to be finding the next support to form a bottom.
Gold Ratio Analysis: Yields, Stocks and Money Supply
Gold-to-Treasury Yield Ratio: 700 Support in Focus
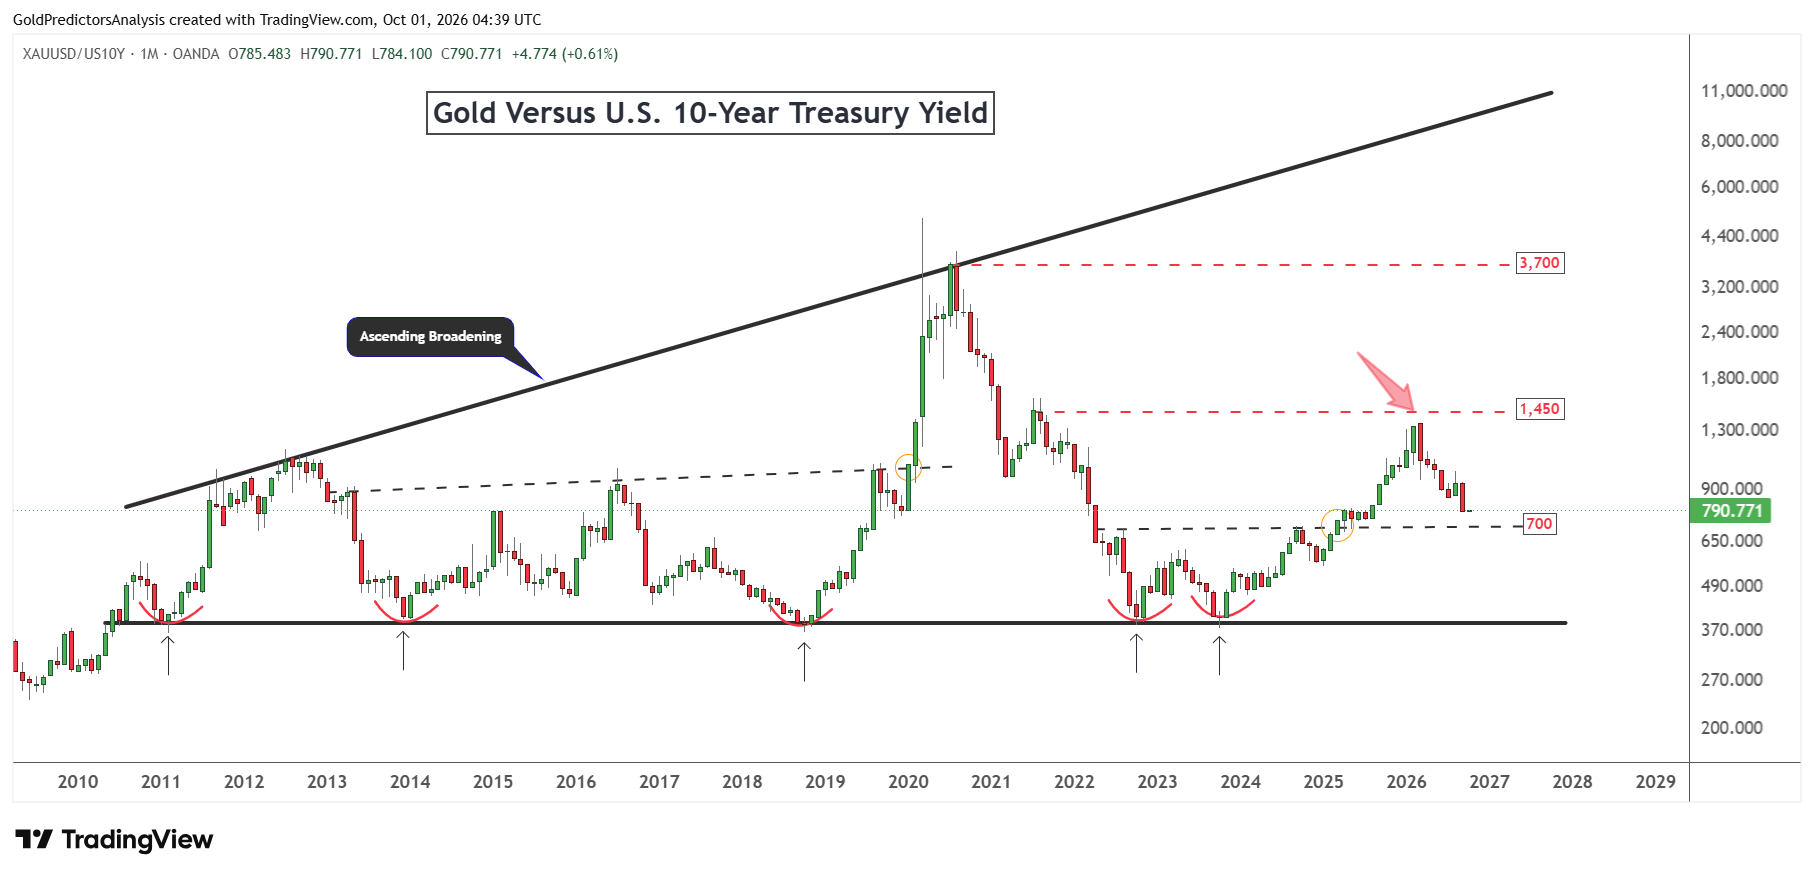
The ratio of gold to 10-year Treasury yield brings that rate pressure into focus. The monthly chart shows the formation of ascending broadening with a horizontal floor and a rising upper boundary. The ratio has retreated from around 1,450 to roughly 790.
The immediate support in the ratio is near 700. A sustained rebound from this level would preserve the recent base and put 1,450 back in view. But a break below 700 would weaken the recovery and draw attention to lower historical floor near 380.
The spike in 2020 was due to the Fed cuts to near zero during the COVID-19 pandemic. The collapse of the Treasury yields magnified the increase in the ratio. The rising ratio in 2025 and 2026 is due to the falling Treasury yields.
Gold vs Nasdaq 100: Key Support and Breakout Levels
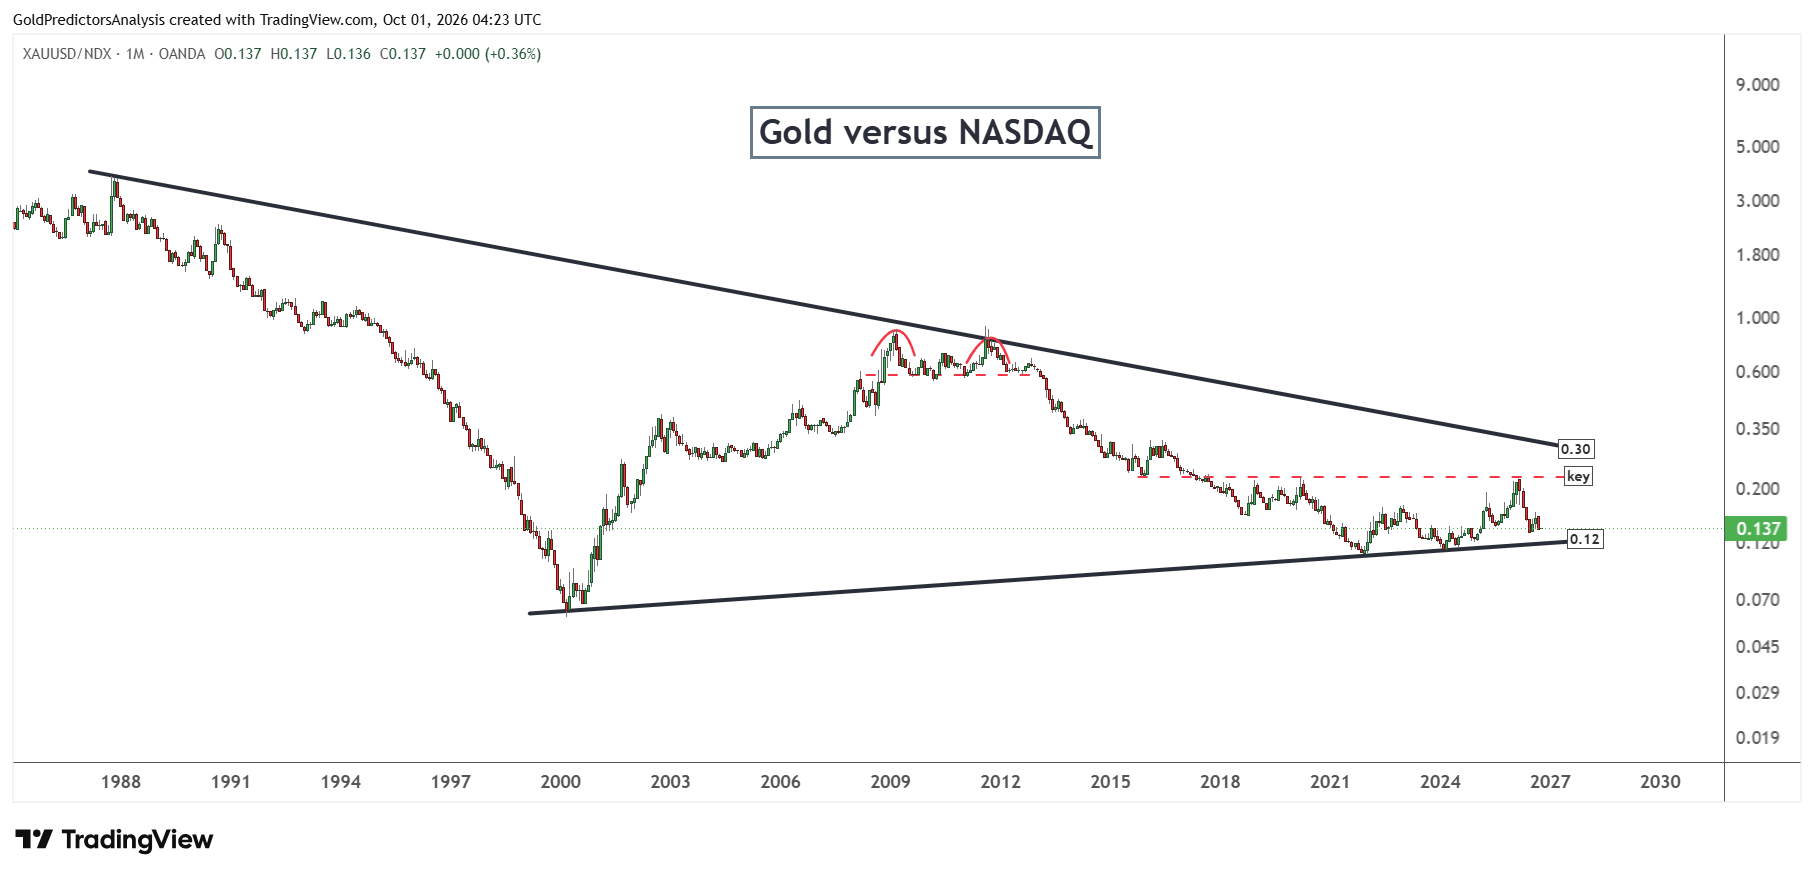
The ratio of gold to Nasdaq 100 extends that comparison to technology stocks. The chart below shows that the ratio remains near 0.137, which is just above rising support around 0.12 within large symmetrical triangle. The rally of 2024 and 2025 has reversed from the key resistance area near 0.22.
The gold price needs to gain enough strength against Nasdaq to break the key level of 0.22. A break above 0.22 would open the way for a rally towards the resistance of 0.30 in the long term. The ratio produced a bottom around the dot-com peak and recovered due to the weakness in technology shares. That period included the dot-com collapse and recession.
In the current situation, high yields could also weigh on expensive technology shares. But the positive move in the ratio would confirm the outperformance of gold against the Nasdaq.
Gold vs S&P 500: Rounding Bottom Awaits Confirmation
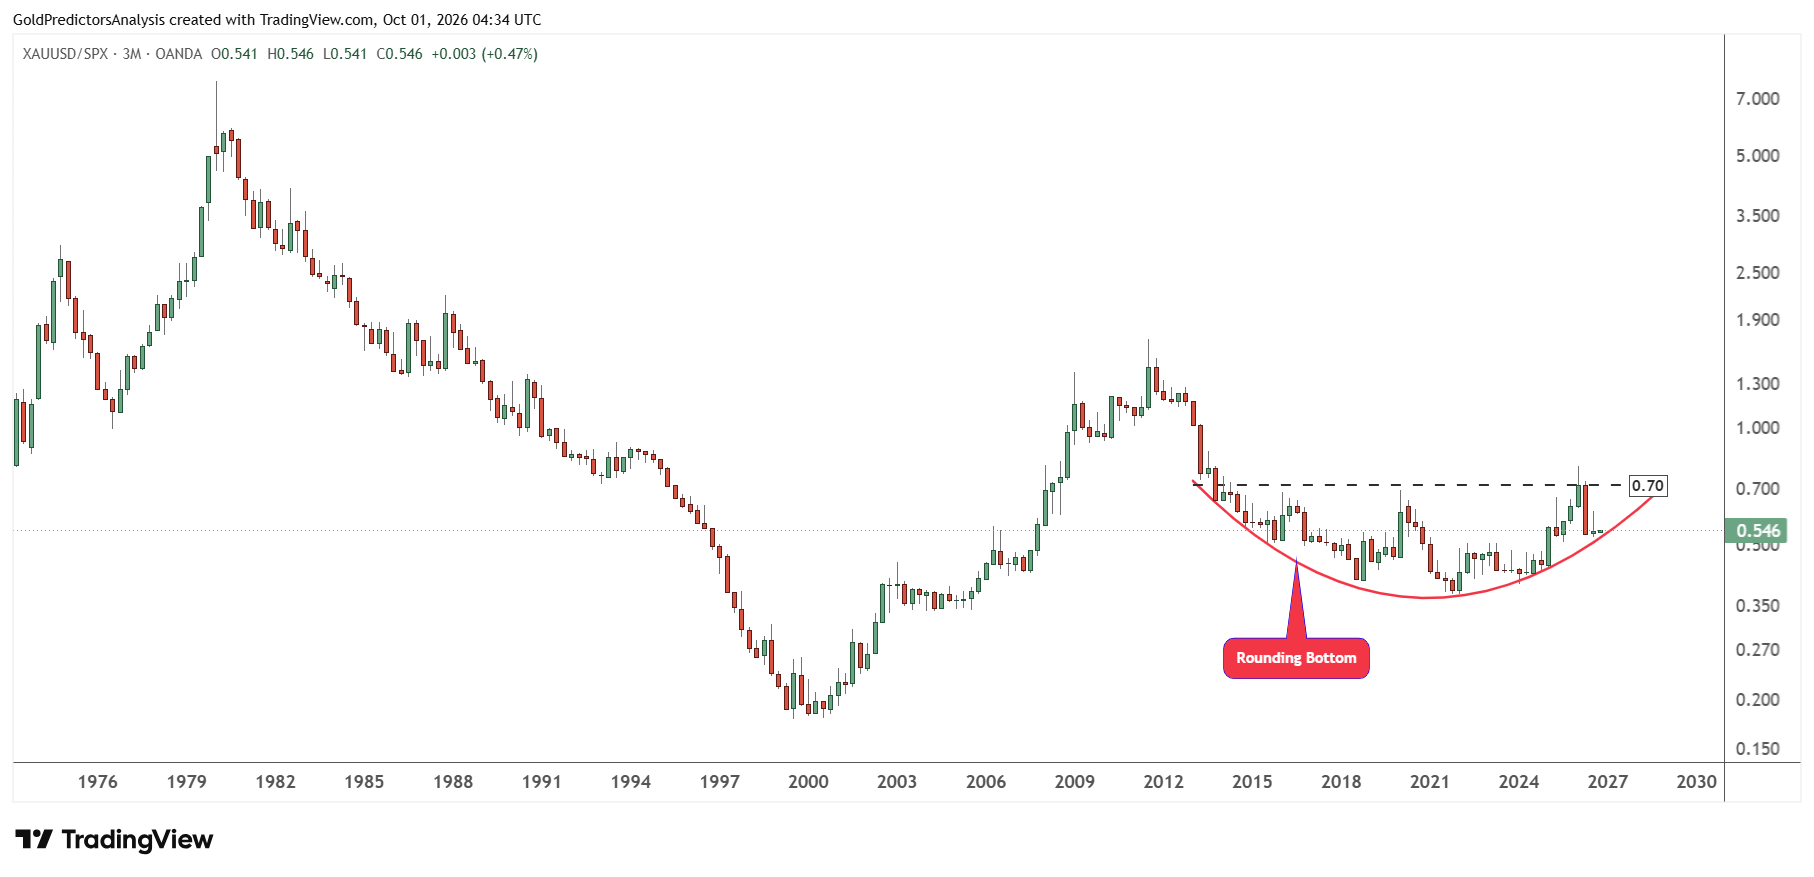
The ratio of gold to S&P 500 shows a broader rounding bottom on the quarterly chart. The ratio stands near 0.546 after failing to sustain its advance through the 0.70 neckline. The long base remains visible, but the breakout is incomplete. A quarterly close above 0.70 would provide stronger evidence that gold is gaining ground against US equities.
The earlier strength around the 2008 financial crisis and subsequent European debt crisis shows how stress can shift that balance to gold. But the current spending and growth data still give equities an economic cushion.
In my view, the strong relative signal in gold would emerge if growth softens and yields decline. The renewed equity strength would make that harder. The next move in the relative strength in gold against S&P 500 will likely be decided in Q4 2026 as the ratio trades at the support of the rounding bottom.
M2-to-Gold Ratio Signals Long-Term Relative Strength
The quarterly chart below shows that the ratio of M2 to gold trades near 5.59 billion, below the broken rising support line. A falling ratio means that gold gains value relative to the money supply. The earlier declines accompanied the gold advances of the 1970s and the 2000s.
The move of the 1970s followed the end of dollar convertibility in gold in 1971, which changed the monetary backdrop.
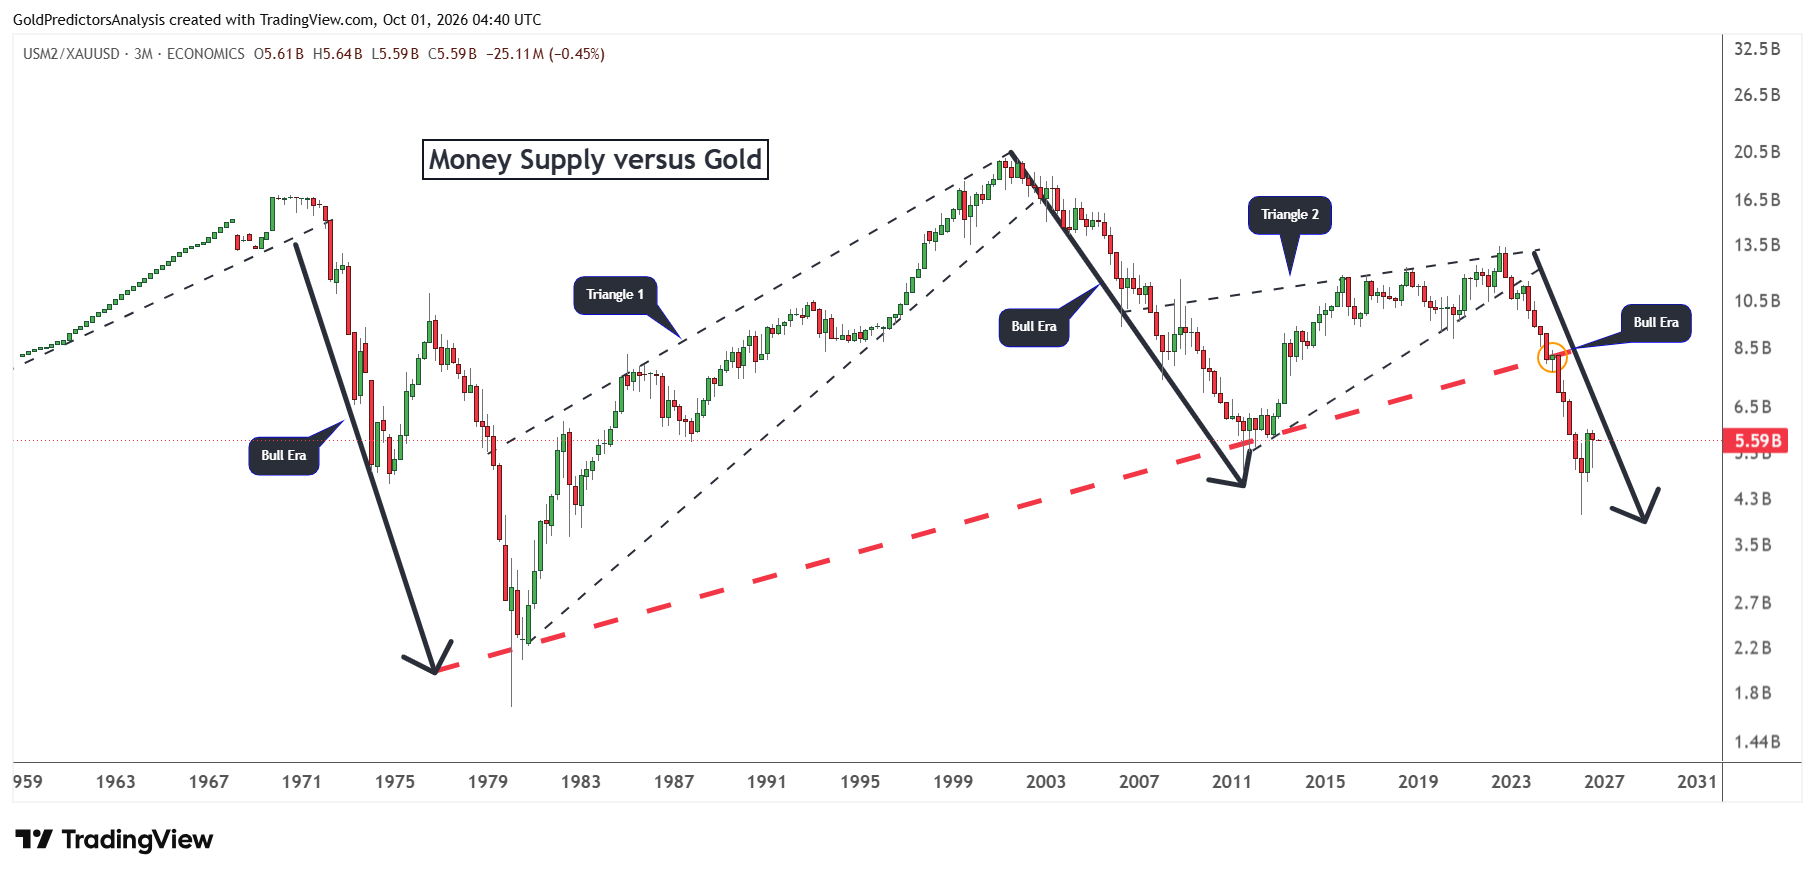
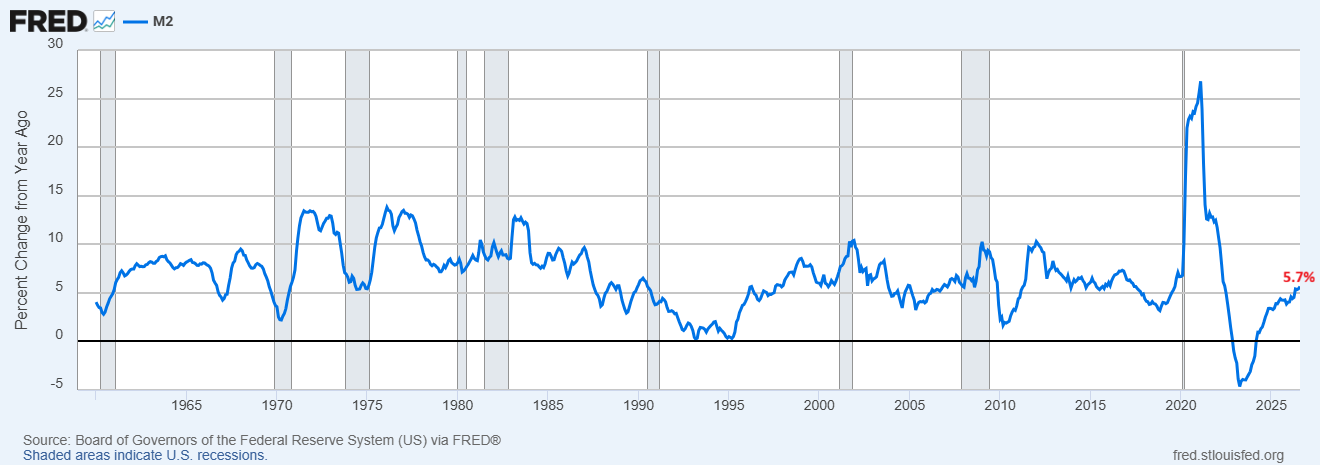
The chart below shows that the M2 is growing about 5.7% annually in August. Therefore, the decline in the ratio of M2 to gold cannot be attributed to shrinking money supply. In my view, this supports the relative strength of gold in the long term despite the current correction. A sustained return above the broken trendline would weaken that view.
Based on these analyses, the gold price still remains within a bull market since 2022. Therefore, the correction in gold from the record level of $5,600 might produce a bottom at the long-term support zones to form another bottom.
What to Watch Next in Gold
Gold remains vulnerable in the short term as high real yields and strong consumer demand limit the relief from softer PCE inflation. A break below $4,100 would indicate further decline to the support area of $3,900-$4,000. The break below $3,900 would increase the risk of a deeper correction towards $3,500. However, the falling M2-to-gold ratio and the long bases against US equities leave room for a recovery in the long term.
In my view, gold needs to stabilise near $4,000 while real yields and the US dollar need to correct. A rebound from 700 in the ratio of gold to Treasury yield would strengthen the relative outlook, while the equity ratios still need to confirm their breakouts.
The first major test is the US jobs report on October 2. The market will watch payroll growth, unemployment and wages together. The weak hiring and slower growth in wages could ease the expectations of further tightening and support gold if yields drop. The strong results could keep yields elevated and increase pressure on $4,000.
The next key events include CPI inflation on October 14, the Fed decision on October 28 and GDP and PCE releases on October 29. The guidance by the Fed and developments in the energy market also matter. A correction in the 10-year Treasury yields below 5% would give gold a stronger basis for recovery.
Read more: Gold Lags S&P 500 as Real Yields Stay High