



June WTI Holds the 50-Day MA While Washington and Tehran Play Chicken
June WTI crude oil futures are modestly higher Friday and the 50-day moving average at $90.58 has now stopped the selling three times this week. That is not a coincidence. The Strait of Hormuz is still the center of everything, Trump called Thursday’s exchange of fire “just a love tap,” and Secretary of State Marco Rubio is waiting on Tehran’s answer to a peace proposal. One level on the chart and one phone call from Tehran decides where June WTI goes next. Here is the setup.
Technical Outlook
June WTI Crude Oil Futures
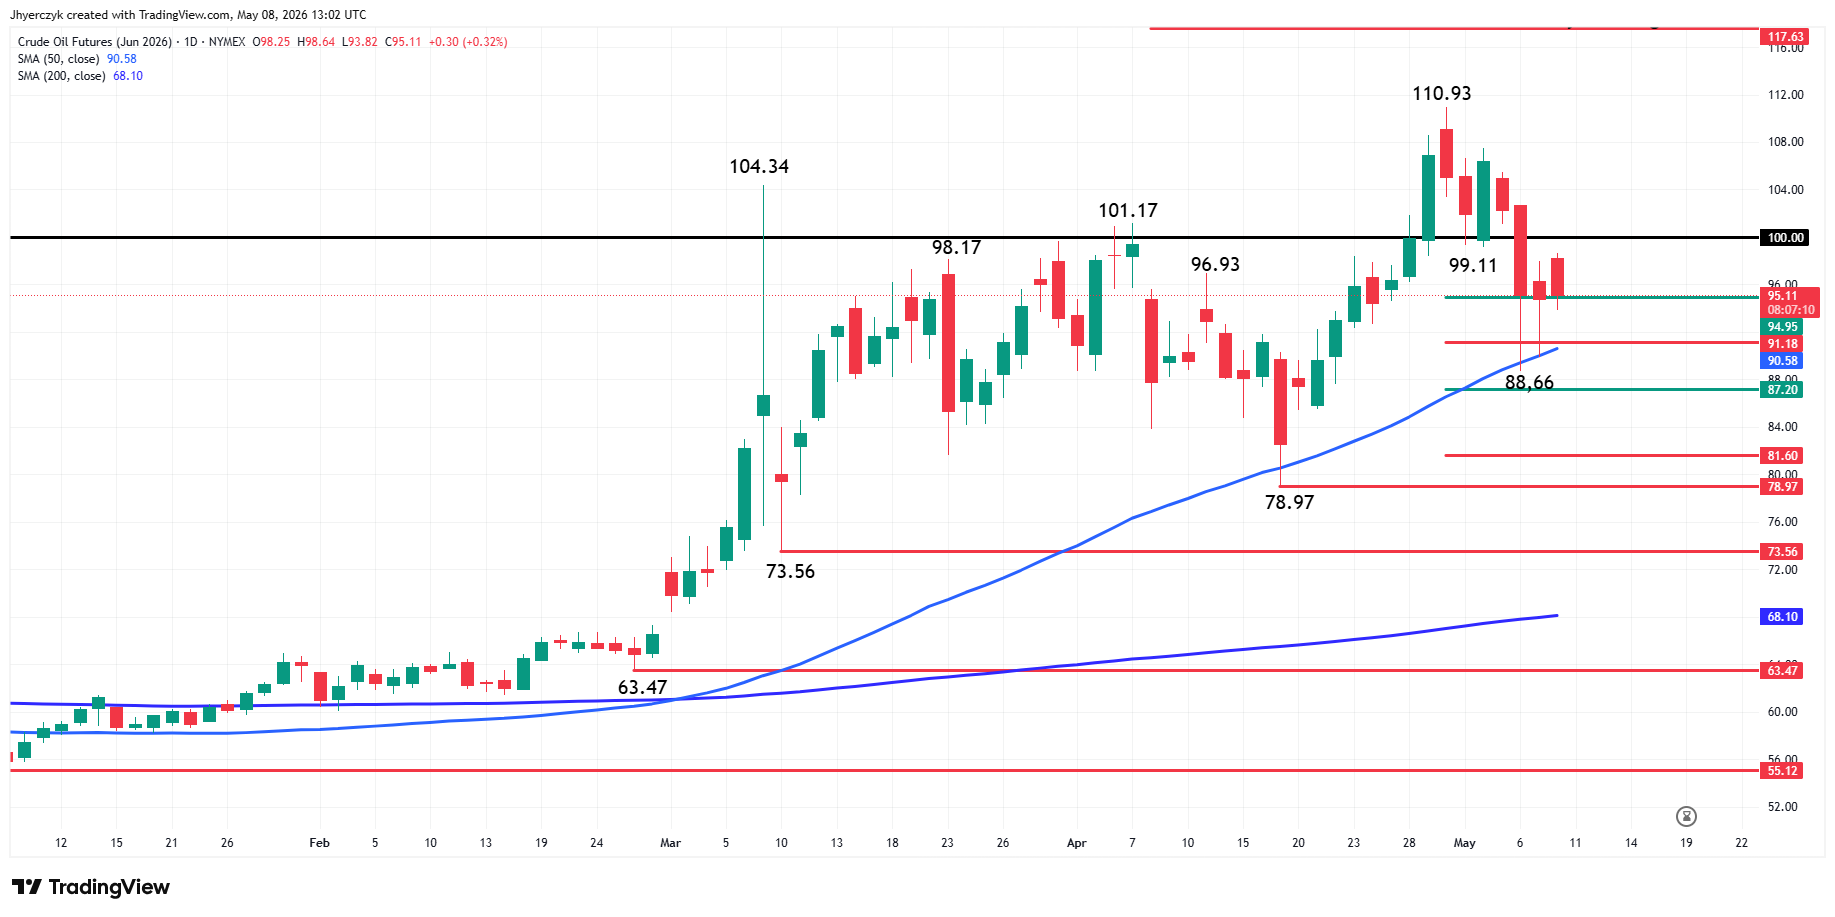
June WTI crude oil futures are modestly higher on Friday with traders eyeing the psychological $100 level as both resistance and a potential trigger point for an acceleration to the upside.
The main trend is up according to the daily swing chart, but the minor trend is down, leading to a shift in momentum. A trade through $78.97 will change the main trend to down, while a move through $110.93 signals a resumption of the uptrend.
Additionally, the $78.97 to $110.93 range has created a support zone at $94.95 to $91.18. The market is currently trading on the strong side of this range.
The short-term range is $110.93 to $88.66. This creates an upside target or pivot at $99.80, forming a resistance cluster with $100. Overcoming this area will signal that momentum may be shifting higher.
Based on the price action this week, the most important indicator on the daily chart is the 50-day moving average at $90.58. It stopped the selling on April 17 and two times this week, indicating that traders were still buying dips.
Additional support is $87.20 to $81.60, the last support before the $78.97 main bottom.
Even technical traders are aware of the current headlines, which brings up the question, are we in a sell the rumor, buy the fact situation. We could know the answer today if the headline is bearish and buyers come in again on a retest of the 50-day MA. Overcoming $100 will also signal the same situation.
Brent Oil Price Forecast
Every new Brent Oil analysis as it publishes, today's technical signal and key levels, live price — on one page.
See all Brent Oil forecastsJuly Brent Crude Oil Futures
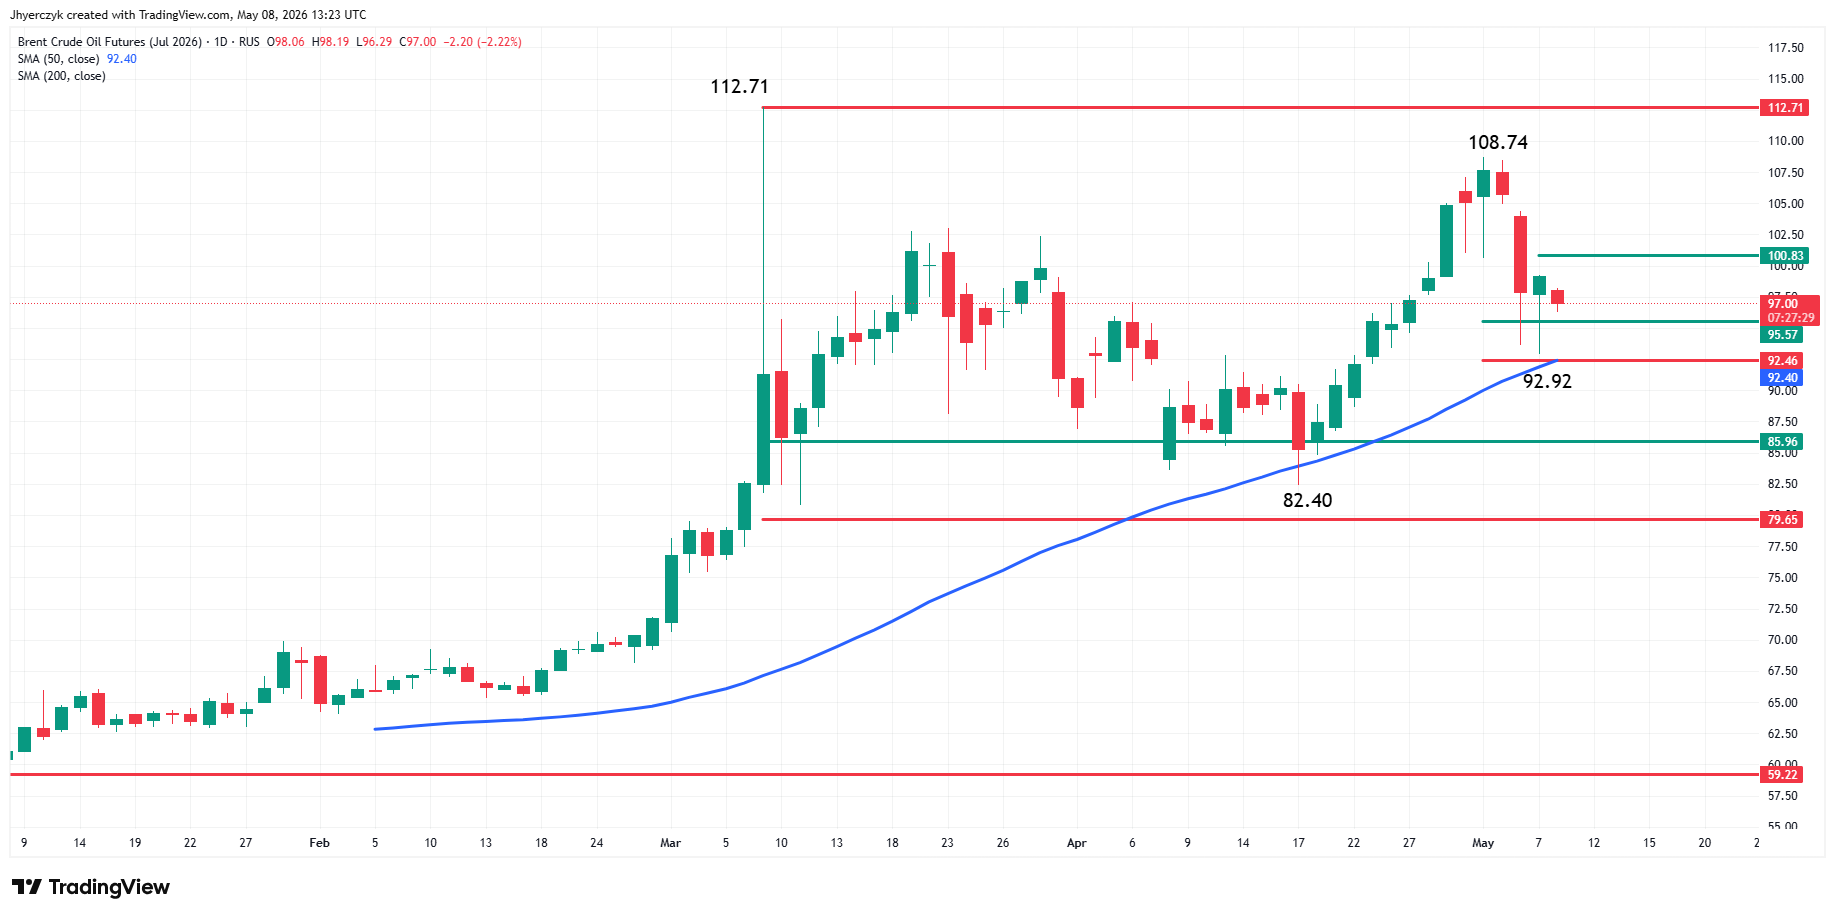
Despite this week’s steep sell-off, July Brent crude oil futures are still in an uptrend according to the daily swing chart. A trade through $82.40 will change the trend to down. A move through $108.74 will signal a resumption of the uptrend.
The short-term range is $82.40 to $108.74. Its retracement zone at $95.57 to $92.46 is currently providing the support along with the 50-day moving average at $92.40. As long as this area holds as support, there is a chance of a rebound rally with the pivot at $100.83 the first target. Overcoming this level will put $108.74 to $112.71 back on the radar.
If the 50-day MA at $92.40 fails then look for the selling to extend into the retracement zone at $85.96 to $79.65.
The Ceasefire That Keeps Getting Tested
Trump told reporters Thursday that what happened in the Strait of Hormuz was “just a love tap.” That is one way to describe it. Both sides exchanged fire, both sides blamed the other, and both sides are still technically inside a ceasefire agreement that neither one wants to be the first to formally break. The Strait handles roughly one-fifth of global oil supply on a normal day. Traders are not waiting for it to become an abnormal day before they price in the risk. That floor under the market is real and it stays there until something changes in the negotiations.
The Diplomacy Track
Rubio said Friday that Washington is expecting an answer from Tehran on a proposal tied to Iran’s nuclear program. Iran confirmed it is reviewing the message through Pakistani mediators. No answer yet. Traders watching this know exactly what a positive response means for June WTI crude oil. Lower. Fast. The risk premium that has been built into this market since February comes out the same way it went in, quickly and all at once. I’ve watched this market price in war for months. It will price out peace in a session.
What I’m Watching
The 50-day moving average at $90.58 is the line June WTI crude oil keeps defending. Three tests this week and buyers showed up every time. That tells me dip buyers are still active and the main trend is still intact. The question that gets answered today or next week is whether this is a sell the rumor, buy the fact setup. A bearish headline that brings buyers back to the June WTI 50-day MA again confirms it. A push through $100 confirms it from the upside. Until one of those happens, June WTI crude oil is range-bound and every session inside that range is just noise.
If you’d like to know more about how to trade crude oil, please visit our educational area.