


Platinum (XPL) and palladium (XPD) started the week under pressure as oil prices broke above $100 and markets braced for a rate hike by the Federal Reserve. Higher Treasury yields and a stronger U.S. dollar reduced demand for precious metals. Rising energy costs also increased concerns about inflation, production expenses and vehicle sales. In my view, platinum has the strong outlook in the long term, but both markets need lower oil prices and softer rate expectations to begin a sustainable recovery. This article presents the key factors affecting platinum and palladium prices and examines the key technical levels to watch.
Key Drivers of Platinum and Palladium Prices
Fed Rate Hike Bets and Higher Yields Pressure Metals
Platinum and palladium began the week on a stable note, but the macro environment is tough. On Monday, platinum traded around $1,800 and palladium traded around $1,295.
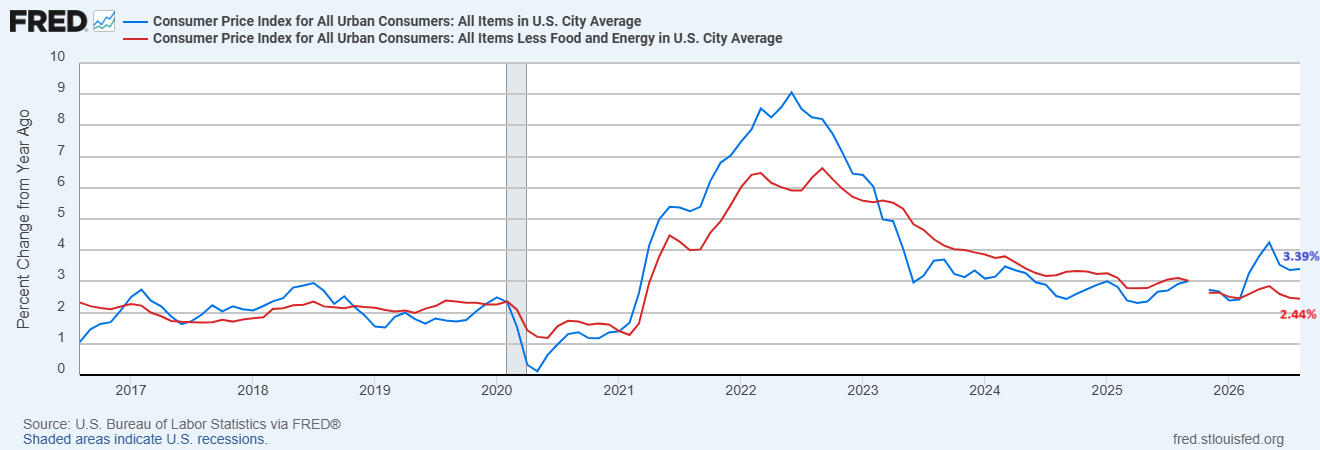
The inflation report on Friday increased the odds of another rate hike. The headline CPI increased to 3.4% for the 12 months to August, while the core CPI increased 2.4% year over year.
The market now expects an 86.5% chance of a Fed rate hike this week. The 10-year Treasury yield rose to 4.95% and the 10-year real yield rose to 2.55%. These higher yields also create pressure for precious metals. A strong U.S. dollar adds additional strain.
Karo Project Improves Long-Term PGM Supply Visibility
On Friday, a significant development emerged in the supply picture. Tharisa priced a $300 million five-year bond to finance the Karo PGM project in Zimbabwe.
Tharisa expects the first ore to reach the mill in the fourth quarter of 2027. The project is expected to more than double PGM output. This won’t immediately put more metal on the market. But it does make the future supply of platinum and palladium more transparent.
CFTC Positioning Favors Platinum Over Palladium
The CFTC positioning report showed that money managers held net-long position in platinum contracts, while maintaining a net-short position in palladium contracts.
This position exhibits more speculative buying interest in platinum. But the net-short palladium position fell during the week, which provides some short-covering opportunity.
Oil Above $100 Raises Costs and Threatens PGM Demand
Higher oil prices now create another big threat to platinum and palladium. Oil prices rose on Monday to $108 per barrel for Brent crude and $103 for WTI oil.
The latest Saudi energy infrastructure attacks led to a temporary shutdown of the East-West pipelines. This route can transport approximately 4% of the world’s oil.
The chart below shows that oil prices remain significantly higher than the levels seen before the US-Iran war. WTI oil gained over 50% after the war. The chart highlights the negative correlation between oil and precious metals after the war.
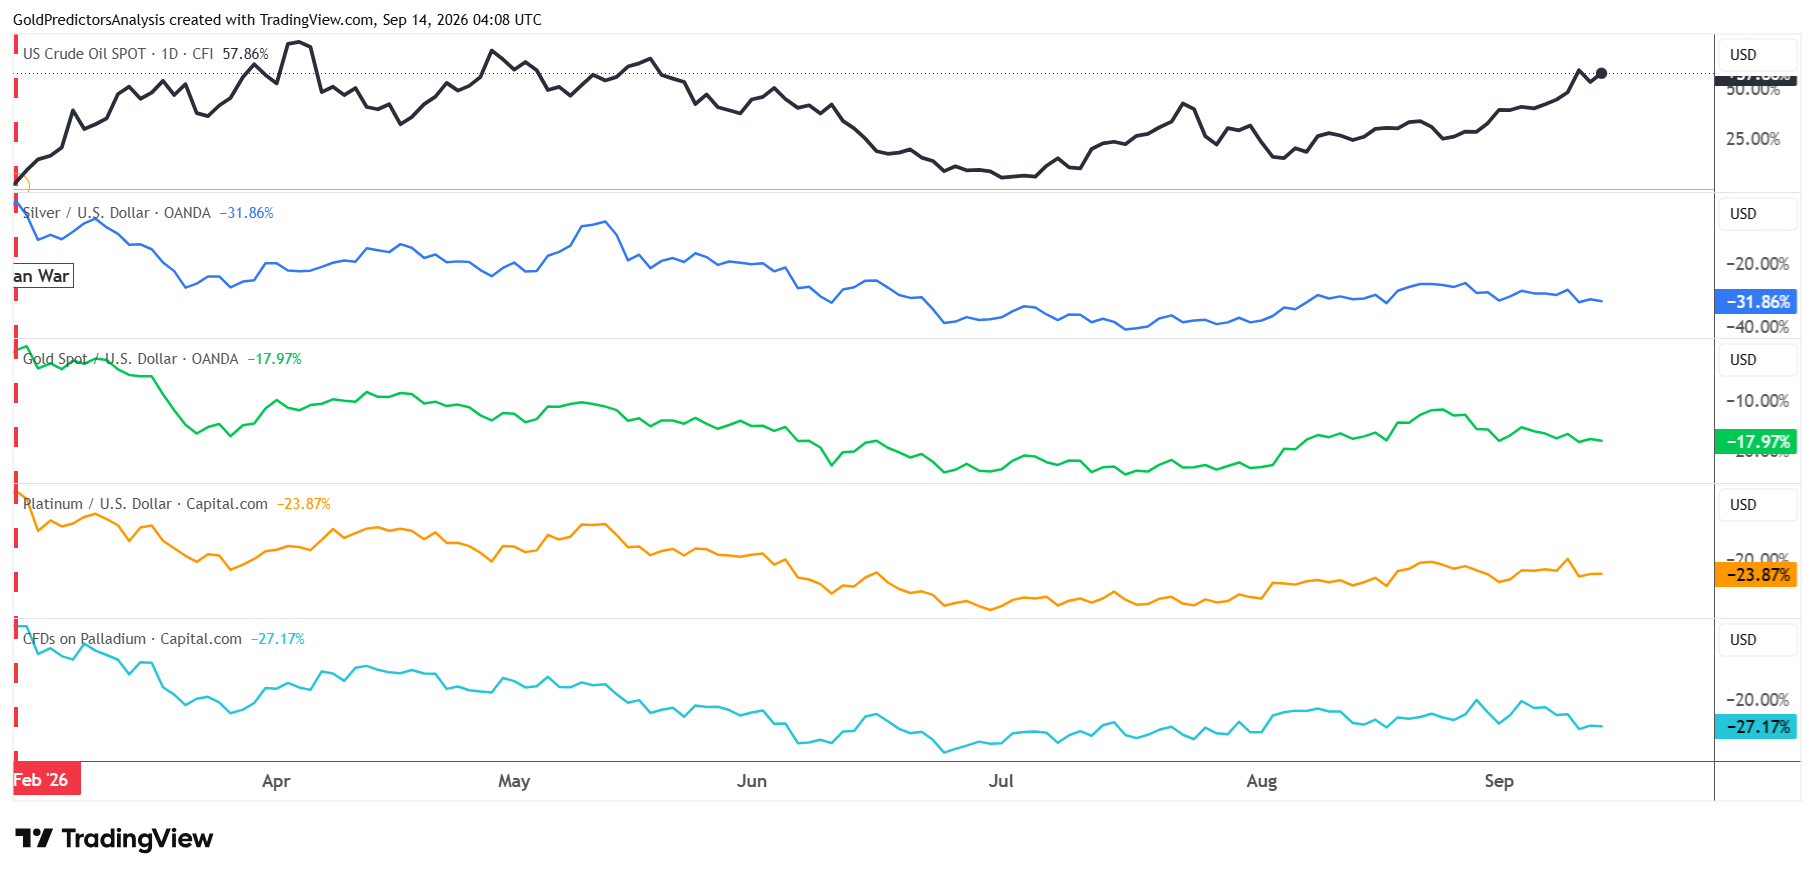
Gold (XAU), platinum, palladium and silver (XAG) have fallen by 17.97%, 23.87%, 27.17% and 31.86%, respectively. The increase in oil prices can lead to a rising demand for a hedge against inflation. But they also sustain high interest rates. They push up the price of mining, refining and shipping. Higher gasoline costs may also reduce vehicle demand. These negative pressures during this period have outweighed the demand for inflation protection.
Hybrid Sales Offer Mixed Support for Palladium Demand
There is some support from vehicle demand but it is mixed. Benchmark Mineral Intelligence reported that the global sales of battery electrics and plug-in hybrids increased by just 2% year-on-year in August. Total sales reached 1.83 million.
European sales increased by 36%, while sales in China and North America fell by 11% and 33%, respectively. Hybrids captured most of the market share that EVs lost in North America.
This is important because pure battery electric vehicles have no emissions control catalysts, whereas hybrids do. This change might reduce the fall in PGM demand, particularly palladium demand. The chart below shows that the light vehicle sales in US improved to an annualized rate of 16.764 million in August.
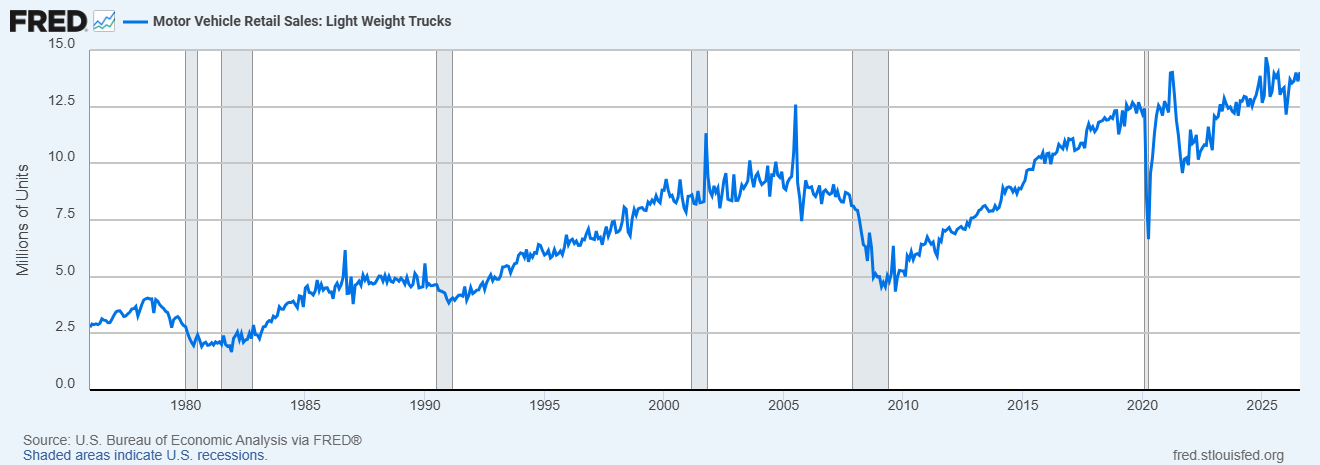
But manufacturing of motor vehicles and vehicle bodies and chassis fell in July. In my view, the relative outlook for platinum is stronger. Palladium is more reliant on demand from vehicles and short covering. Both metals require stabilization in the oil market to achieve a sustainable recovery.
Technical Outlook for Platinum and Palladium Prices
Platinum Price Forecast: $1,900 Remains the Key Breakout Level
The daily chart for platinum shows that the price spiked last week to a high of $1,925.73 but failed to hold above $1,900. The price dropped to close the week around the $1,800 level. Price has failed to break above $1,900, which indicates negative price action in the short term.
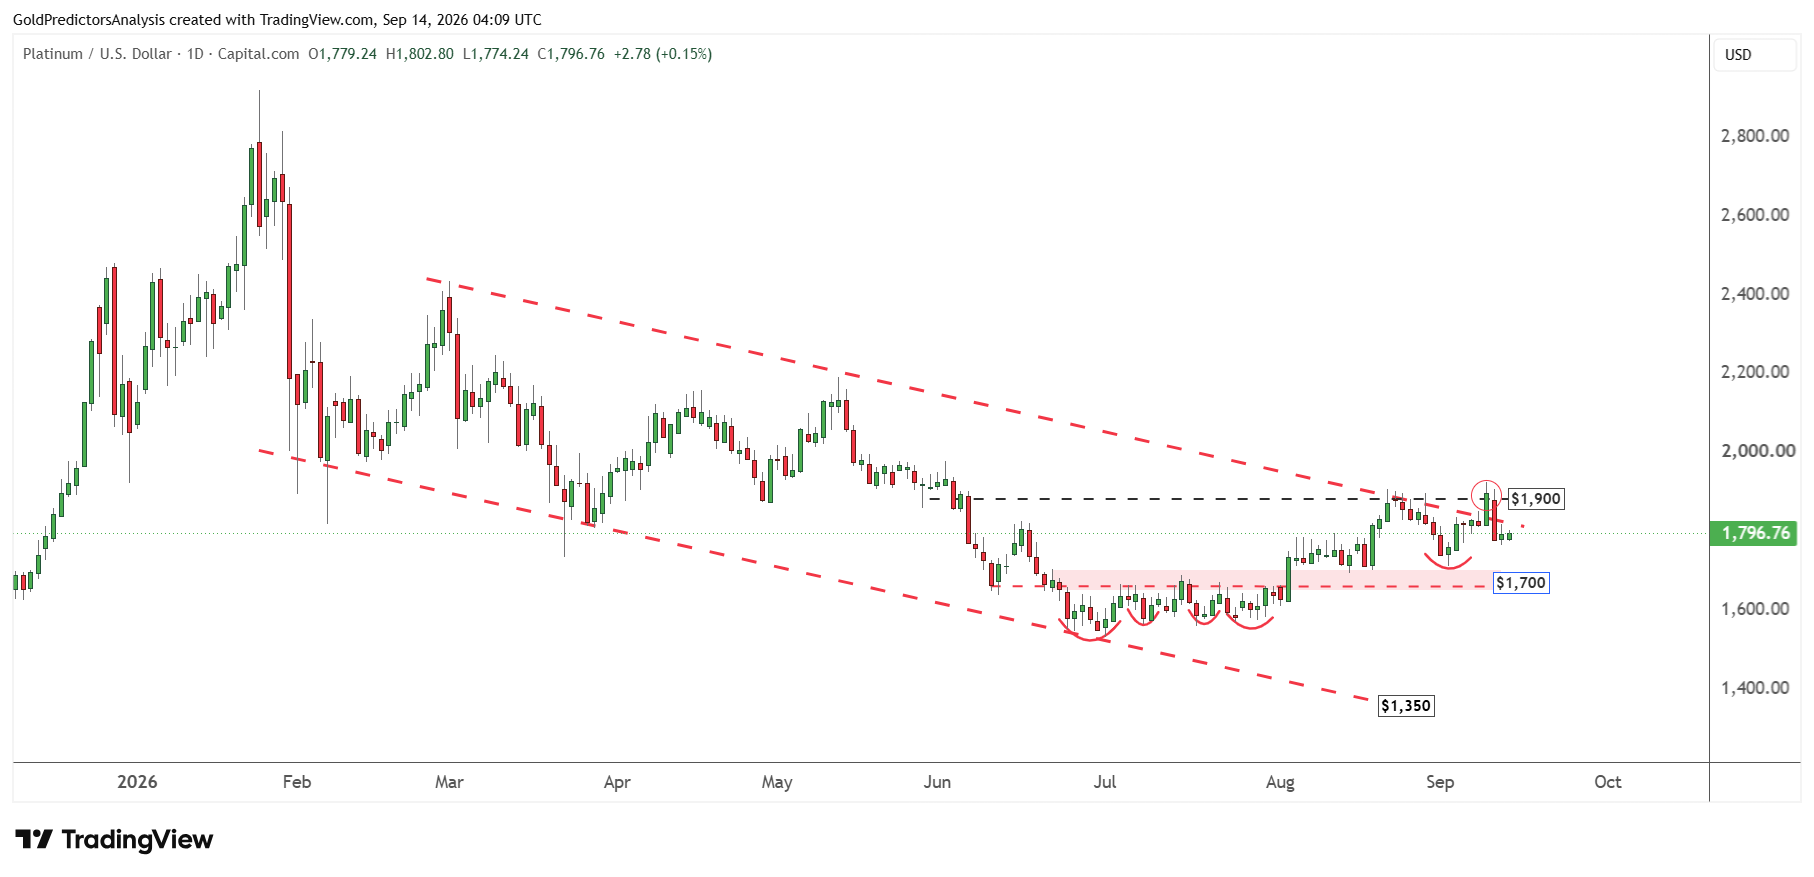
If the price stays below $1,900 and consolidates longer, it will likely increase the possibility of a break below the $1,700 region. A break below $1,700 will likely open the way to $1,350. This support is defined as the lower boundary of the descending channel pattern. But a break above $1,900 will confirm bottom in the short term and push prices toward $2,200.
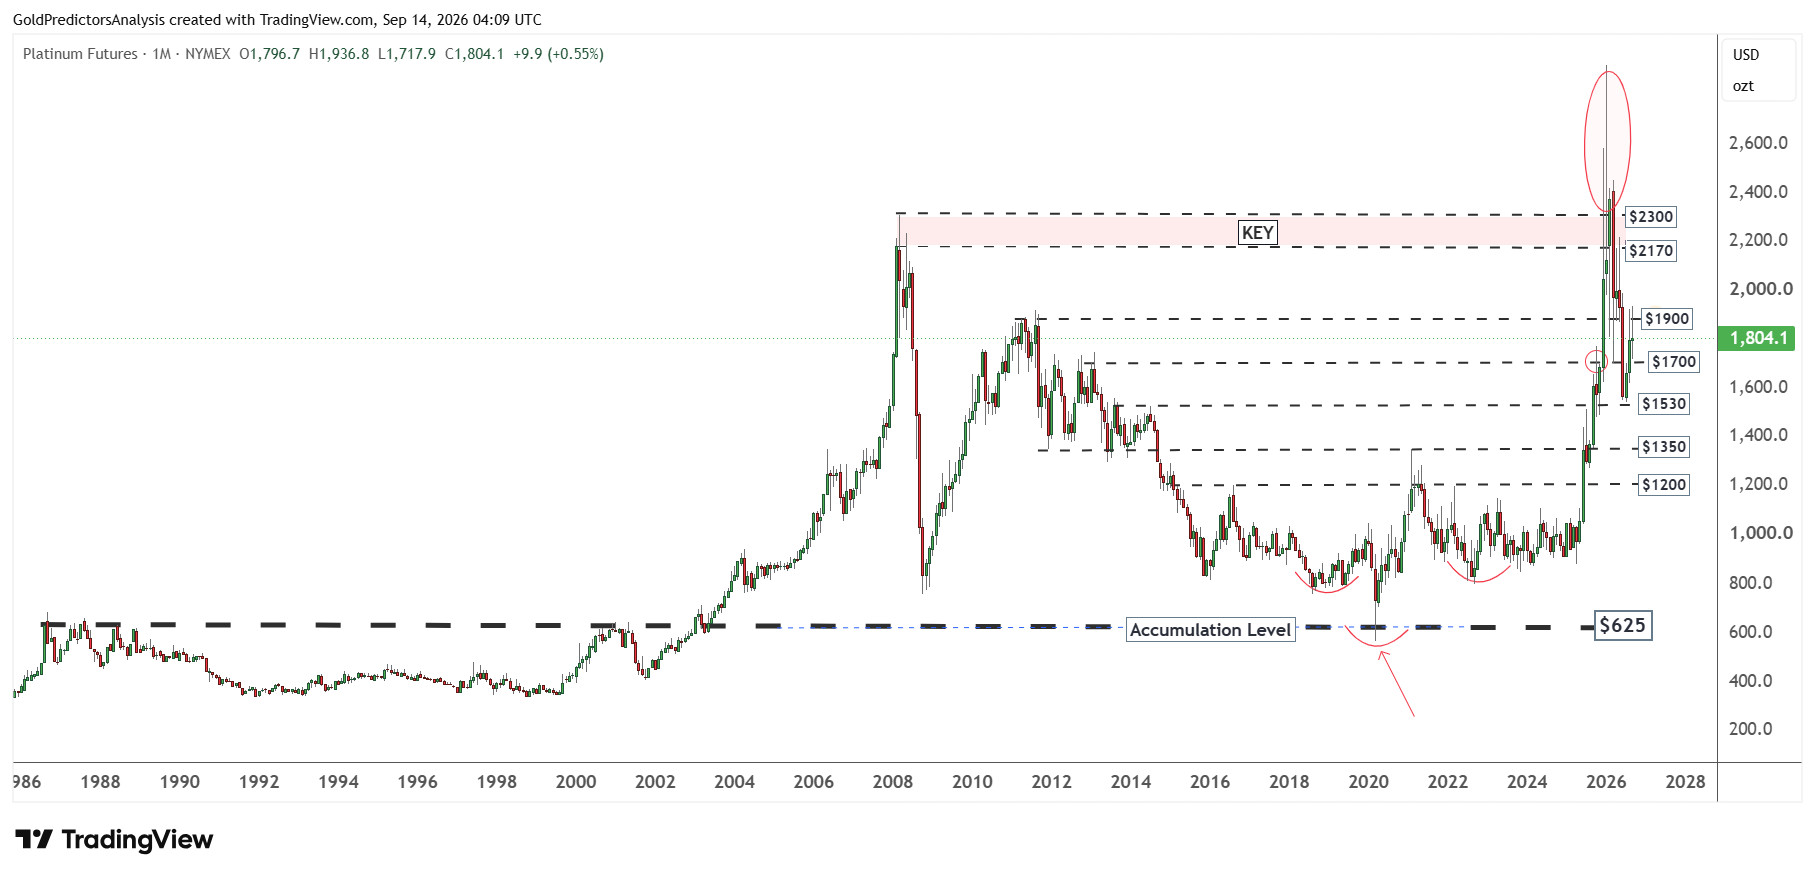
The importance of $1,900 is also evident on the monthly chart. The chart shows that the resistance of $1,900 lies at the August 2011 highs. A break above this level is required to push the price higher. But the formation of an inverted head and shoulders pattern from 2018 to 2023 suggests positive price action in the platinum market. Therefore, the price action supports a bullish outlook in the long term.
Palladium Price Forecast: $1,200 Support Comes Into Focus
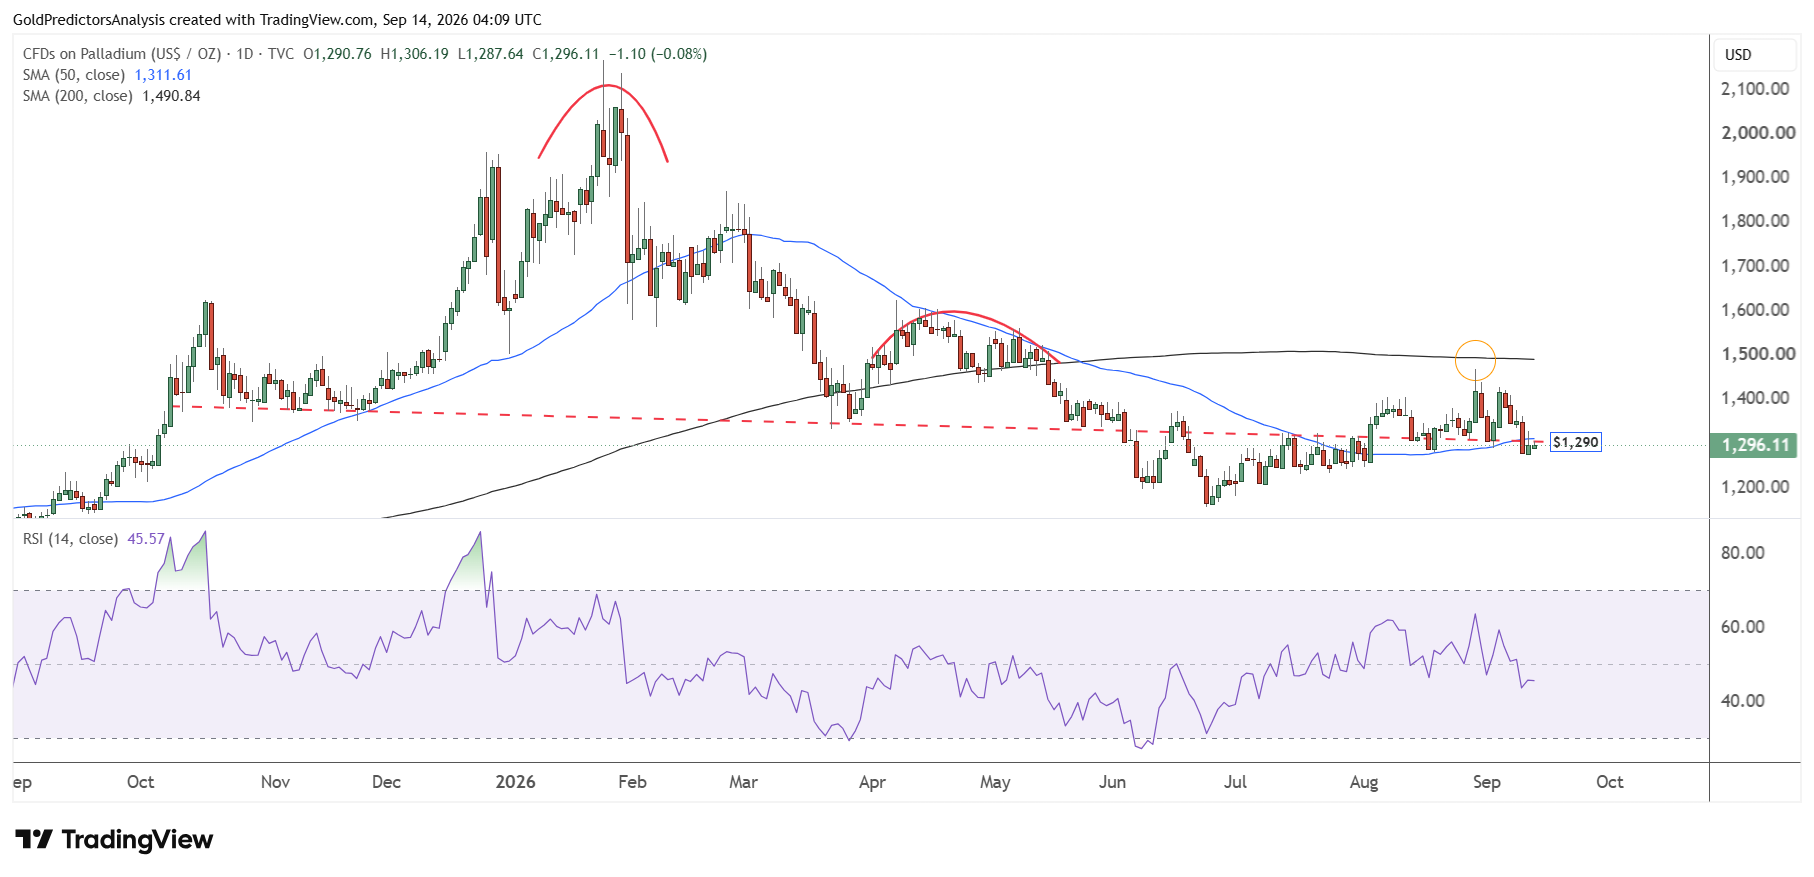
Palladium prices broke below the 50-day SMA last week and closed below the $1,290 support level. This indicates negative price action for palladium in the short term. The RSI also remains below the midline, which further strengthens the bearish case. If prices fail to recover above $1,400, palladium will likely drop toward the $1,200 region in the short term.
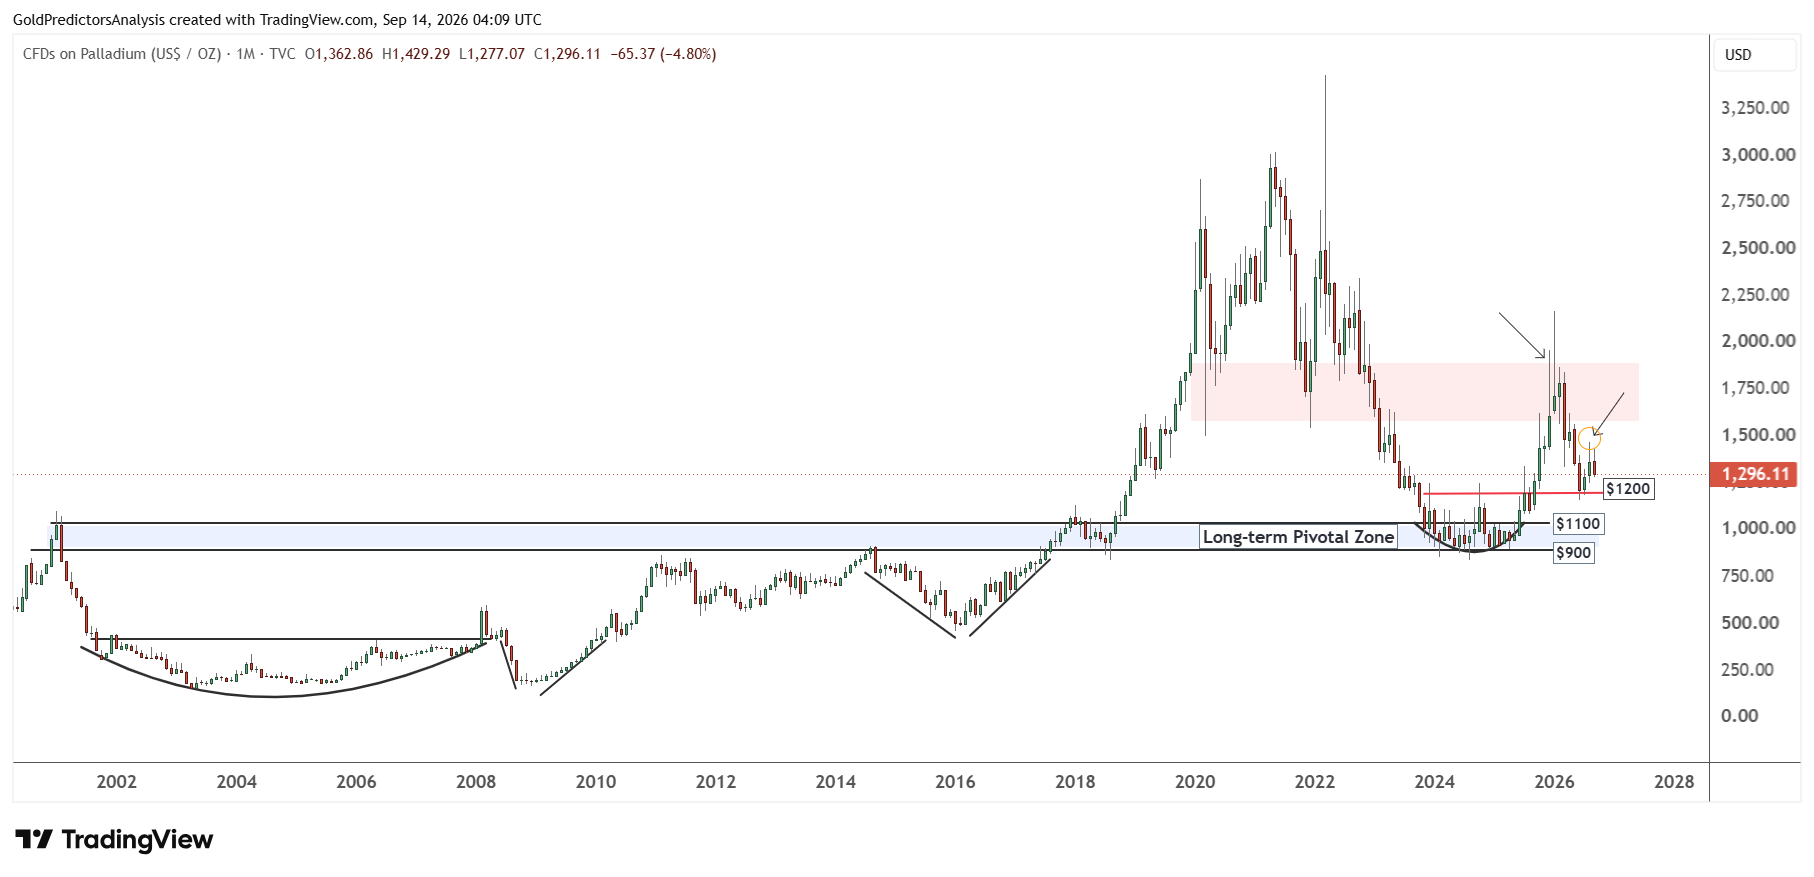
The monthly chart for palladium also shows the formation of sharp shadow on the monthly candle of August 2026. Prices then rebounded in early September but failed to break above the $1,500 area.
This increases the possibility of further downside toward $1,200. A break below $1,200 will likely push prices toward the $900-$1,100 region, which is a strong support in the long term. As long as palladium remains above $900, the chances of a bottom formation are higher. But a break above $1,500 is required to push palladium prices higher.
Platinum Performance Against Palladium, Silver and Gold
Platinum-to-Palladium Ratio Holds Above Parity
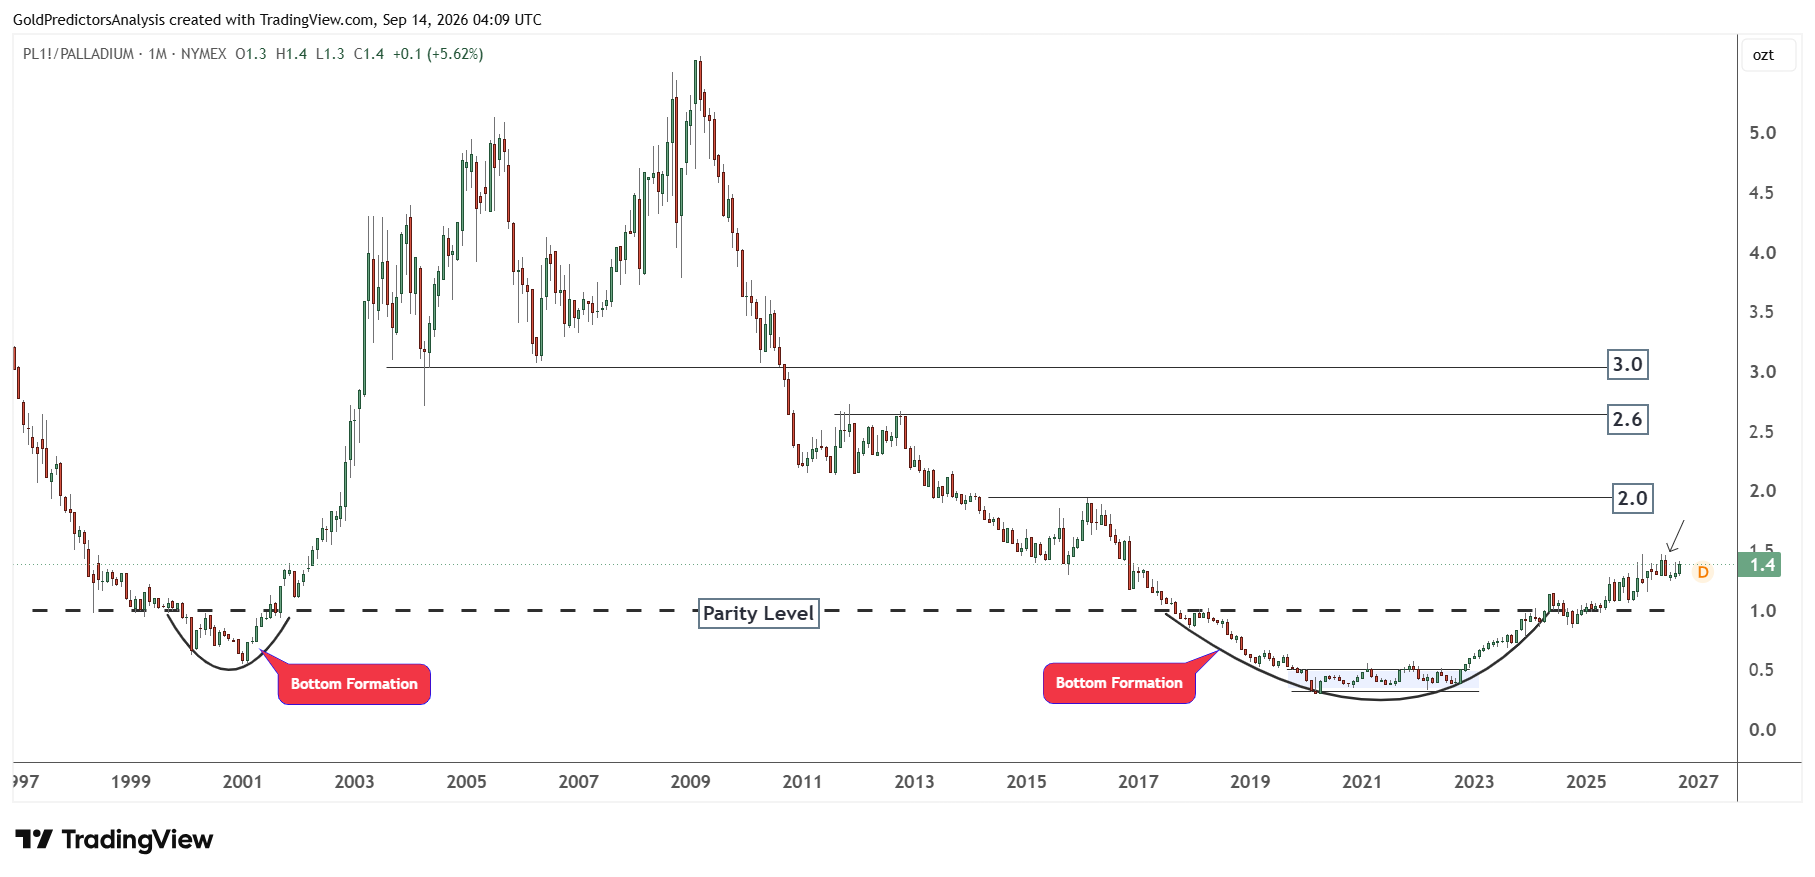
The chart below shows that platinum to palladium ratio trades near 1.4. This means platinum carries the premium of about 40% over palladium. The ratio moved above the 1.0 parity level after forming broad bottom between 2018 and 2023.
This confirms the stronger relative performance for platinum. The parity level now provides the main support in the long term. The next important resistance appears at 2.0, followed by 2.6 and 3.0.
The current premium could also encourage some automakers to consider switching back toward palladium but changes to catalyst designs take time. The rounded bottom shows similarities to the formation seen between 1999 and 2001. But this similarity does not guarantee the same large advance.
Platinum-to-Silver Ratio Tests the 29 Level
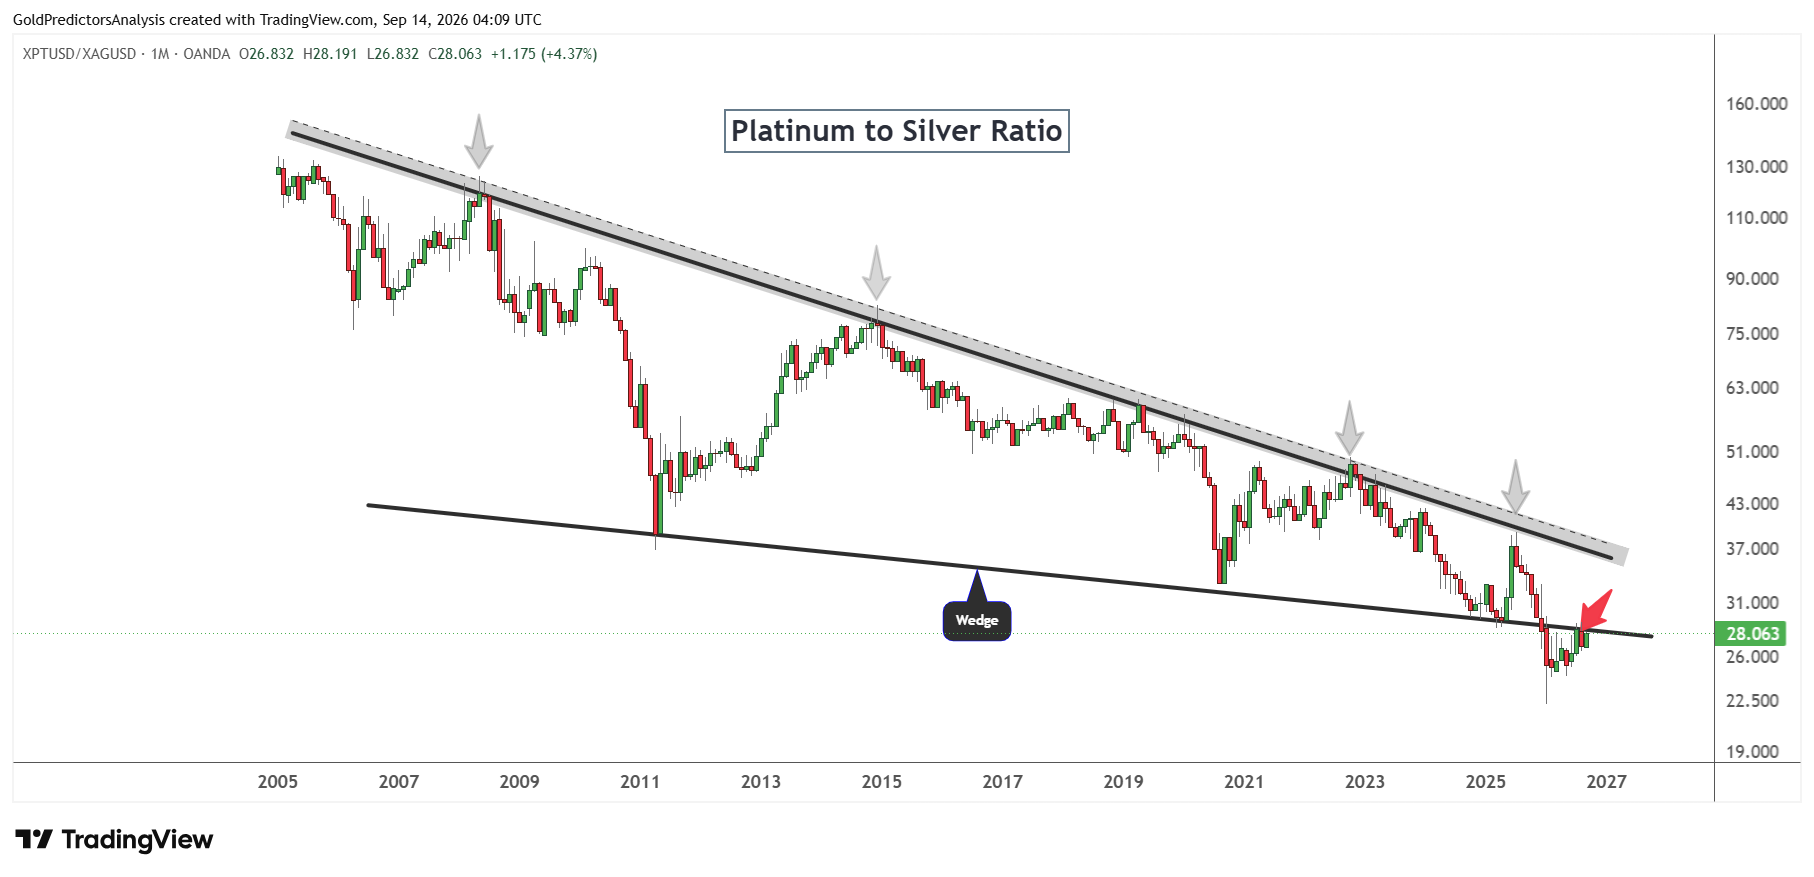
The chart below shows that the platinum to silver ratio has traded inside a long term descending wedge since 2005. The ratio recently dropped into mid-20s before rebounding to around 28.06. It is now testing the lower boundary of the wedge from below.
A sustained monthly close above 29, followed by a break above 31, would support the false breakdown scenario. It would also show that platinum has started to outperform silver.
But a rejection from the current area would keep silver in the stronger position. The ratio could then return toward 26 or the recent lows near 24-25. The market will wait for the September candle to confirm the recovery.
Platinum-to-Gold Ratio Challenges Long-Term Channel Resistance
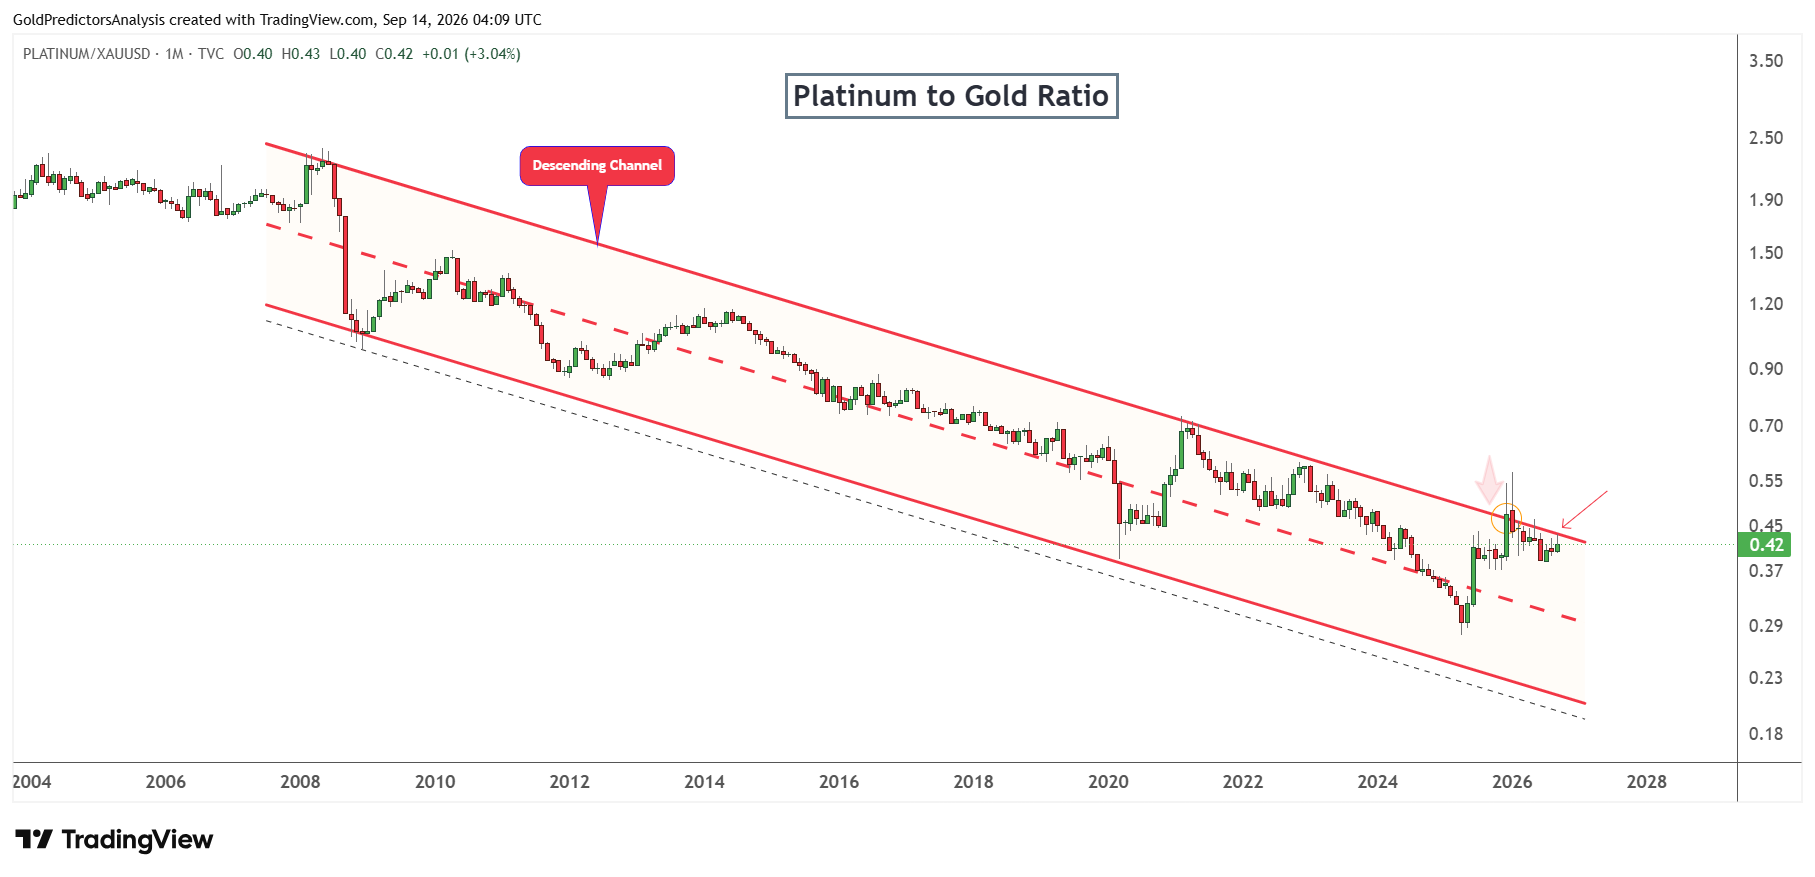
The chart below shows that the platinum to gold ratio trades near 0.42. This means platinum is worth about 42% of gold on this measure. The ratio remains inside the descending channel that has controlled relative performance since 2008. It is now testing the upper boundary of the channel near 0.43-0.45.
A confirmed monthly breakout above this area would mark an important change in the long-term trend. It could open the way toward the 0.55 region. But another rejection would keep gold in the stronger position. The first support would appear near 0.37, followed by the 2025 low around 0.29.
What to Watch Next In Platinum and Palladium
Platinum and palladium prices face a challenging situation in the short term. The surge in oil prices above $100 increases business costs and raises inflation concerns. This supports higher interest rates, Treasury yields and the U.S. dollar. These conditions reduce the demand for precious metals in the short term. In my view, platinum has the stronger outlook because investor positioning and the platinum to palladium ratio support this thesis. But the price of platinum must break above $1,900 to target the $2,200 level. A break below $1,700 could expose the support area of $1,350.
Palladium remains more vulnerable as it depends heavily on vehicle demand and short covering. The rising sales for hybrids offer some support but weaker vehicle demand in China and North America limits the upside. Palladium could fall toward $1,200 if it remains below $1,400. A break below $1,200 may expose the $900-$1,100 region. But a break above $1,500 would improve the outlook. Both metals need lower oil prices and softer rate expectations to begin the sustainable recovery.