


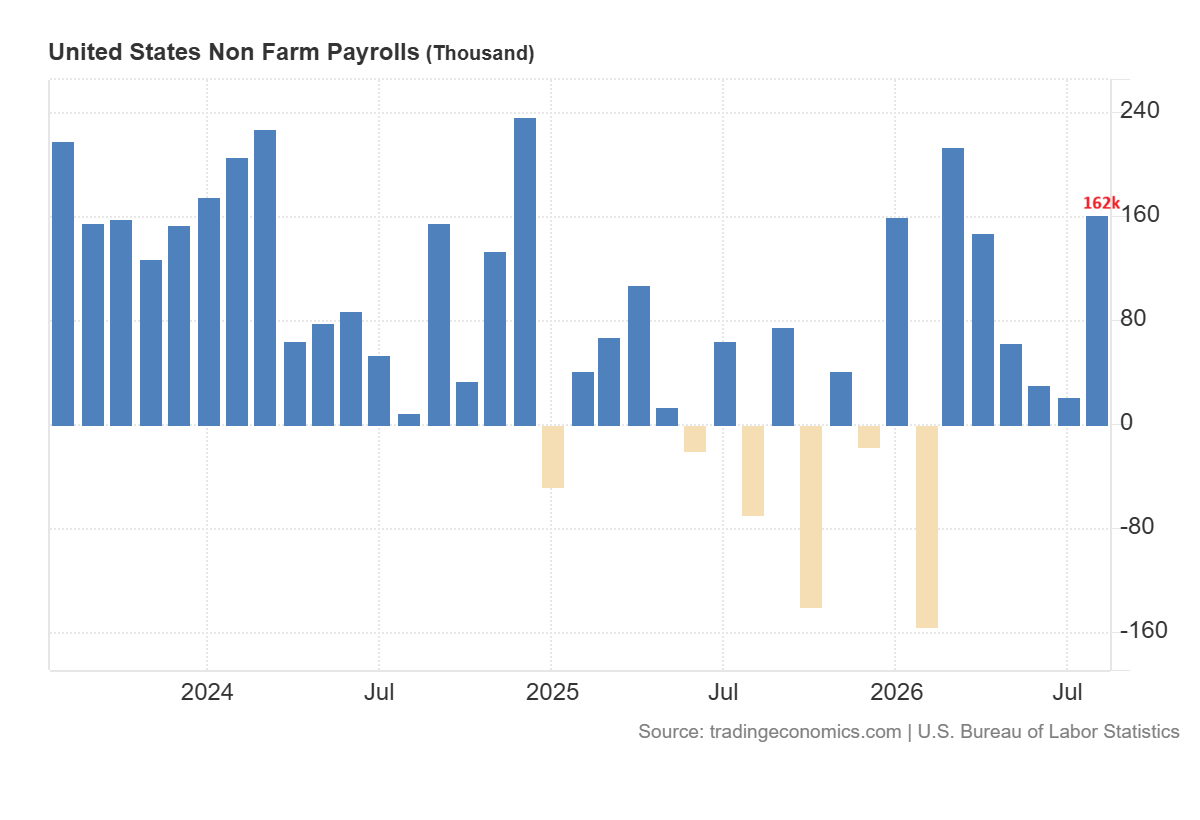
The outlook for US interest rates has turned more hawkish after the economy added 162,000 jobs in August. The strong jobs report pushed the 2-year Treasury yield as high as 4.41% and raised expectations of a September Fed rate hike. But the slower wage growth and a low quits rate give the Fed some room to wait, while loose financial conditions, rising fuel prices and strong nominal growth keep inflation risks elevated. In my view, the Fed may keep rates unchanged in September, but stronger CPI and PPI data may support a hike and could lift Treasury yields and the US dollar. This article presents the key labor, liquidity and growth signals that shape interest rates in US and examines the outlook for the US dollar index, EUR/USD, USD/JPY and USD/CHF.
US Jobs Report Raises September Fed Rate Hike Odds
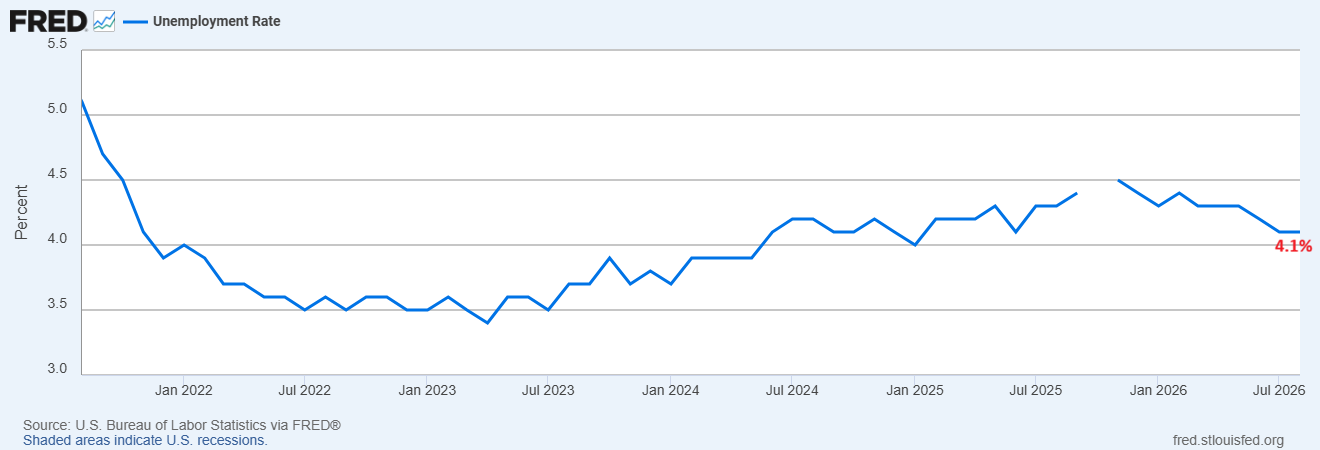
August payroll was much stronger than expected. But the household survey revealed that there was no change in the unemployment rate, which remained at 4.1%. This suggests that the economy continues to generate jobs without generating a new labour shortage. The strong job growth increases the risk of policy tightening.
US Labor Indicators Point to Continued Economic Growth
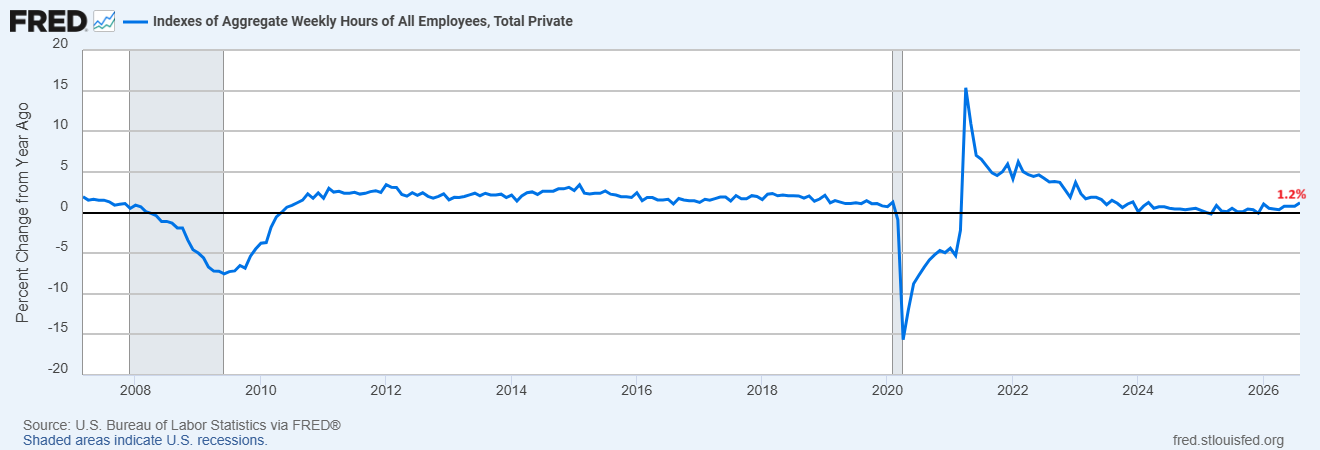
Other labor indicators also picked up. The number of hours worked per week rose to 34.4.
EUR/USD Price Forecast
Every new EUR/USD analysis as it publishes, today's technical signal and key levels, live price — on one page.
See all EUR/USD forecasts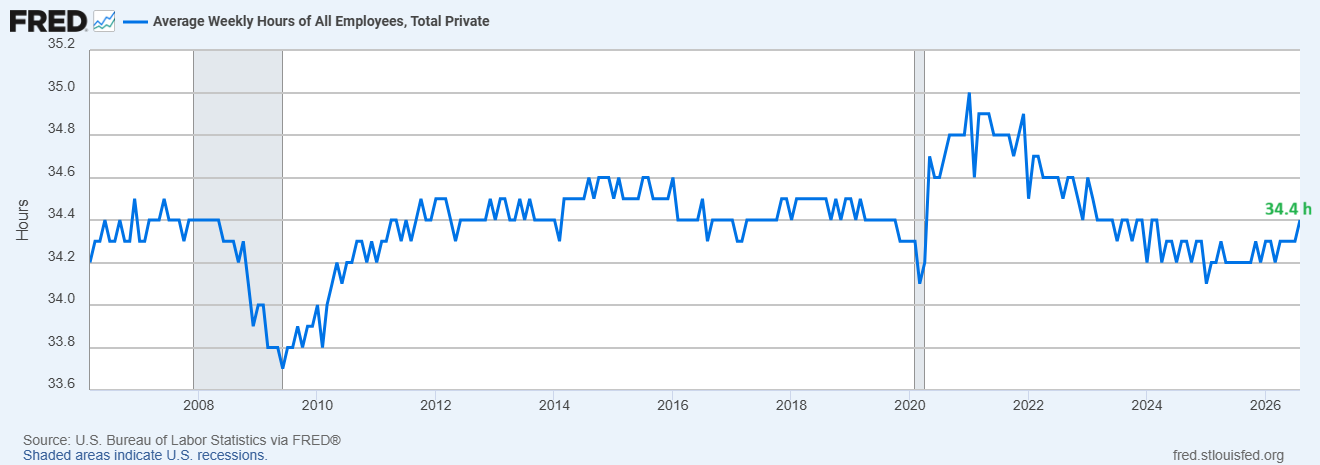
The index of aggregate weekly hours rose 1.2% from the previous year.
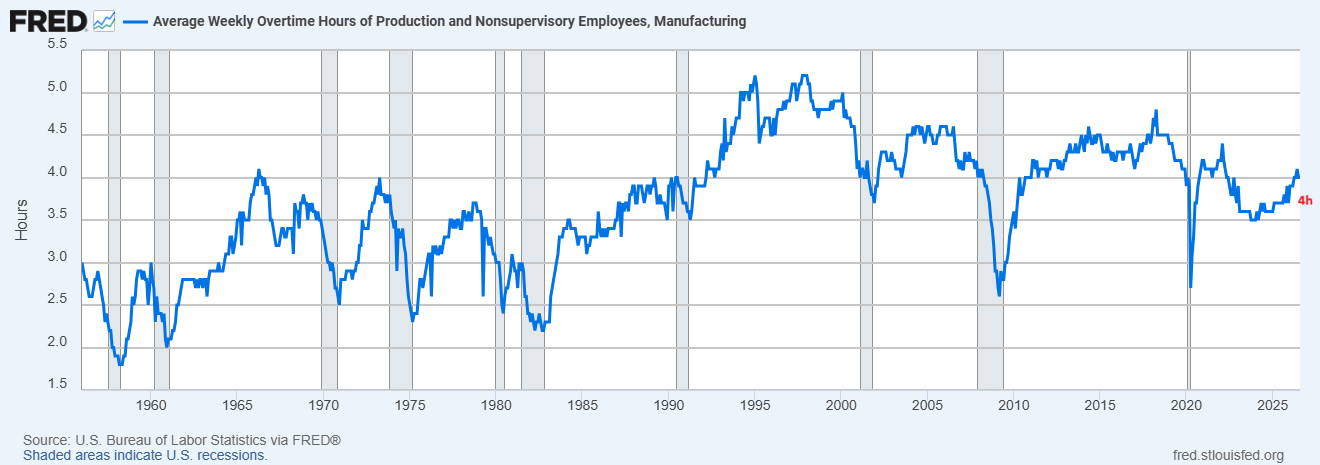
Manufacturing production and nonsupervisory workers also averaged 4.0 overtime hours per week.
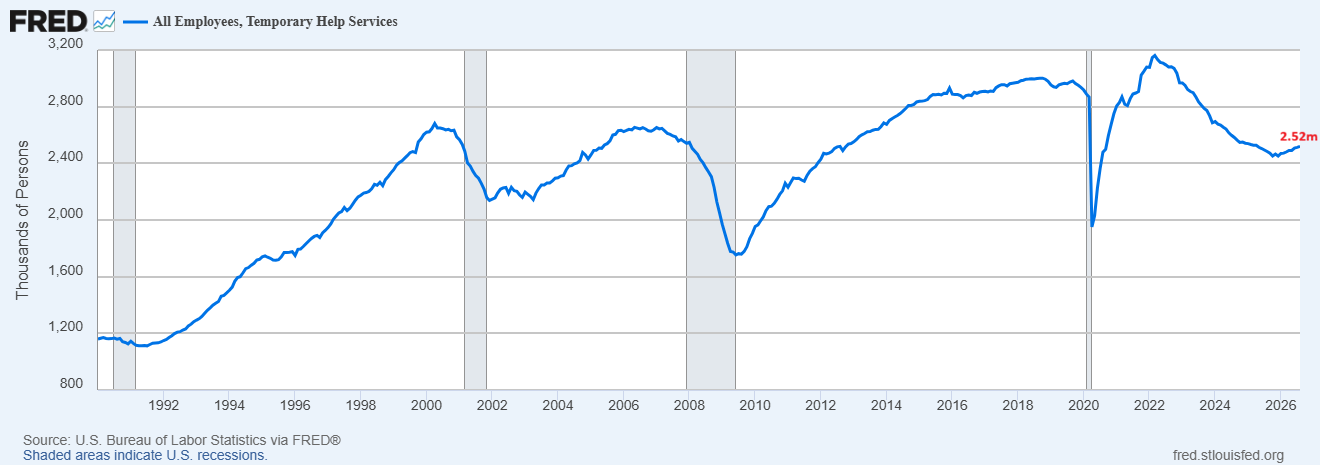
The chart below shows that temporary help employment rose to 2.52 million. Many businesses tend to hire temporary staff before permanent staff so the recent upturn indicates further growth.
Slower Wage Growth Gives the Fed Room to Wait
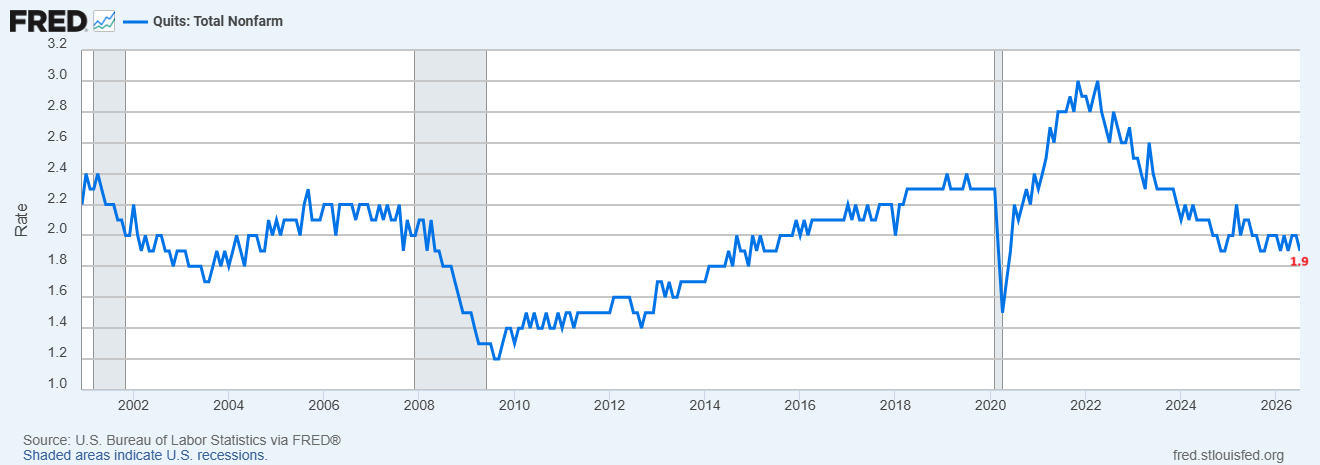
But the other indicators confirm that the labor market is not overheating across all measures. The chart below shows that the quits rate dropped to 1.9% in July. When people feel confident about future opportunities, they tend to quit their jobs.
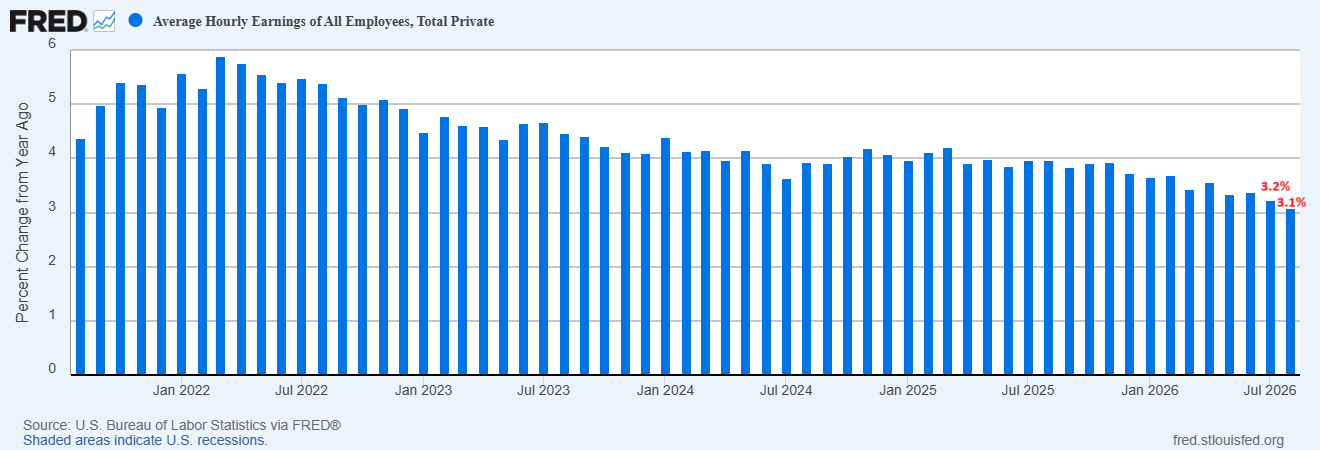
The chart below shows that the average hourly earnings increased by just 3.1% compared to 3.2% in July. These numbers provide the Fed with some room to wait. Chair Kevin Warsh thinks that the labor market is near full employment but has also shifted his focus to inflation. In my view, if the inflation data is stronger than expected, Fed may hike to 3.75% to 4%.
Loose Financial Conditions and US Debt Keep Treasury Yields Elevated
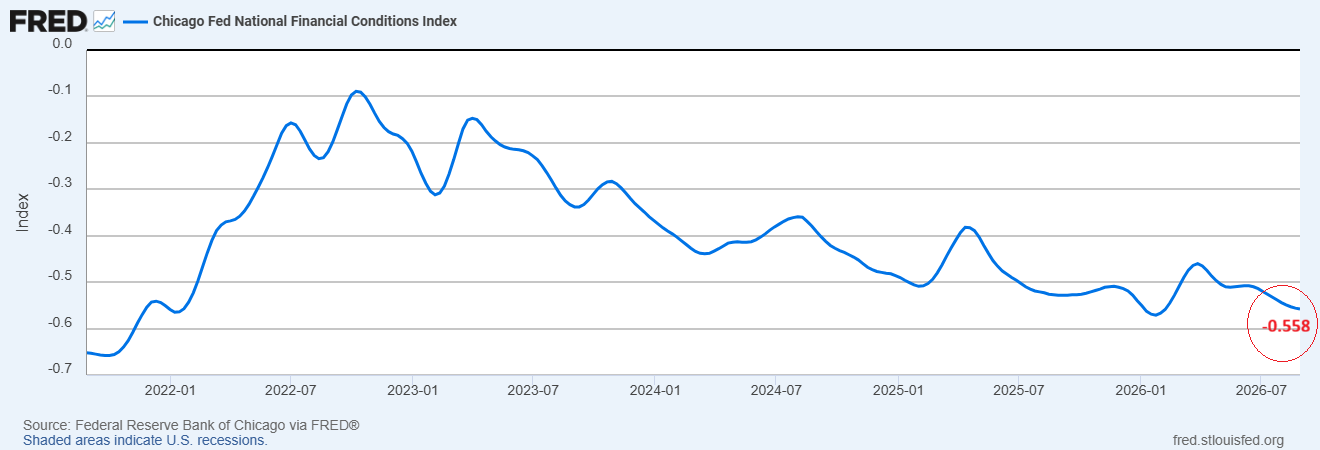
The financial conditions remain loose despite the elevated policy rate. The Chicago Fed National Financial Conditions Index also dropped to -0.558. The index also remains in a strong negative trend since 2023. The negative reading indicates that the financial conditions are looser than the historical average.
Bank Reserves and the Fed Balance Sheet Support Market Liquidity
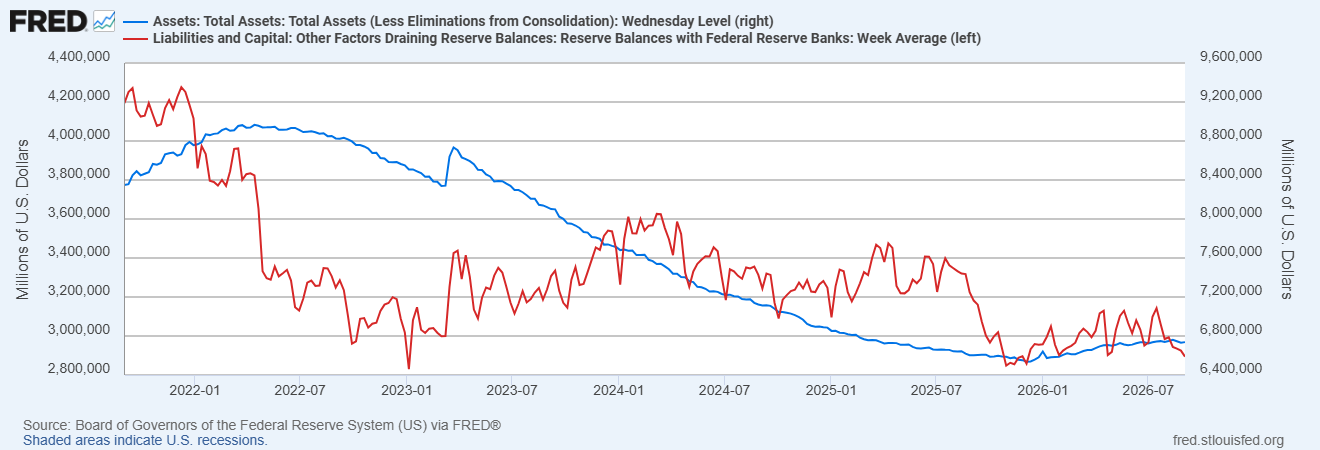
This liquidity is still providing support to stocks and credit markets. The commercial bank reserve balances at the Fed have fallen to about $2.895 trillion but remain considerable. Warsh would like to further reduce the Fed’s balance sheet. But the September 2019 repo turmoil shows that removing reserves too quickly can destabilize the short term funding markets.
Strong Nominal GDP Growth Adds to Inflation Risk
The other problem for interest rates is fiscal policy. Treasury Secretary Scott Bessent said that stronger growth will help the US to manage the debt burden of over $40 trillion. He also mentioned that the productivity from AI could support faster economic growth without increasing the inflation.
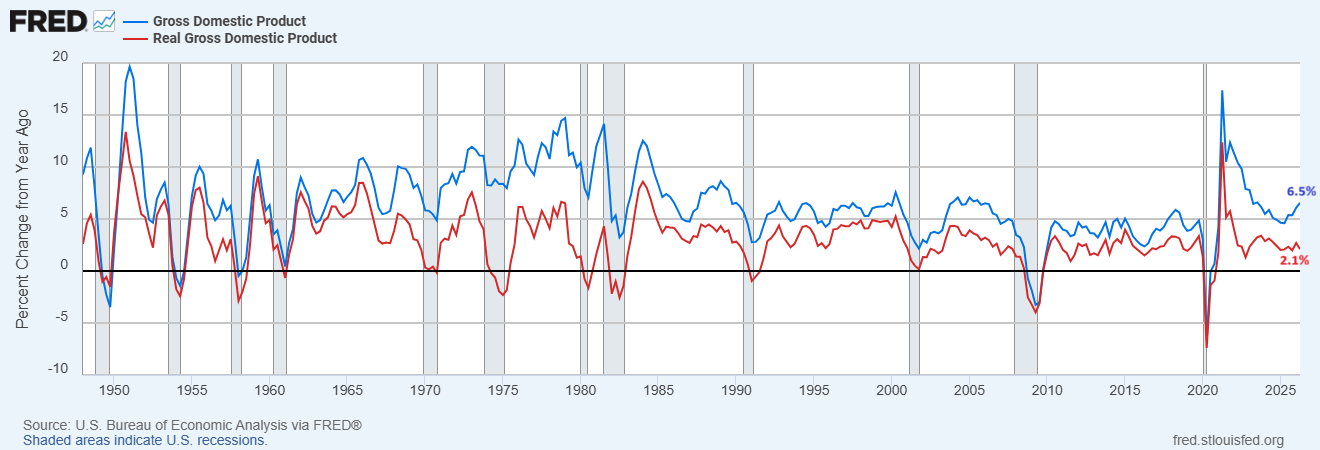
The chart below shows that the GDP grew 6.5% in Q2 while real GDP grew by 2.1%. This wide gap between the nominal GDP and real GDP indicates that higher prices contributed significantly to the nominal growth. The GDPNow model from the Atlanta Fed now forecasts the real growth of 4.7% for Q3. The strong nominal growth can support tax revenues but can also keep inflation and bond yields high.
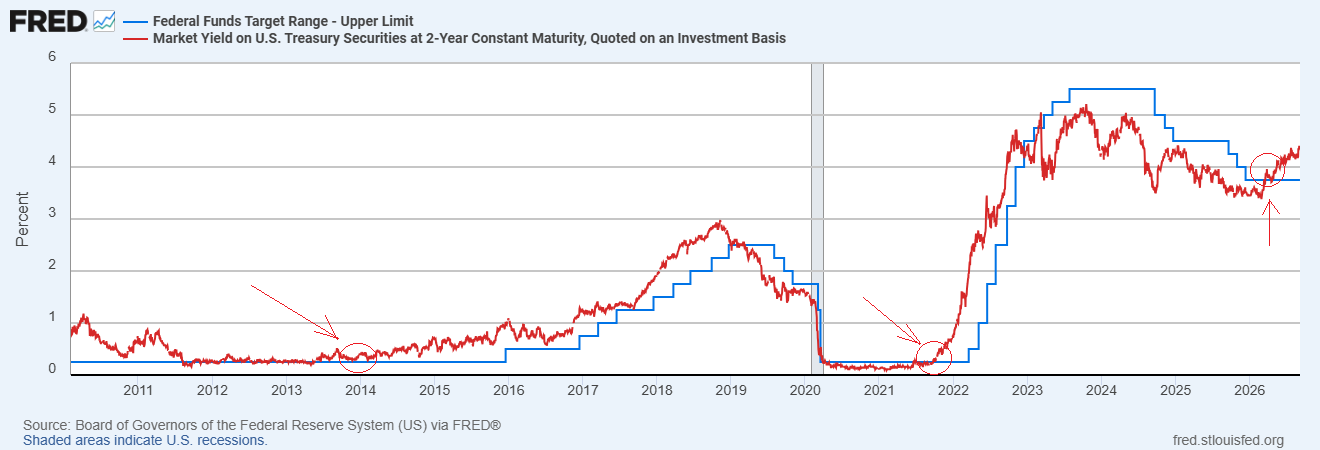
The 10-year Treasury yield is still near 4.8%. If the Fed holds the interest rate at current levels in September while growth and inflation are still high, it could surge over 5%. It is clear from the chart analysis that the Fed interest rates starts to increase after the few months of positive momentum in the 2-year Treasury yields.
The chart shows that the positive momentum in 2-year Treasury yields started in early 2014 but the rate hike was in December 2015. Similarly, the positive momentum in 20-year Treasury yields started in October 2021, and the Fed hiked interest rates in March 2022. Now, US Treasury yields are again uncontrollable, which points to Fed rate hikes soon.
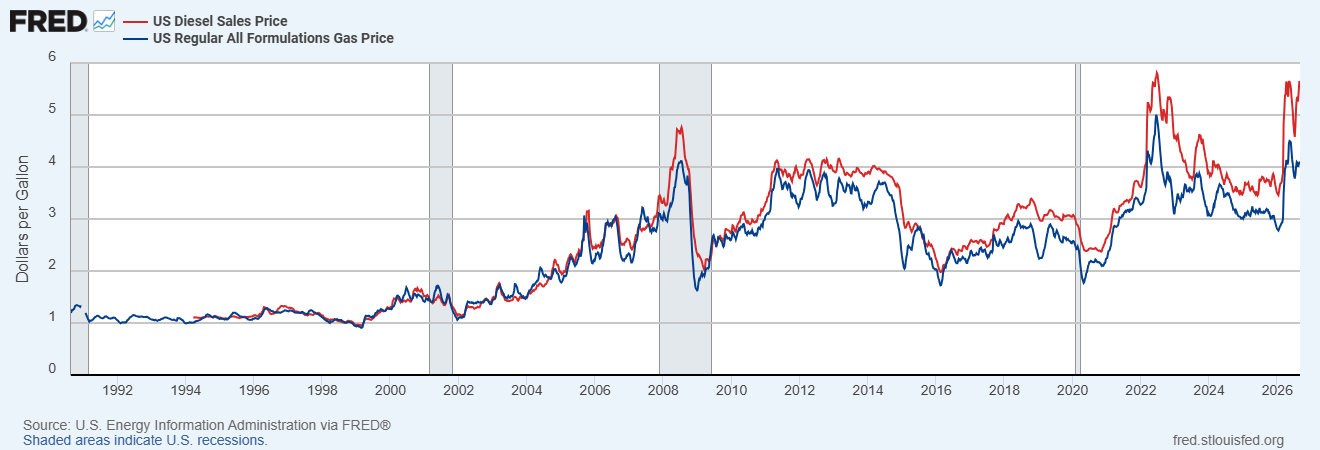
The chart below shows that fuel and gas prices have surged dramatically after US-Iran war. The higher prices continue to increase risk. The average price for regular gas is nearly $4 a gallon and the average price for diesel is around $5.60. These prices could reduce consumer activity but may also keep headline inflation at higher levels.
How the Fed Rate Decision Could Affect the US Dollar Index
The higher US Treasury yields and growing expectations of US interest rates may keep the US dollar higher. The dollar may strengthen further if the US CPI and PPI data come in stronger than expected and increase expectations of a Fed rate hike. A shift in the 10-year yield over 5% could limit the downward trend, as it draws capital into the US asset class. Softening inflation, a slowdown in growth and a definite decline in Treasury yields would be needed to bring a more sustained dollar reversal.
US interest-rate expectations will remain the main driver of EUR/USD, USD/CHF and USD/JPY. A hawkish Fed decision and rising Treasury yields would normally support the dollar. This could pressure EUR/USD while lifting USD/CHF and USD/JPY. However, safe-haven flows may strengthen the Swiss franc or Japanese yen during periods of market stress.
US Dollar Index Forecast: Fed Rate Hike Bets Challenge the Bearish DXY Outlook
The weekly chart for the U.S. dollar index shows strong consolidation between the 99.70 and 98.70 levels. A break of either level will define the next move in the short term. But the key reversal from the 101.80 level in June 2026 indicates a slightly bearish bias in the short term.
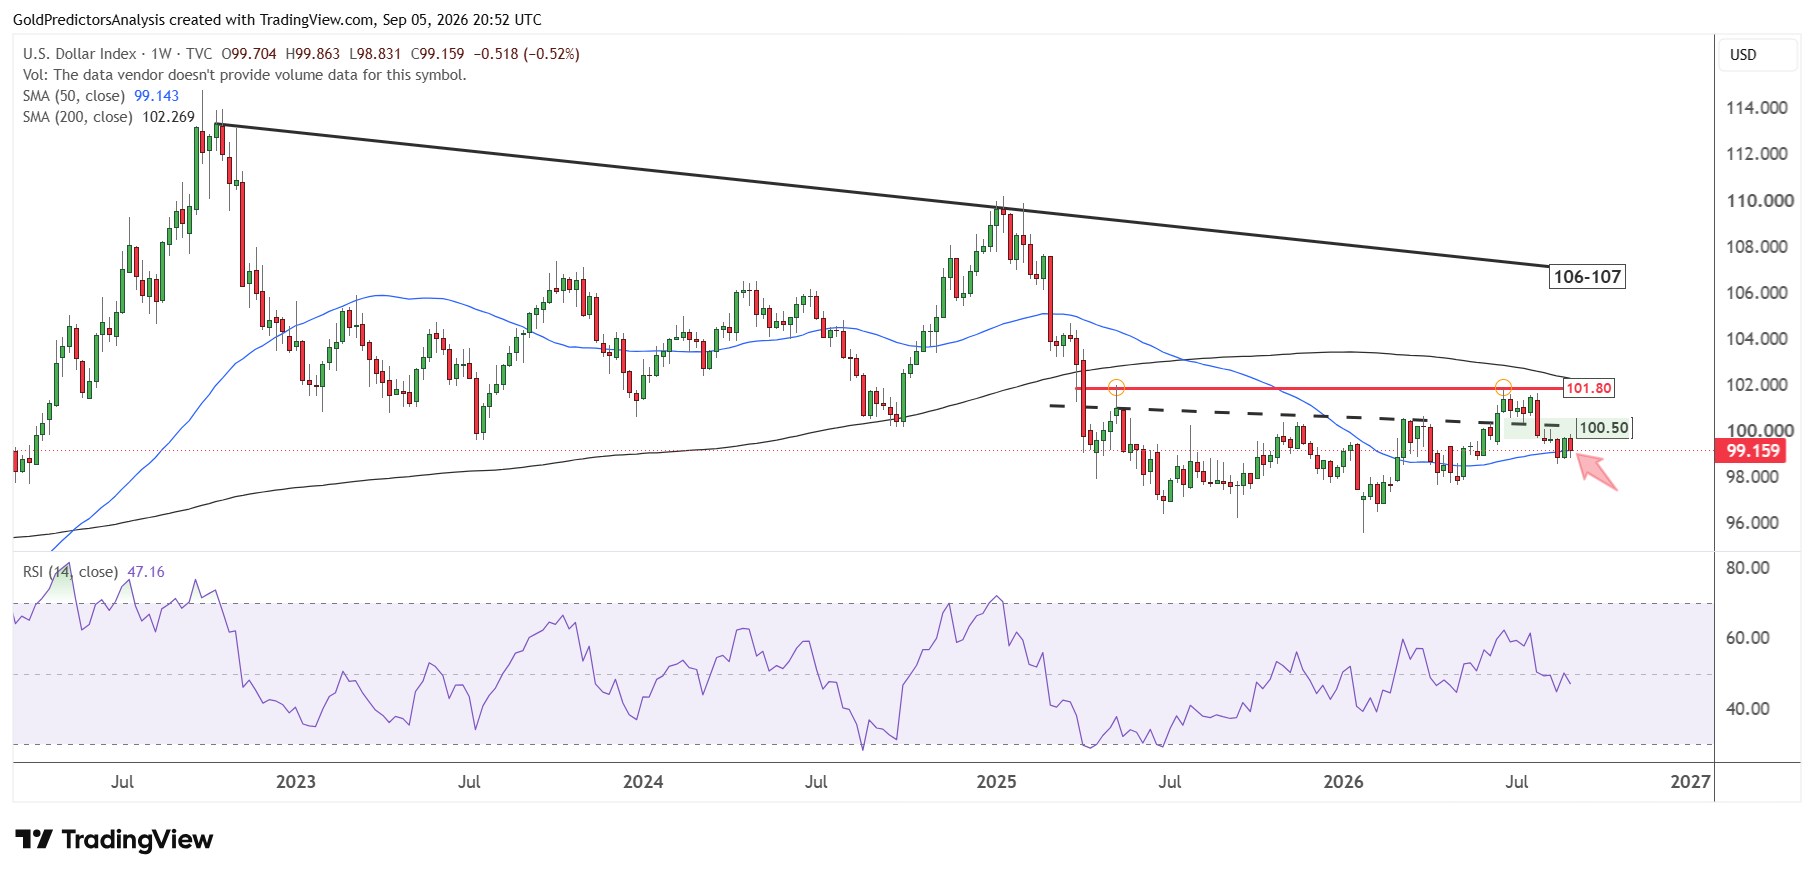
The long-term support between the 96 and 97 levels will be the key area for defining the next move. A break below the 96 level will open the way for a strong drop toward the 90 area in the U.S. dollar index. But the U.S. rate hike expectations are keeping the outlook for the U.S. dollar index bullish. A break above 101.80 is required to push the U.S. dollar index toward the 106 to 107 level. The short term outlook remains bearish as the RSI is still below the midline and the index is hovering around the 50-week SMA.
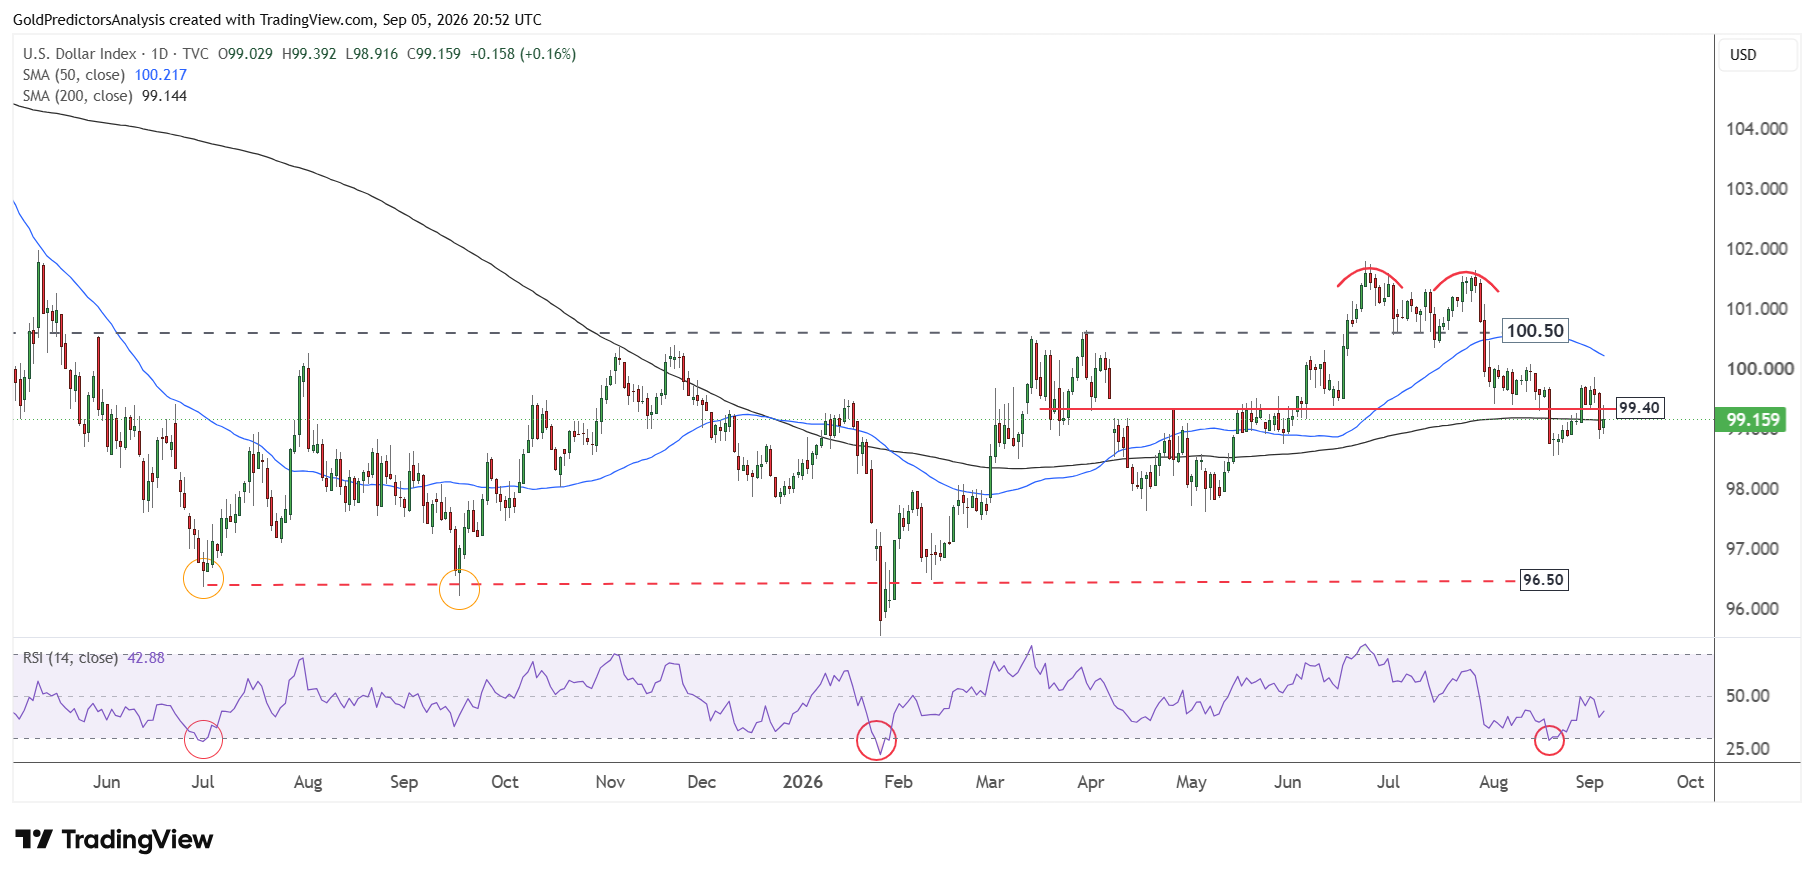
This bearish outlook is also observed on the daily chart. The chart shows the formation of double top pattern at 101.80 in June 2026. The index has already failed at the 100.50 level and continues to trade around the 200-day SMA. A break below 98.60 next week will likely open the way for a drop toward 97.80 in the short term. But a break below 97.80 will push the index toward 96.50.
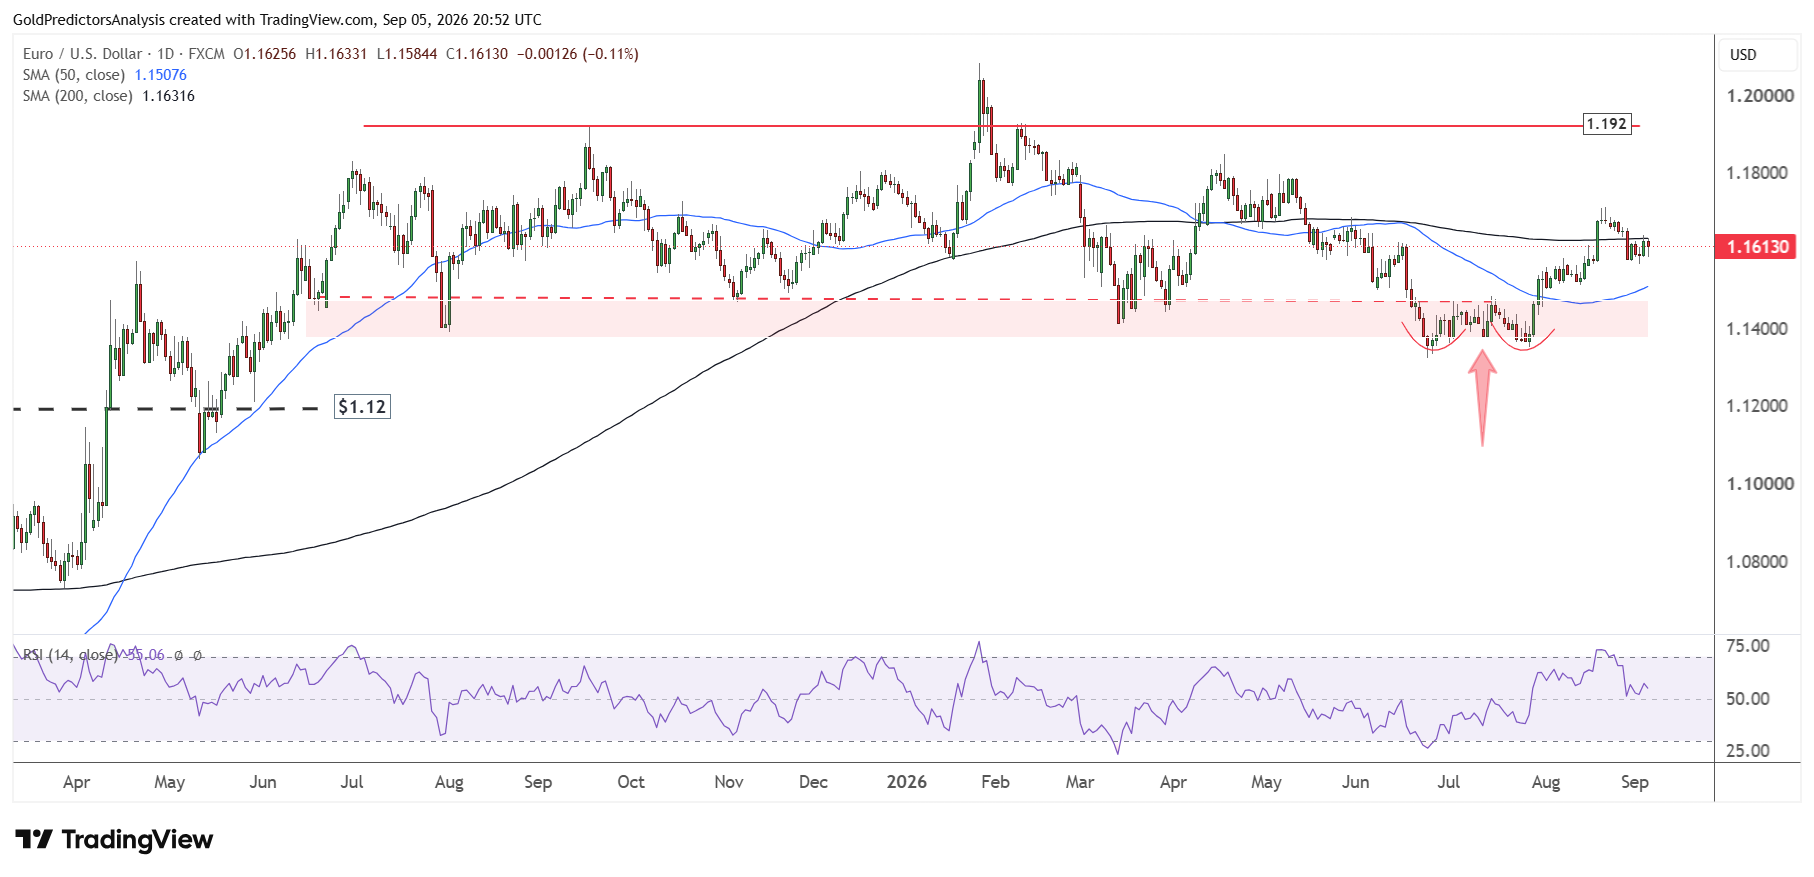
EUR/USD Forecast: Break Above 1.17 Targets 1.1920
The failure of the U.S. dollar index at the resistance of 101.80 has produced a double bottom pattern in EUR/USD at the 1.1350 support zone. The rebound after the double bottom pattern has pushed the pair above the 50-day SMA. The pair is now hovering around the 50-day SMA and looking for the next direction.
A break above 1.17 will likely push EUR/USD toward the 1.1920 level. But a break below the 1.1515 level will open the way for a further drop toward the 1.1380 level. Overall, the pair is consolidating between the 1.1380 and 1.1920 levels and looking for its next direction. However, the RSI remains above the midline, which points to a positive outlook in the short term.
USD/JPY Forecast: Yen Strength Brings 149-150 Support Into Focus
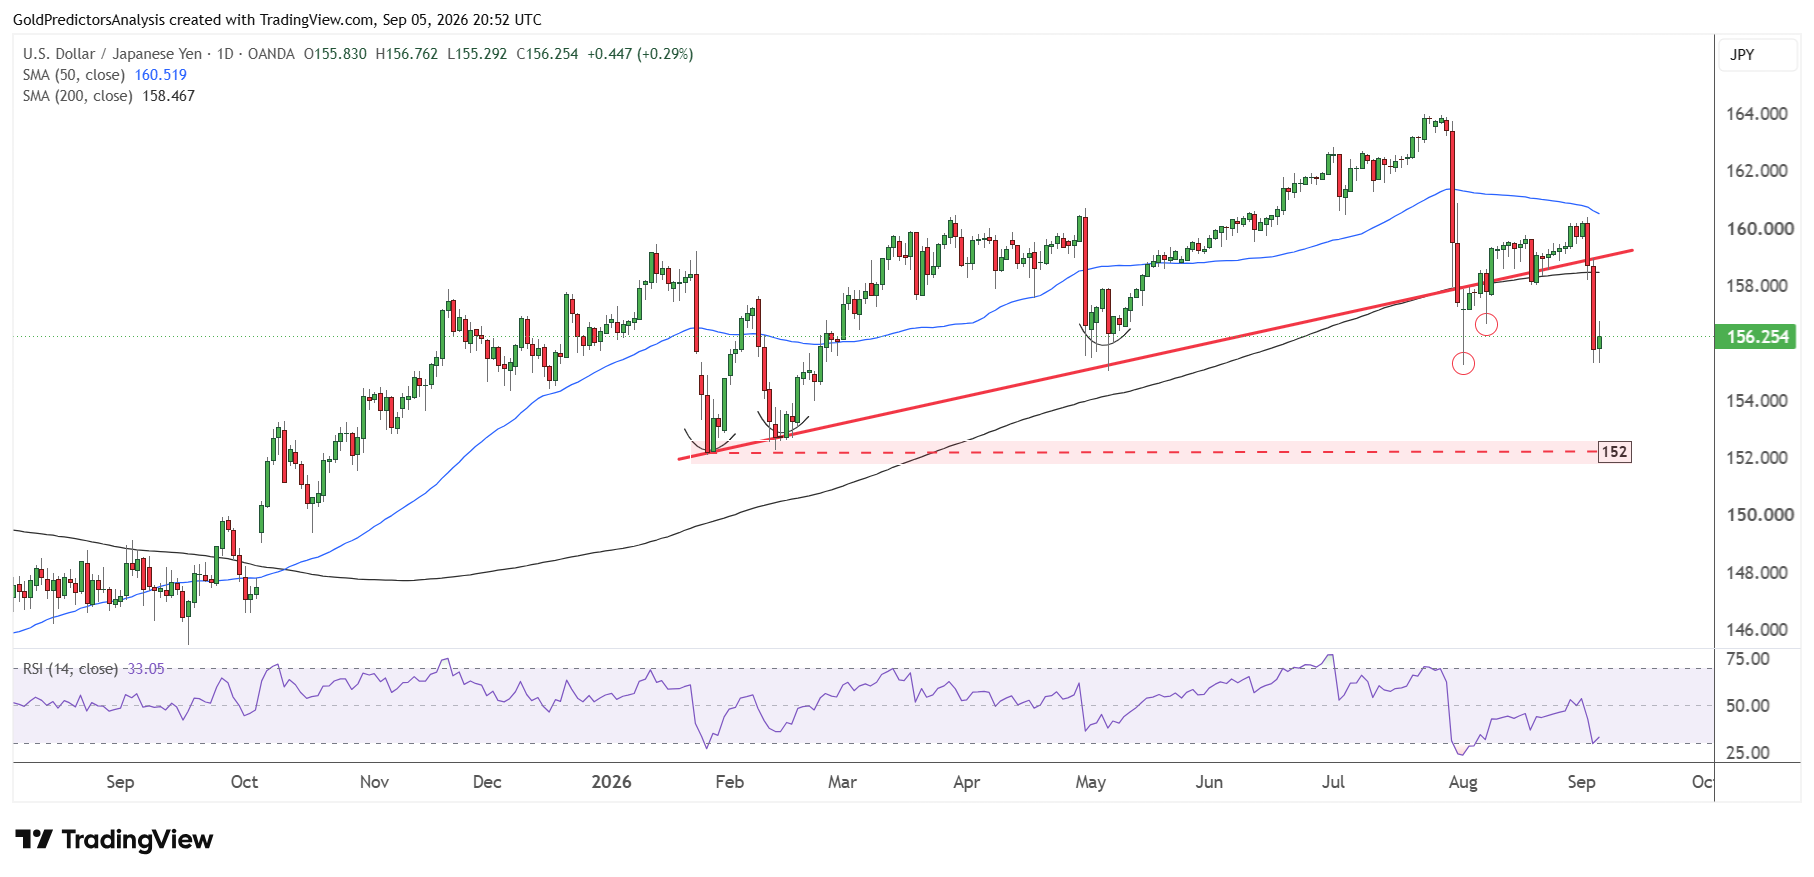
The strength in the Japanese yen has pushed USD/JPY below the ascending trend line that stretches from the low of January 2026. The pair has also broken below the 200-day SMA, which indicates a slightly bearish bias in the short term. The pair is now moving toward 152 as the initial target in the short term.
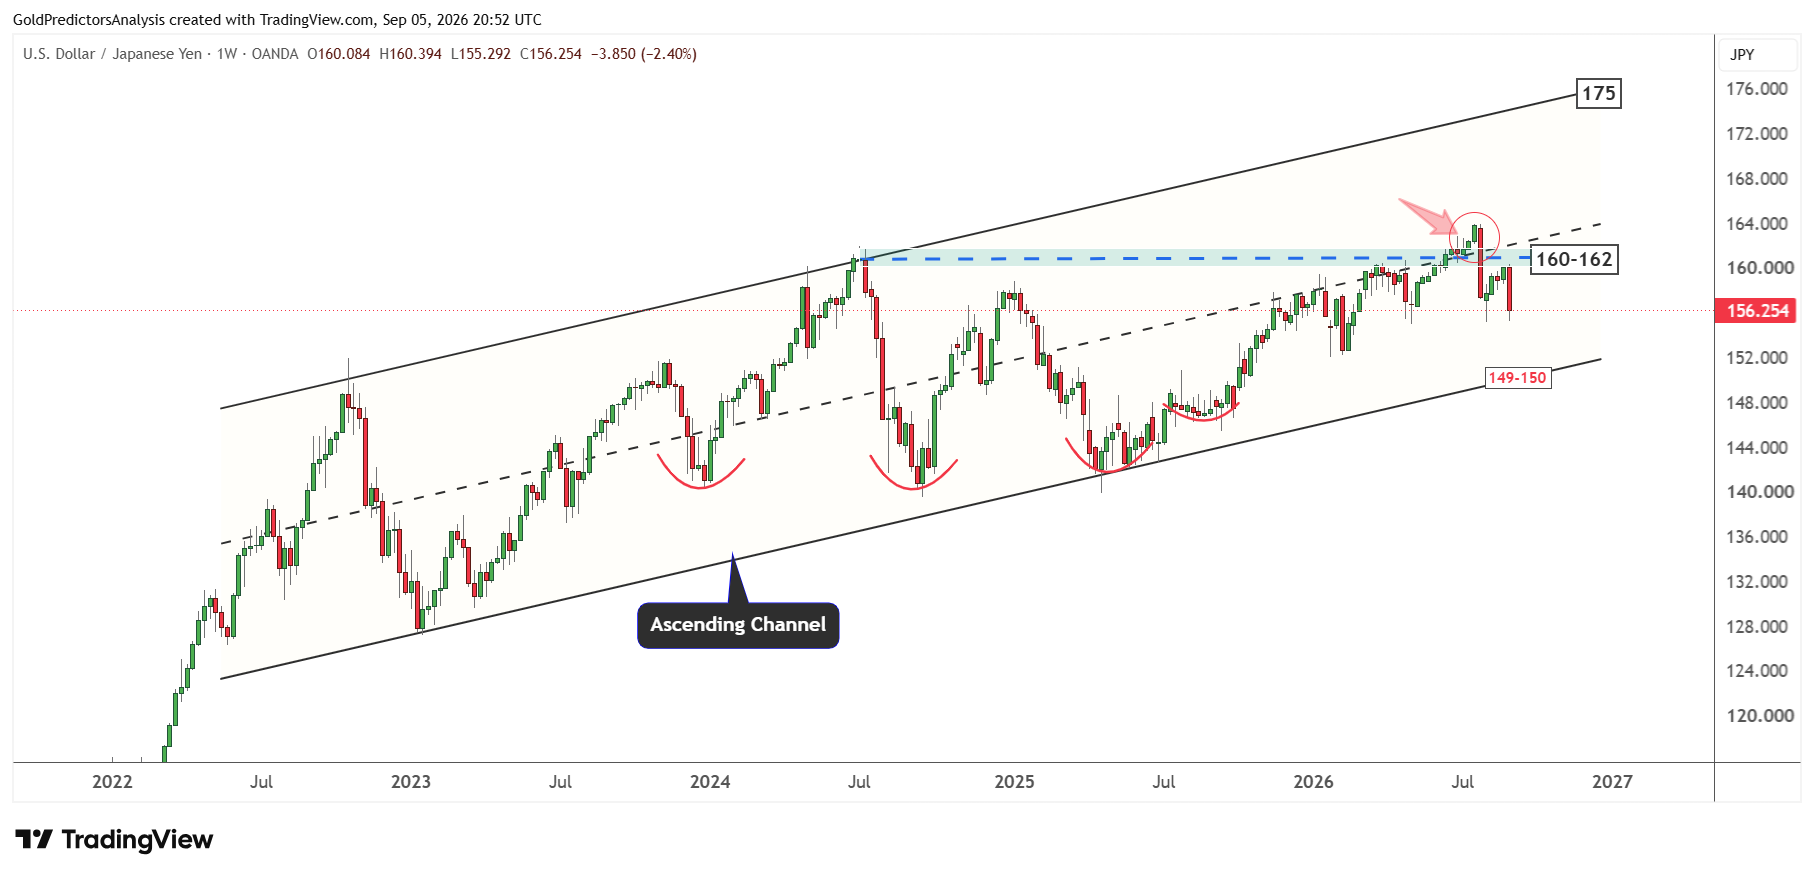
The weekly chart for USD/JPY shows clear failure at the resistance zone of 160 to 162. The failure at this resistance has opened the way for a drop toward the long term support area between 149 and 150. But the support region between 152 and 153 will likely define the next move in the short term. A break below the 152 level will open the way for a drop toward the long term support area between 149 and 150.
USD/CHF Forecast: Rebound Targets 0.83-0.84 Resistance
The strength in the U.S. dollar index has also formed a bottom pattern in USD/CHF at the long-term support level of 0.76. This long-term support is defined by the descending trend line that stretches from the July 2023 lows. The pair has formed a strong rounding bottom structure around this support and is now consolidating around 0.80.
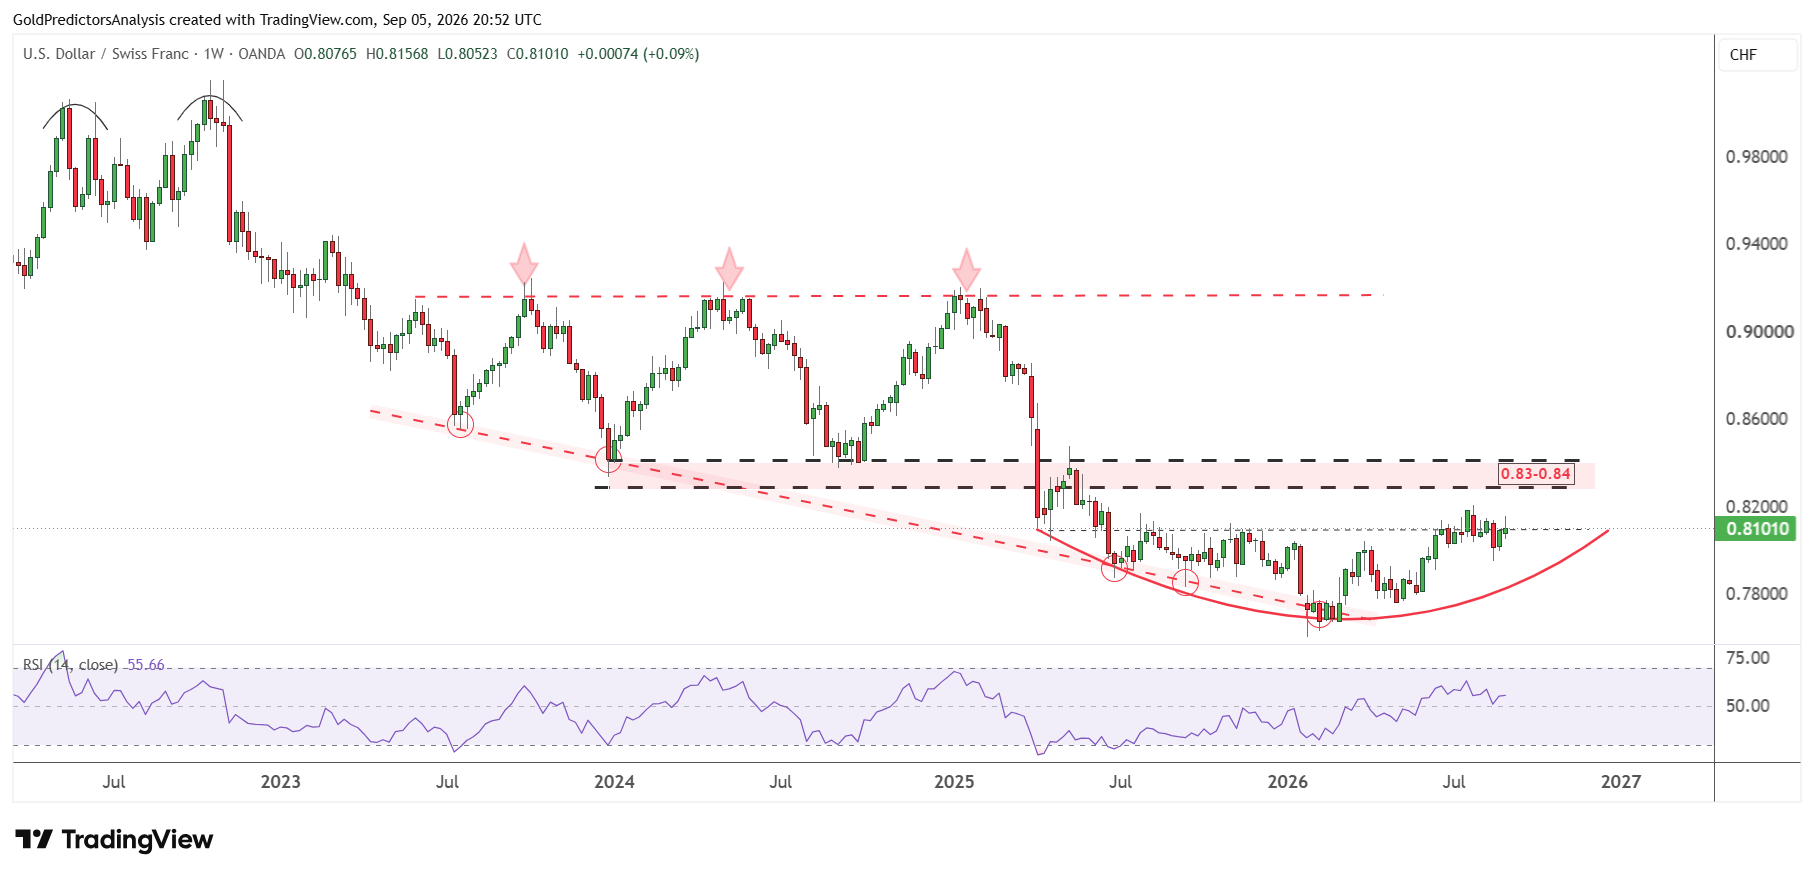
A break above 0.82 will likely push the pair toward the 0.83 to 0.84 area, which is defined as a strong pivotal point for USD/CHF in the long term. The pair still remains in negative trend as long as it remains below the 0.84 level due to the strength of the Swiss franc. But the RSI remains above the midline, which points to a positive outlook toward the 0.83 to 0.84 area. If the Fed continues to hike interest rates, USD/CHF will likely continue higher toward the long-term pivotal zone of 0.83-0.84. But the pair may continue to drop after this rally to resume its negative trend in the long term.
The Bottom Line
The outlook for the US interest rate remains uncertain before the September Fed meeting. The strong job growth, longer working hours, loose financial conditions and rising fuel prices keep the case for a hike alive. But slower wage growth and the low quits rate give the Fed room to wait. The upcoming CPI and PPI reports will likely decide the outcome. In my view, the Fed will keep rates unchanged unless these reports show stronger inflation. The strong inflation data could support the 25 basis point hike and push the 10-year Treasury yield above 5%. But softer inflation would strengthen the case for keeping rates unchanged.
The US dollar may remain volatile until the Fed provides clear policy signal. US dollar index shows a bearish bias in the short term below 101.80. A break below 98.60 could expose 97.80 and 96.50. This weakness supports the recovery in EUR/USD and increases the downside risk for USD/JPY. USD/CHF may still rebound toward 0.83-0.84, but the long term outlook remains negative below 0.84. A clear break of these levels will confirm the next direction for forex pairs.
Read more: Jobs and CPI to Drive US Dollar and EUR/USD