


Holding Key Support
Natural gas held above support of the 50-day moving average for the third consecutive day on Friday, as it consolidated inside Thursday’s wide range. The ability to hold above the average is a sign of strength and supports the potential for an upside continuation, particularly because the 50-day moving average had recently represented resistance after natural gas fell below it in early July. In addition, Wednesday’s advance closed above the July lower swing high of $2.99, confirming a bullish reversal from last week of the prior decline and strengthening the developing bullish structure.
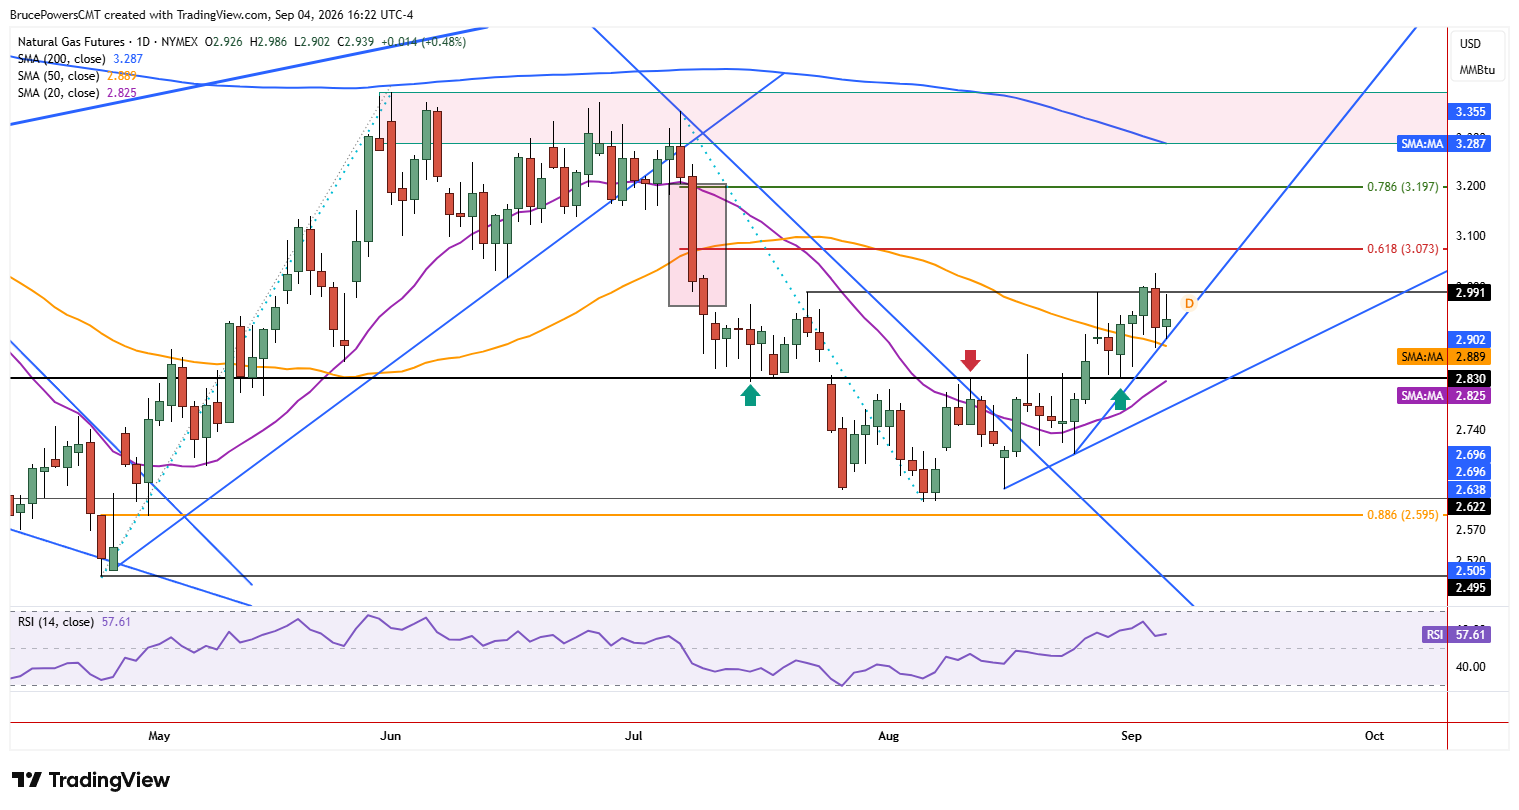
If natural gas can remain above the 50-day moving average, now near $2.89, it will retain an upside bias following last week’s bullish reversal signal from a consolidation bottom. Meanwhile, Thursday’s low established a higher swing low at $2.88, creating near-term structural support. If support at $2.88 fails to hold, the recent support area near $2.83 may be tested. In addition, the rising 20-day moving average represents potential dynamic support for the developing advance. It is currently near $2.83 and is rising toward that support area, which could soon provide a higher level of dynamic support.
Breakout Above $3 Comes Into Focus
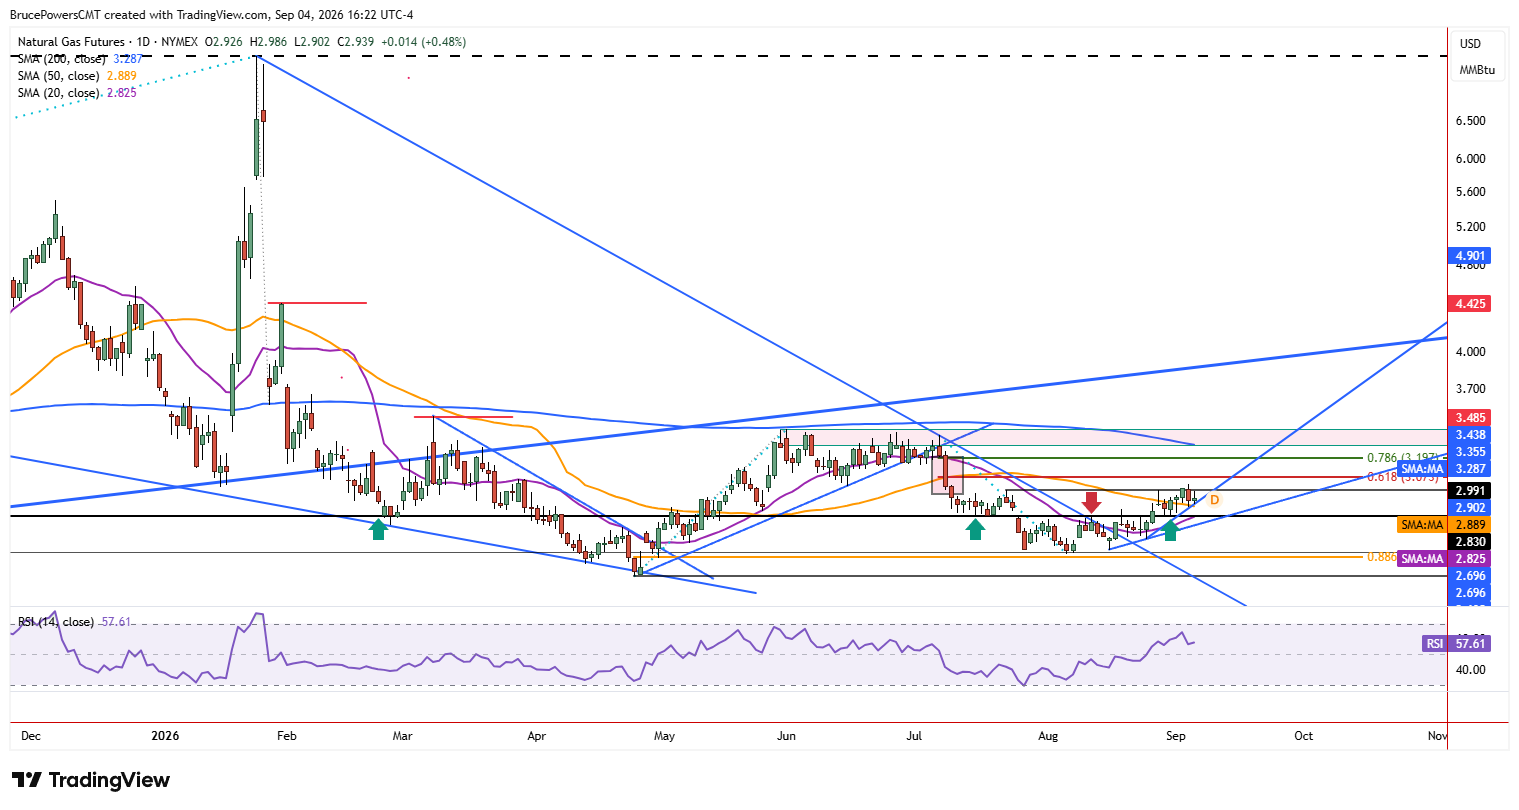
An upside breakout above Friday’s high of $2.99 would provide the next bullish signal, but it should be accompanied by strong momentum to increase the chance of a move above this week’s high of $3.03. Otherwise, further consolidation above the 50-day moving average may follow. A decisive breakout would therefore provide an important test of whether the recent reversal can develop into a sustained advance.
Fibonacci Targets Point Higher
The next upside target is defined by the 61.8% Fibonacci retracement of the prior decline at $3.07. However, since that target is relatively close to this week’s high, a breakout above $3.03 could quickly bring the next higher target into focus: the 78.6% Fibonacci retracement at $3.20. That level becomes more significant if natural gas first clears the July lower swing high and confirms another bullish continuation signal.
$3.20 Meets Falling Resistance
Above these levels, the falling 200-day moving average provides another potential upside target. It was recognized as resistance during the prior advance, and as it continues to fall, it is moving closer to the 78.6% retracement zone. This convergence increases the potential for the $3.20 area to eventually be tested, giving the bullish reversal that began with the consolidation bottom a clearly defined path toward higher resistance.
If you’d like to know more about how to trade natural gas, please visit our educational area.