


Higher Swing Low Reinforces Bullish Structure
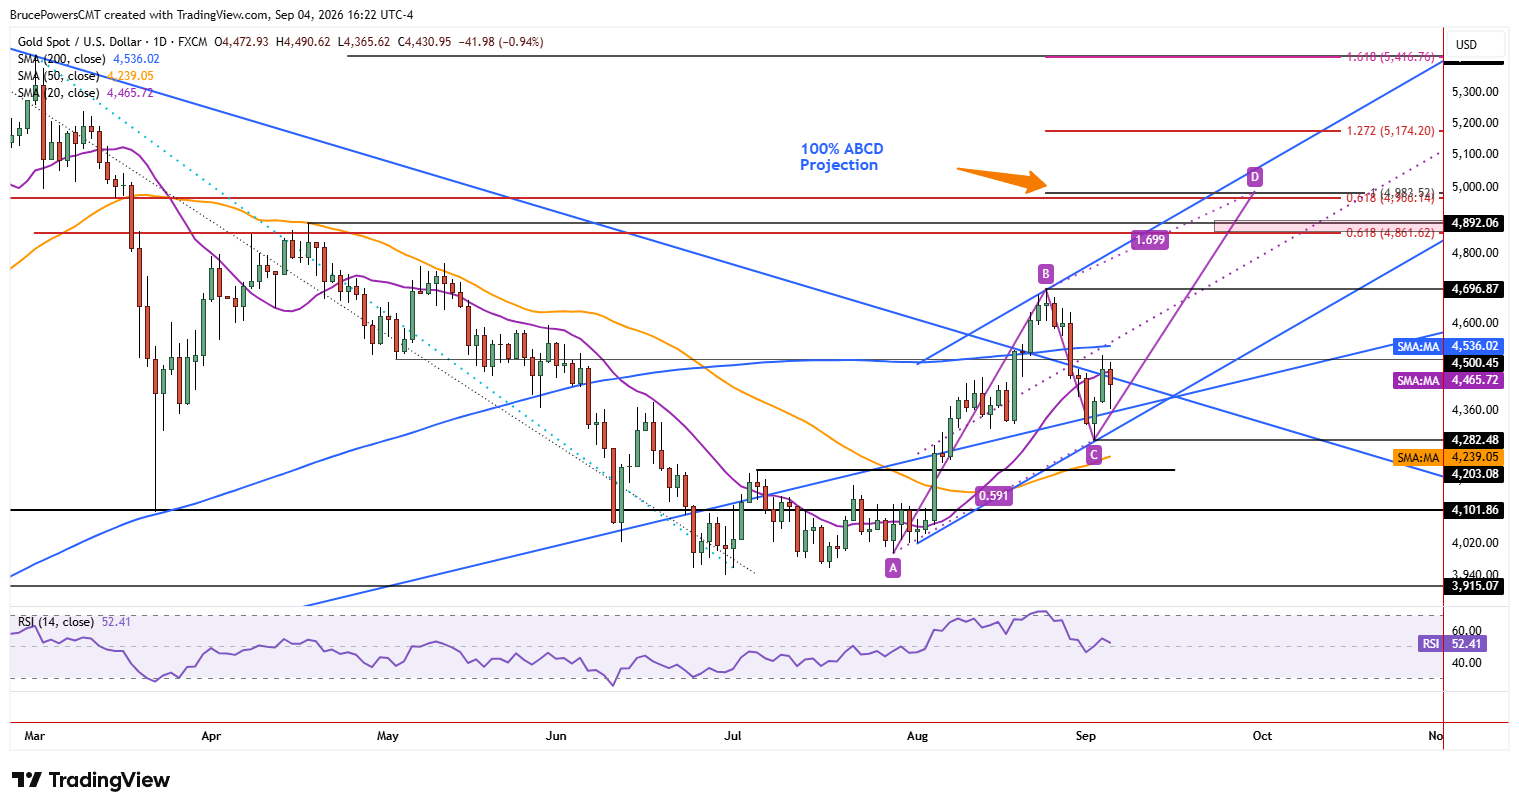
Gold established a higher swing low at $4,282 earlier this week, suggesting that the first pullback following its bullish reversal breakout from a bottom consolidation range in early-August may be complete. The higher swing low also confirmed a switch to support for the uptrend line after gold had traded below it during the recent consolidation. That swing low is now key near-term support and provides a second anchor point for a new rising trendline, defining the lower boundary of a developing rising trend channel. The 50-day moving average, currently near $4,239 and rising, provides another layer of dynamic support for the bullish trend.
Resistance Defines Next Breakout Test
Key resistance begins with the 200-day moving average near $4,536. It was initially reclaimed two weeks ago but then failed to hold last Friday and gold has traded below it since then. A renewed reclaim and sustained move above the average would strengthen the bullish outlook, with a move above the recent swing high of $4,697 providing a new continuation signal. If buyers can then retain control, the first resistance zone of note begins around $4,862, and extends to the April lower swing high of $4,891.
ABCD Target Aligns with Fibonacci Resistance
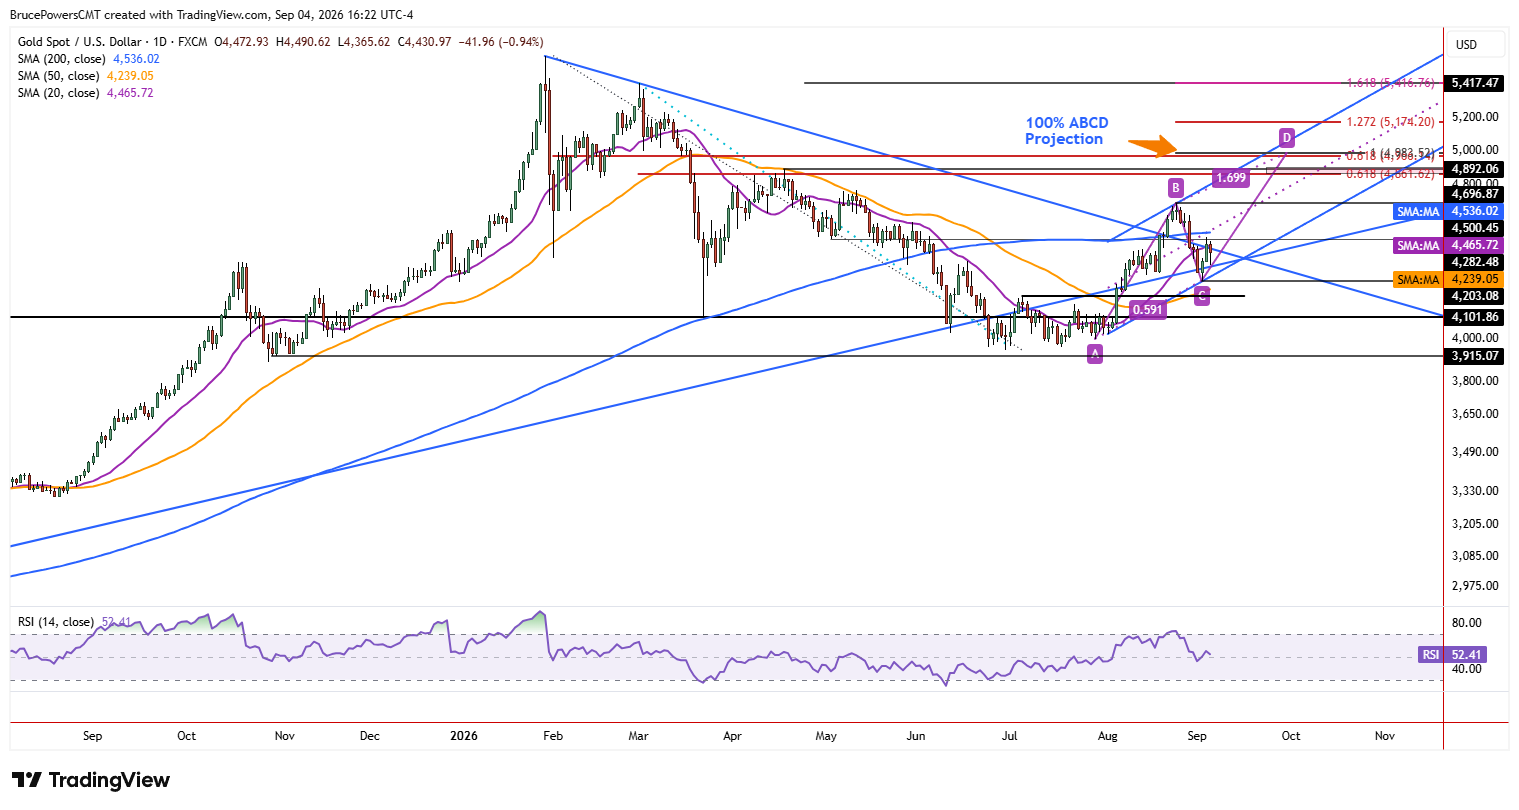
A 100% projected target for a rising ABCD pattern at $4,984 aligns closely with the 61.8% Fibonacci retracement of the prior decline at $4,966. Together, the $4,966 to $4,984 range establishes the next higher resistance zone if the $4,892 level is surpassed. Since a 61.8% Fibonacci retracement is relatively common, the ABCD pattern target provides additional technical significance to this zone and increases the likelihood that it could be tested as resistance before the current advance completes. Notably, this higher target zone could be reached without gold leaving the boundaries of the rising channel, reinforcing the potential for continued bullish momentum.
Second Leg Could Extend Advance
There has only been one leg up since the bottom of the recent correction and a second leg up at a minimum is likely. The second leg up should extend the current advance above the recent high of $4,697 and toward higher targets.
If you’d like to know more about how to trade gold and silver, please visit our educational area.