


Rally Meets Resistance
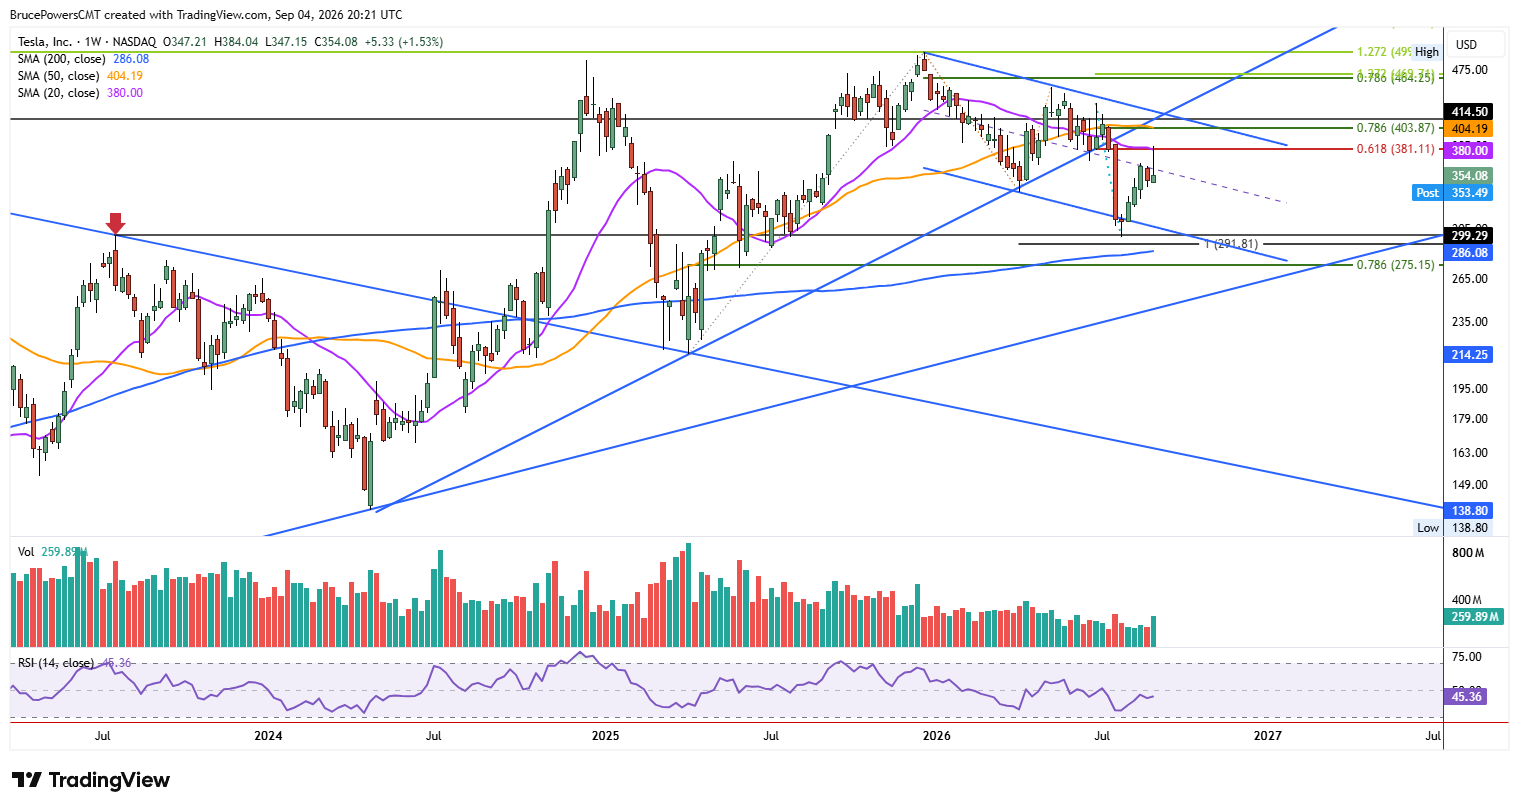
Tesla, Inc. (TSLA) extended its counter-trend rally to a high of $384.04 on Thursday, completing a 61.8% Fibonacci retracement of the prior decline at $381.11. The 20-week moving average near $380 also reinforced the potential for resistance in this area. On Friday, a one-day bearish reversal then triggered, suggesting the advance may have reached a high and that a pullback could follow to test support levels. The weekly chart also supports the potential for a pullback, having ended the week with a bearish shooting star candlestick pattern.
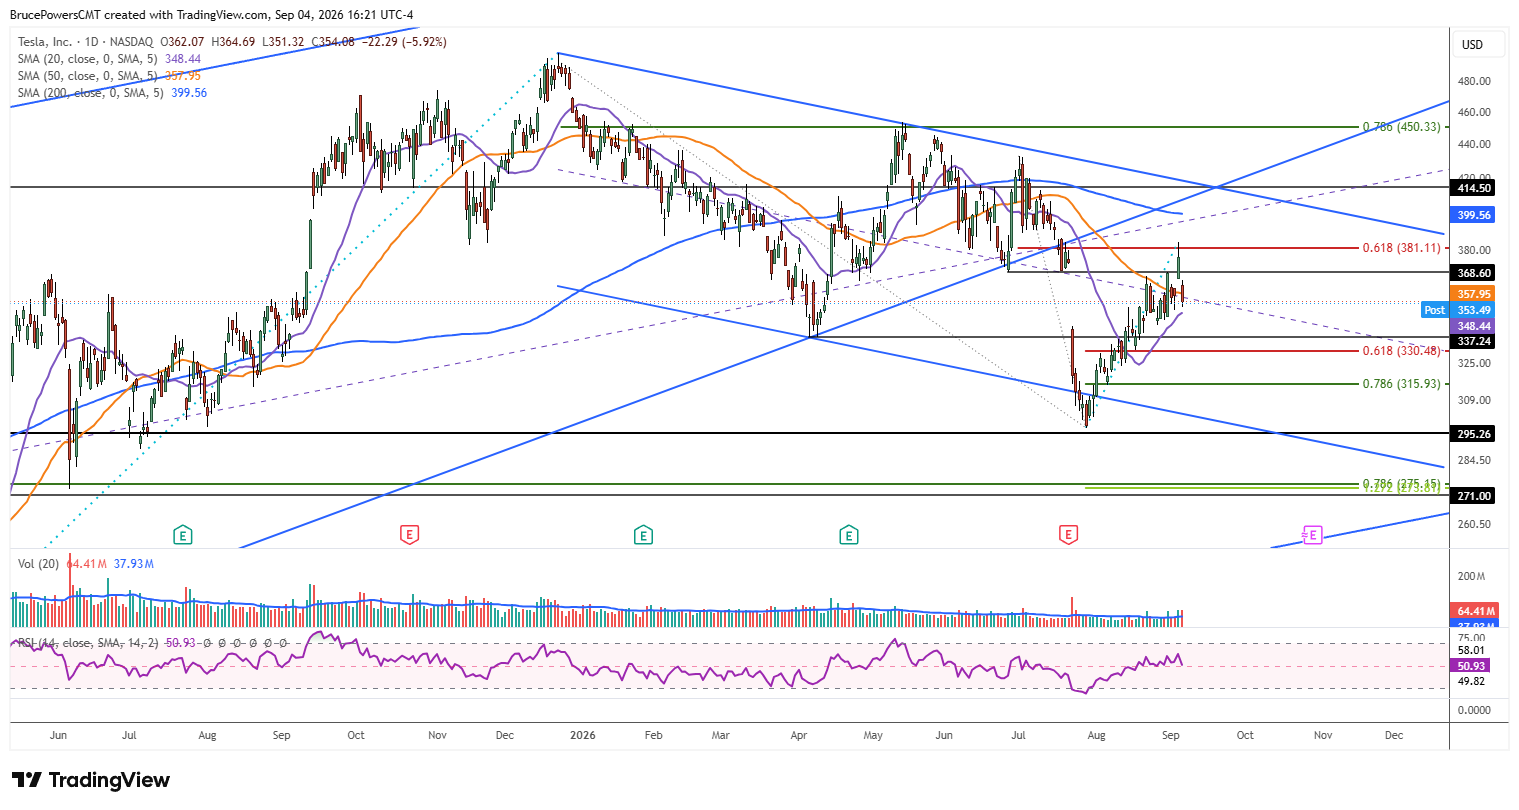
$330–$331 Becomes First Major Test
Consequently, a weekly bearish reversal signal would be triggered by a move below this week’s low of $347.15, with an initial target near the three-week low of $331.12. That level is a higher swing low on the daily chart, and it aligns with a 61.8% Fibonacci retracement of the prior advance at $330.48, adding technical significance to the $330-$331 area and increasing the likelihood that it could be tested.
Channel Leaves Room for Another Rally
Given the larger trend structure, once a retracement of the recent advance occurs, TSLA is expected to establish a higher swing low and potentially generate a second leg higher from the recent July bottom at $297.38. That bottom created a lower swing low, with price finding support near the lower boundary of a falling trend channel.
The constructive advance that followed reinforced the relationship. Once a reversal occurs from one boundary of a trend channel, the other boundary becomes a potential target. The upper falling channel line is therefore a potential upside target, and price has not yet reached it. This doesn’t mean that it will be reached, but if a correction establishes a new higher swing low, the upper channel boundary could come back into focus as a potential target.
Deeper Correction Remains Possible
In addition, the larger bearish correction may not have bottomed at the recent lower swing low. In that case, TSLA could continue lower to test a potential support zone near $274.64. A decline below the 78.6% retracement of the recent advance would increase the chance of that scenario unfolding. Otherwise, the $274.64 area could represent an important lower support boundary if a deeper pullback develops from this week’s high. Thus, the near-term bearish reversal could determine whether TSLA simply establishes a higher swing low for another advance or resumes its larger corrective decline.
If you’d like to know more about technical analysis and how traders use it, please visit our educational area.