NASDAQ 100 Technical Analysis
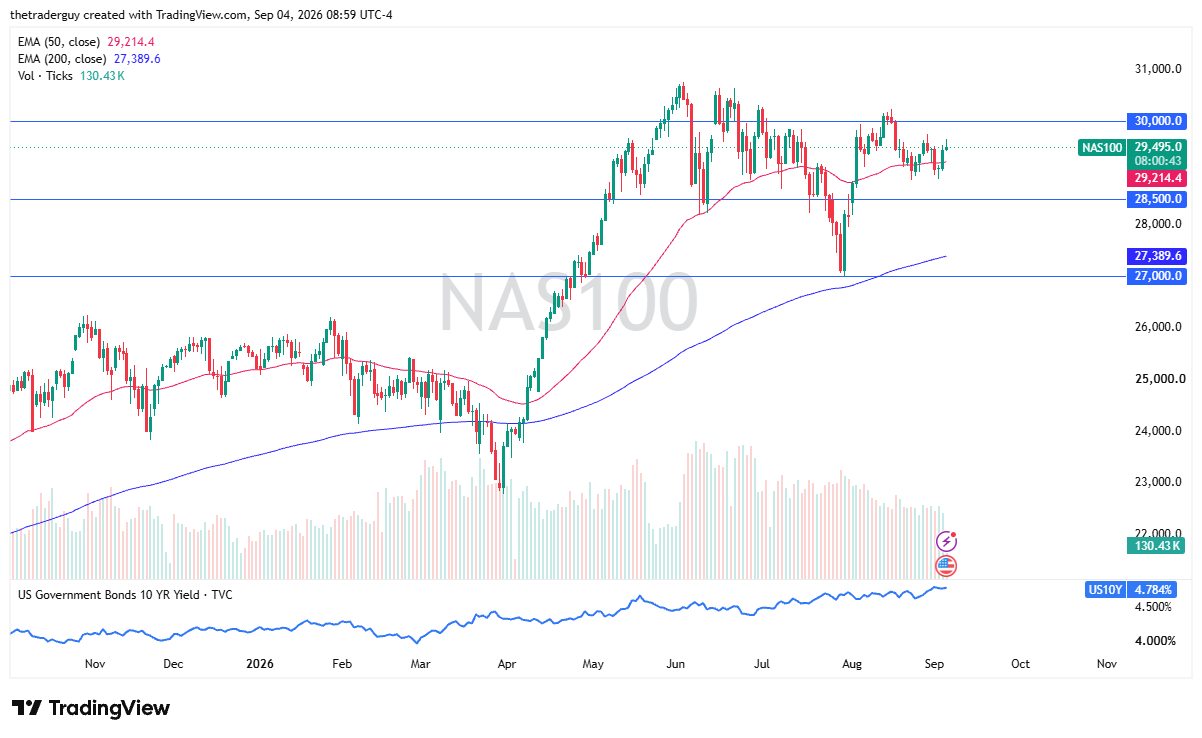
The NASDAQ 100 initially rallied early on Friday but has given back some of those gains as we have some questions to ask about the jobs market that is so much stronger than anticipated. With that being the case, I think this is going to be one of those markets where we will probably be trying to figure out what to do on Friday. Keep in mind, Monday is a holiday in the United States; it’s Labor Day. So, we have a 3-day weekend ahead. This could look a whole lot like a lot of sideways action, possibly with a little bit of bearish overhang in the short term.

Dow Jones 30 Technical Analysis
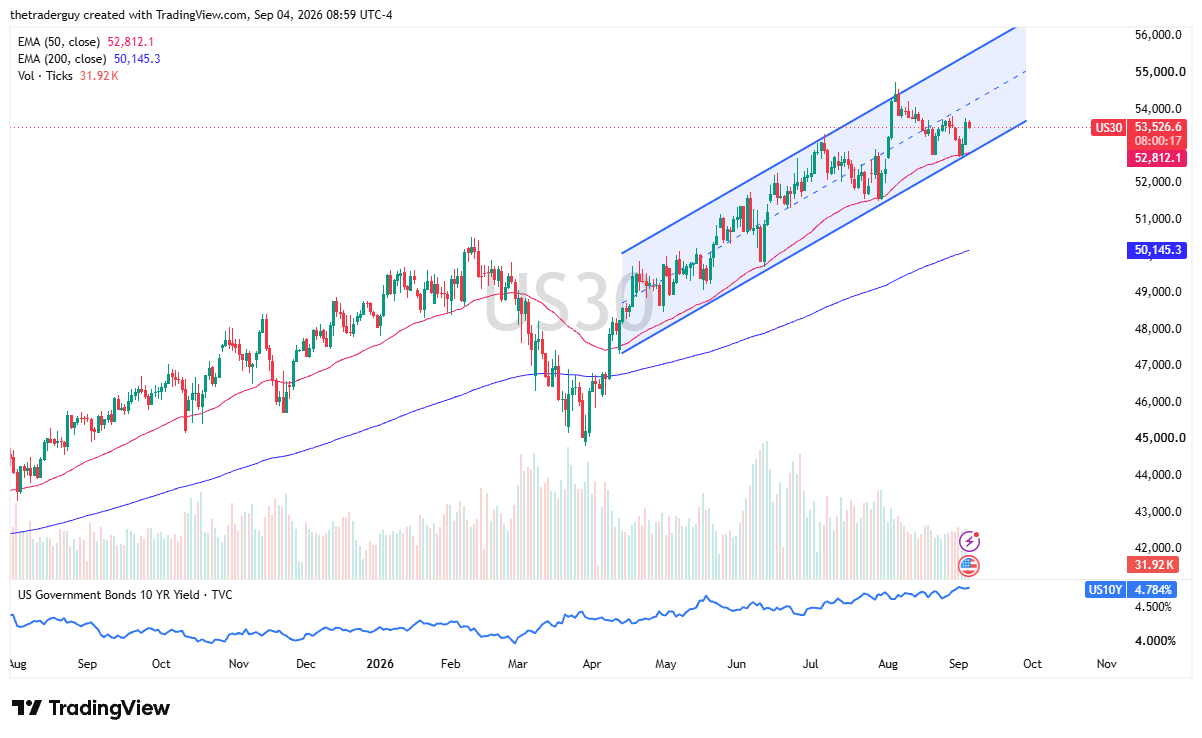
The Dow Jones 30 looks like it’s pulling back just a touch as well. It remains in the channel it’s been in since the middle of April. Really, at this point, the Dow Jones 30 is just, I think, trying to absorb this information. Keep in mind, in the United States, it’s not uncommon for people to take Friday off on a Labor Day holiday weekend as well.
So, we have to ask questions about volume. But the initial reaction is most certainly negative to an addition of 165,000 jobs in comparison to the anticipated 55,000. Rates did, of course, spike there pretty quickly. We’ll see if those continue to remain elevated.
S&P 500 Technical Analysis
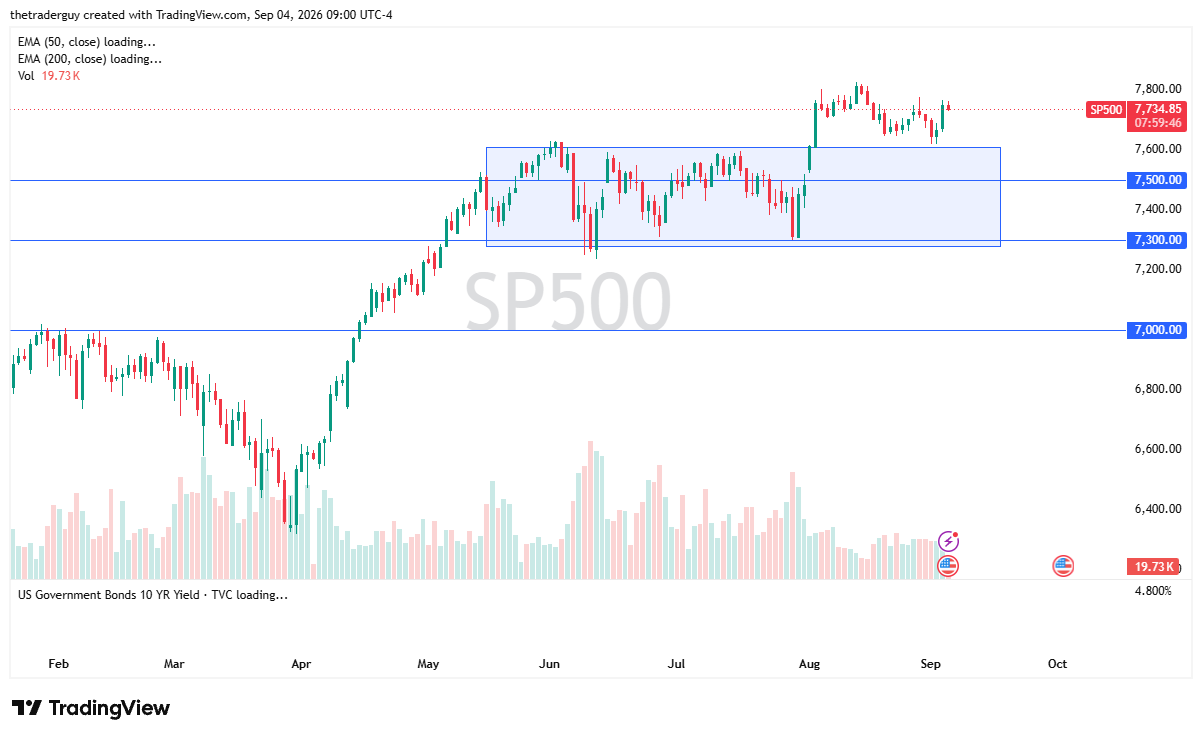
The S&P 500 looks a little bit negative. Most of this is within the first hour of the jobs report. Whether or not that remains the case remains to be seen, because, quite frankly, a strong economy isn’t necessarily the worst thing in the world. It’s just going to cause some problems for interest rates. So, with that being the case, the S&P 500 looks bullish despite the fact that we are pulling back.
We are still a long way from the 7,600 level, an area that so far has been support. Again, remember Monday is a holiday, so the indices won’t be doing much. The CFD markets might be open depending on the broker, but that has nothing to do with reality at that point.
S&P 500 Price Forecast
Every new S&P 500 analysis as it publishes, today's technical signal and key levels, live price — on one page.
See all S&P 500 forecastsIf you’d like to know more about chart patterns and how to trade them, please visit our educational area.