ORCL Technical Analysis
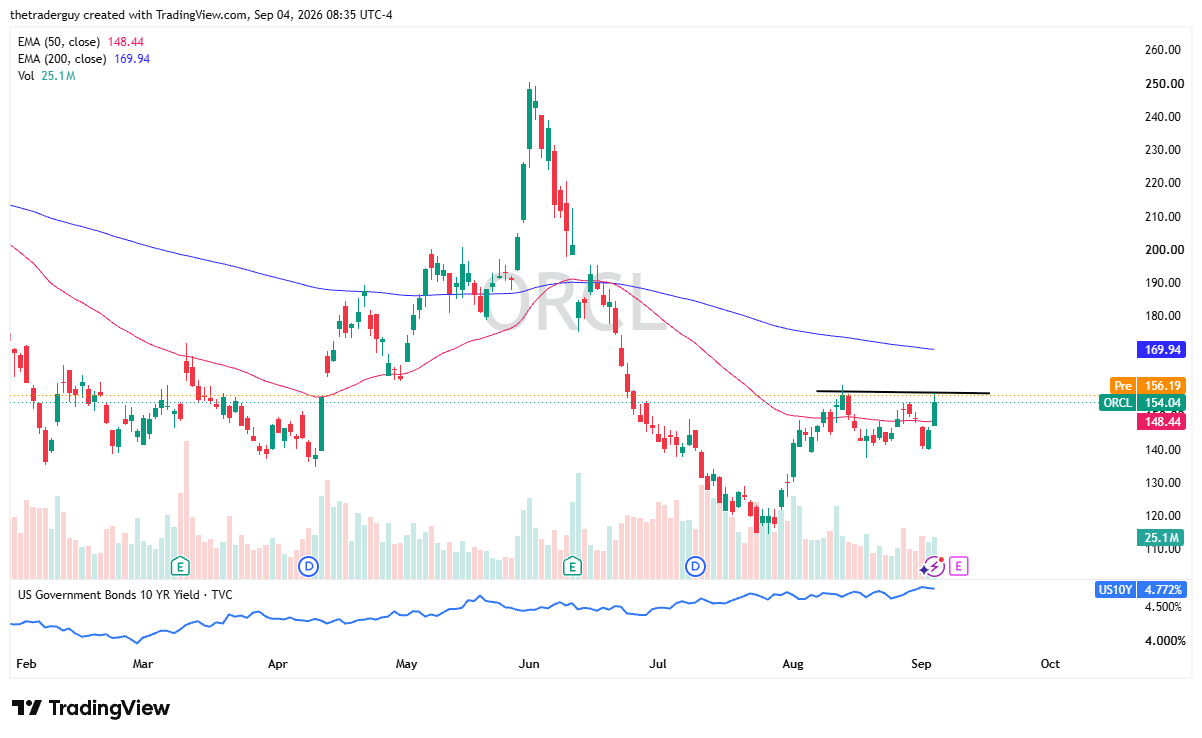
The pre-market trading for Oracle is positive. We are running into some resistance right around the $156.35 level, though. So, it’ll be interesting to see if we can jump over that, but Oracle has been trying to push higher for a while, so traders will continue to look at this as a potential consolidation that’s trying to break out. The 50-day EMA looks a bit supportive, followed by the $140 level.

AMD Technical Analysis
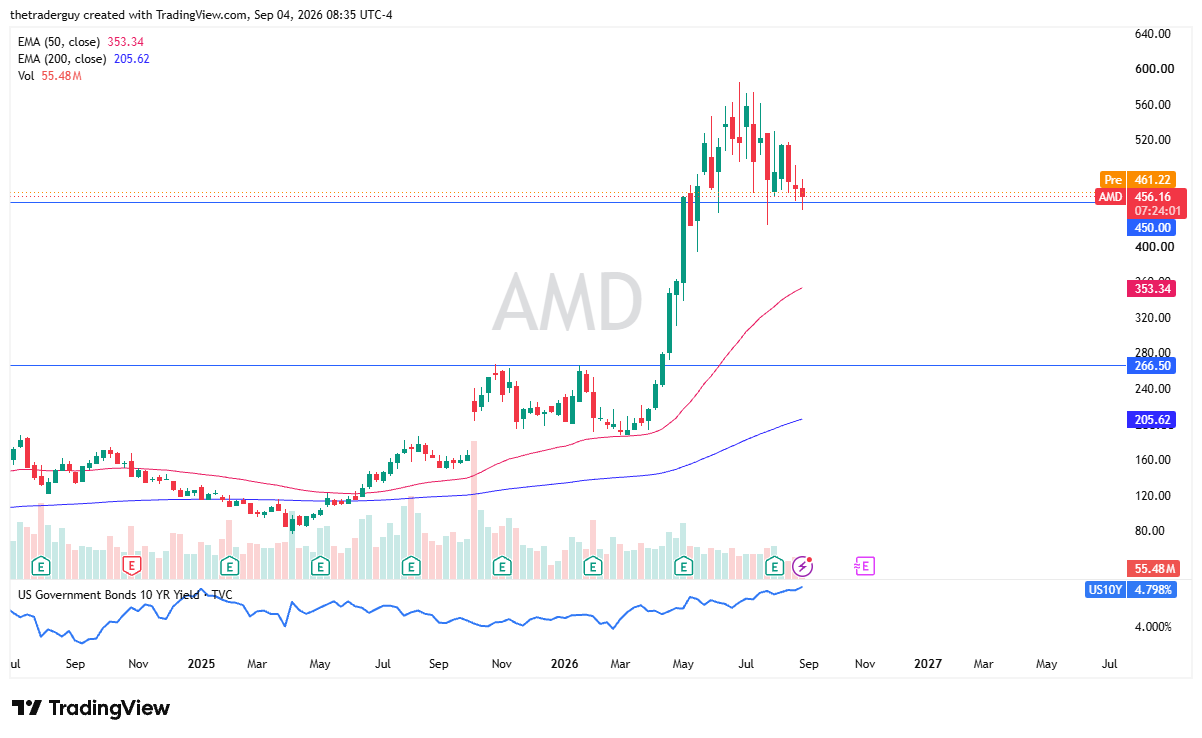
AMD looks like it’s still trying to find its floor near the $450 level. If you watched my video a couple of days ago, you know that I said this could be a rounding top or it could be consolidation, and we’re just testing the bottom of it. We are still sitting on that precipice. We are still at a major point of inflection from a technical analysis standpoint. So, I’ll be watching this area to see if we do, in fact, break down or if we bounce from here. The consolidation area from 450 on the bottom to about 575 on the top still looks very much intact.
INTC Technical Analysis
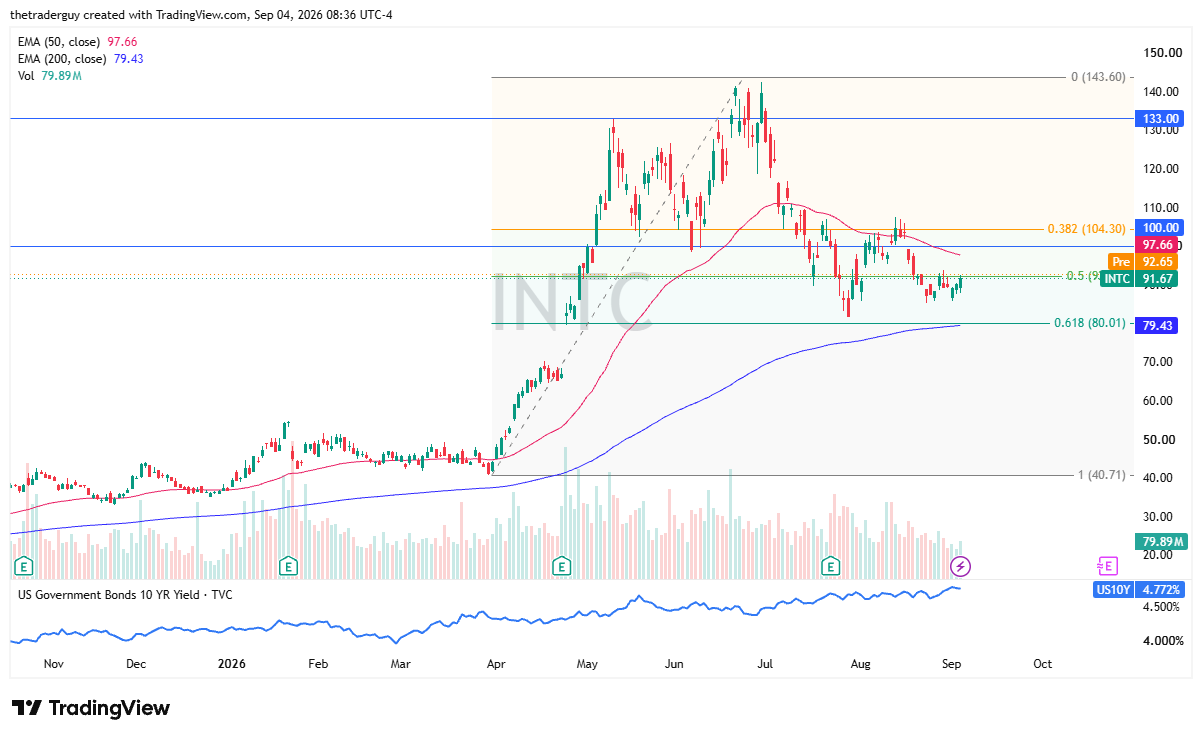
Intel looks basically flat to slightly positive in pre-market trading as it continues to look for its base. You could make an argument for a little bit of a double bottom just formed near the roughly $87 level. And at this point, if momentum picks up, then more and more traders should begin to recognize that.
Intel is a market that had been extraordinarily bullish most of the year, so the little bit of a giveback that we’ve seen makes a certain amount of sense. We even pulled back to the so-called golden ratio at 61.8%. We’ll see if that ends up being something that matters, or if we just flounder here.
If you’d like to know more about technical analysis and how traders use it, please visit our educational area.