


Gold (XAU) trades near $4,475 an ounce on Friday after a 1.93% rally on Thursday. Fed Gov. Christopher Waller said that he could support keeping rates steady in September if inflation continues to decelerate. His remarks brought the odds of a September rate hike closer to 50% from about 67%, as per the FedWatch tool. The drop in expectations of the interest rate hike pushed the US dollar and US Treasury yields down. This supported gold prices, which rebounded from $4,300 to $4,500.
Now the focus of the market has shifted to the U.S. jobs report. Weaker jobs data could extend the rebound in gold above $4,500. On the other hand, strong jobs data may revive rate hike expectations and push the gold price down.
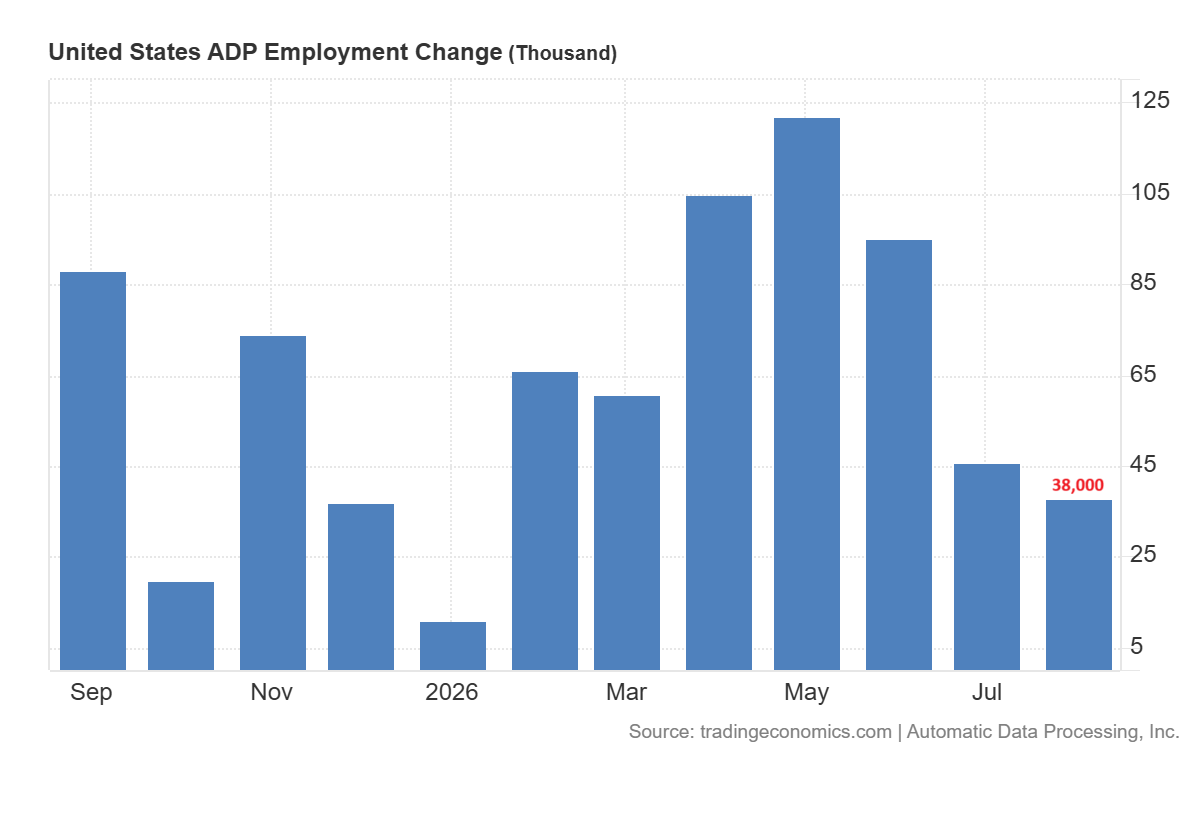
Silver (XAG) is recovering ground following two consecutive sessions of gains to hover around $67 per ounce. As Waller’s remarks eased interest rate pressure, the metal moved up with gold. The recovery was also supported by weak employment figures as private employers hired just 38,000 more workers in August. Silver gained approximately 15% in August and remains strong above the key $50 level. Weak payroll data could extend the rebound in silver, but strong data may push prices below $64.
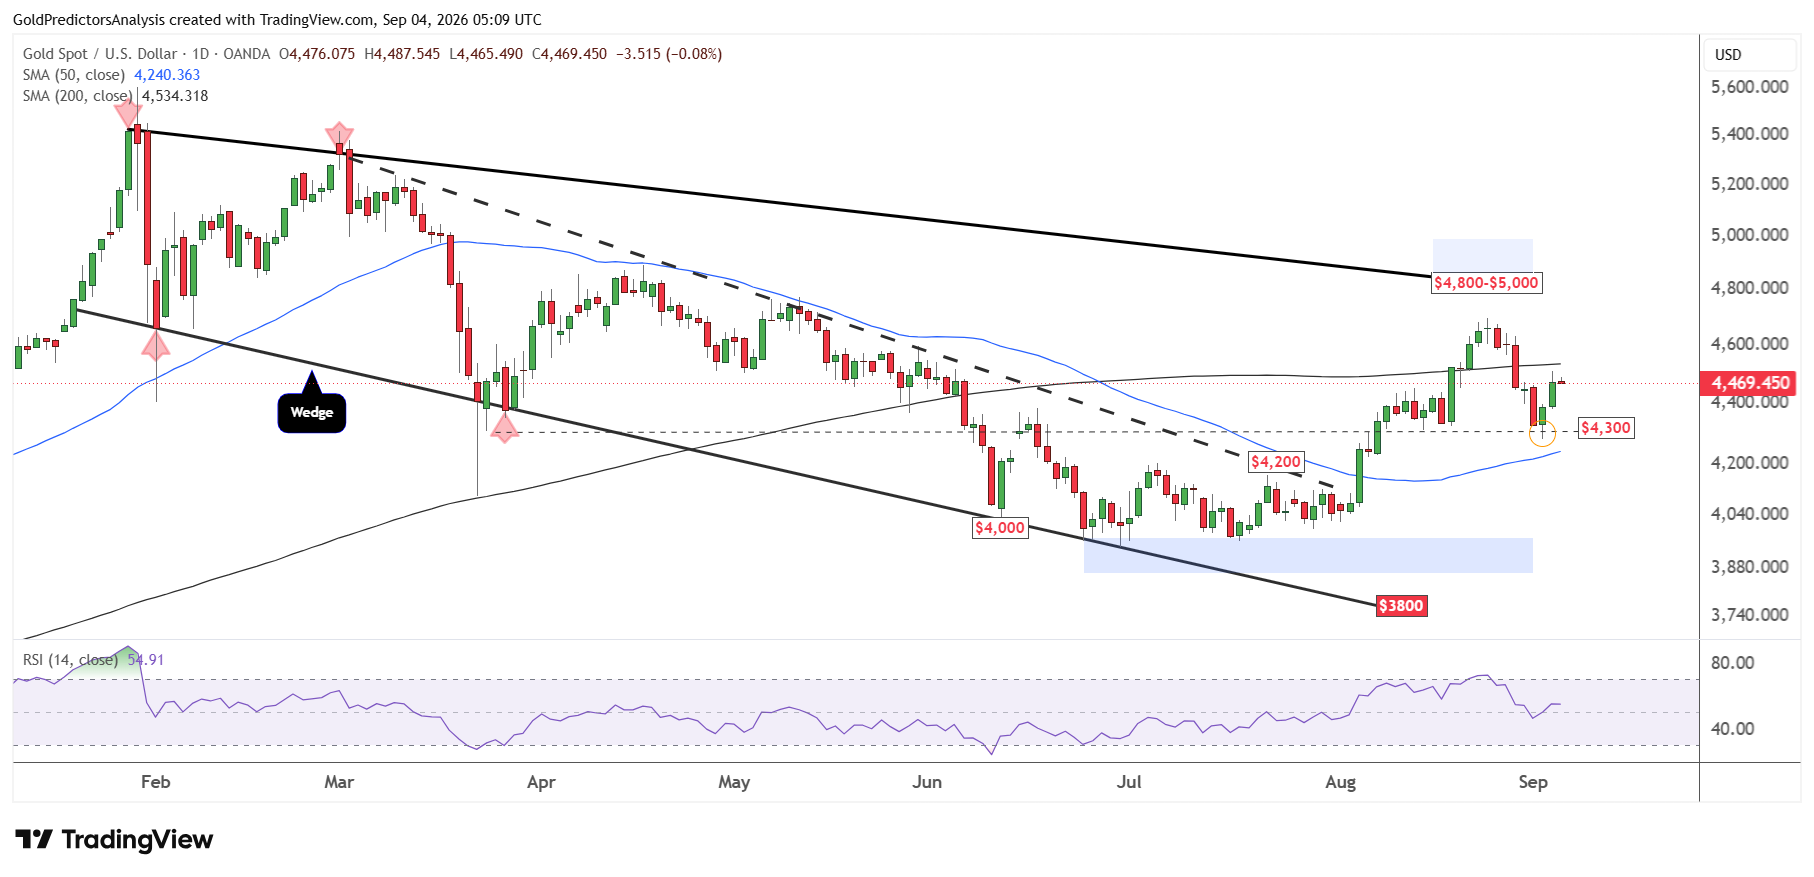
Gold Technical Analysis: Testing the Critical $4,530 Resistance Level
The daily chart for spot gold shows that the price has reversed strongly above the $4,300 support. The price dropped slightly to $4,282 but failed to hold below this level and reversed strongly. This reversal formed bullish hammer candle.
After the rebound, the price reached the 200-day SMA and now awaits the employment data to define the next move. The price has been trading between the 50-day and 200-day SMAs, which lie between the $4,250 and $4,530 levels. A break of either level will likely define the next move. A break above $4,530 will push the price towards the $4,800 area. But a break below $4,250 will push the price towards the $4,000 area.
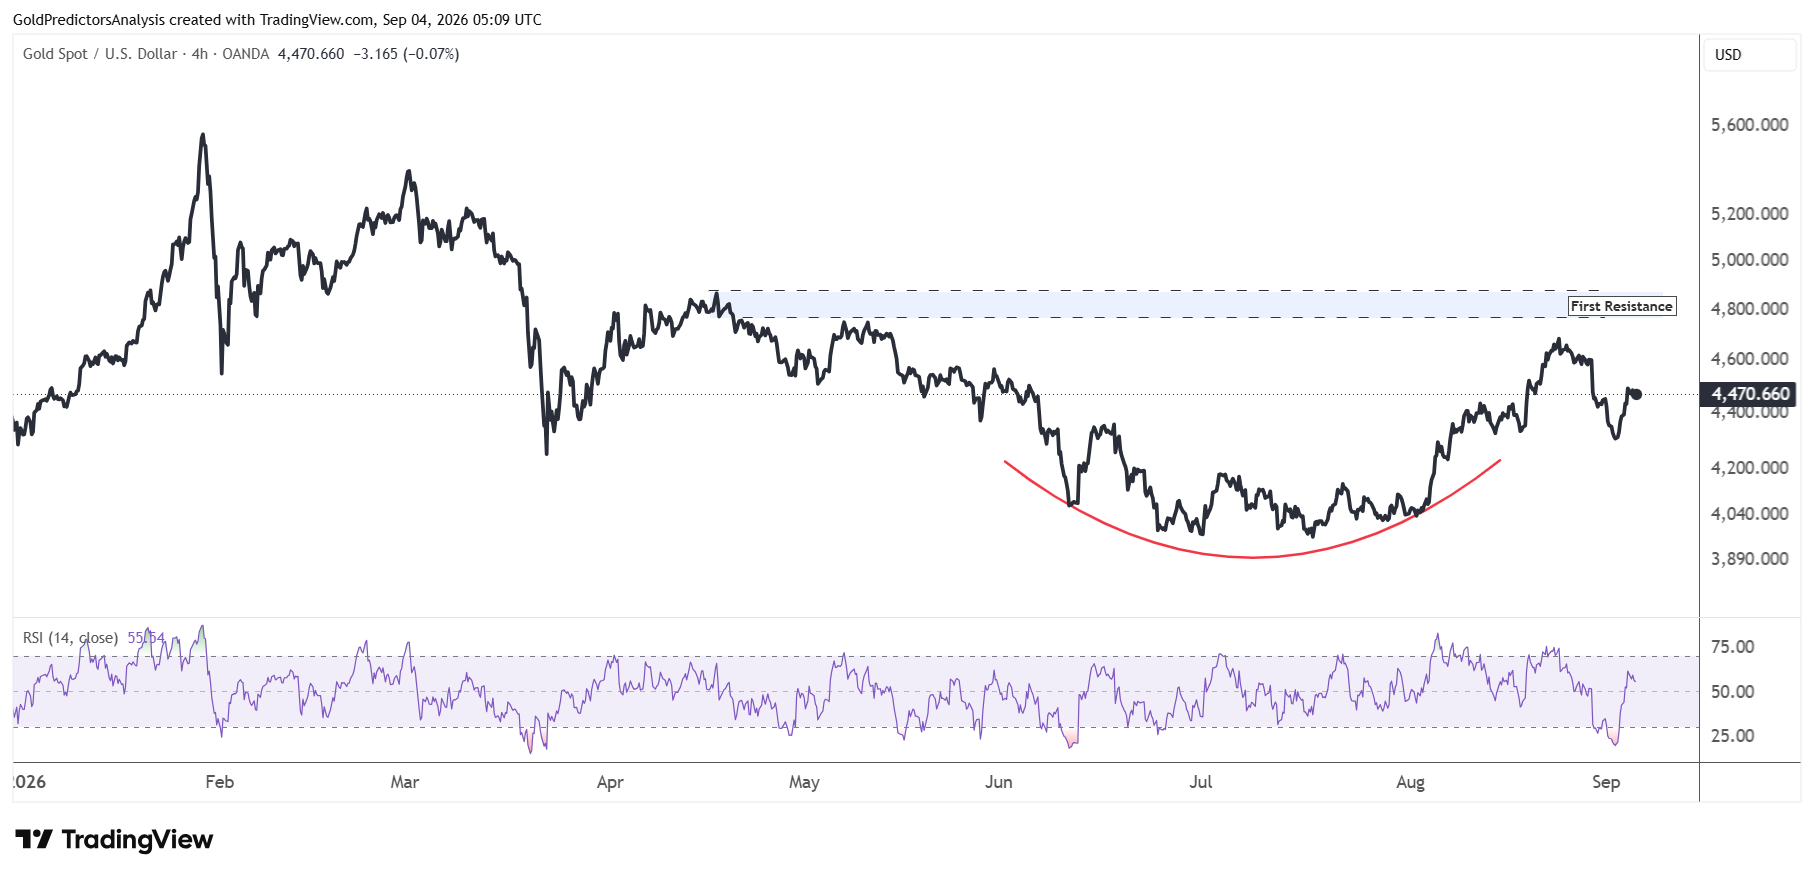
The 4-hour chart for spot gold also shows constructive price action above $4,000. The latest rebound from the $4,300 region was driven by extremely oversold conditions in the short term as seen by the RSI. The RSI has recovered above 50 and the price remains near the $4,500 area. This suggests positive price structure in the short term.
Gold Price Forecast
Every new Gold analysis as it publishes, today's technical signal and key levels, live price — on one page.
See all Gold forecastsSilver Technical Analysis: Can Bullish Momentum Break the $72 Barrier?
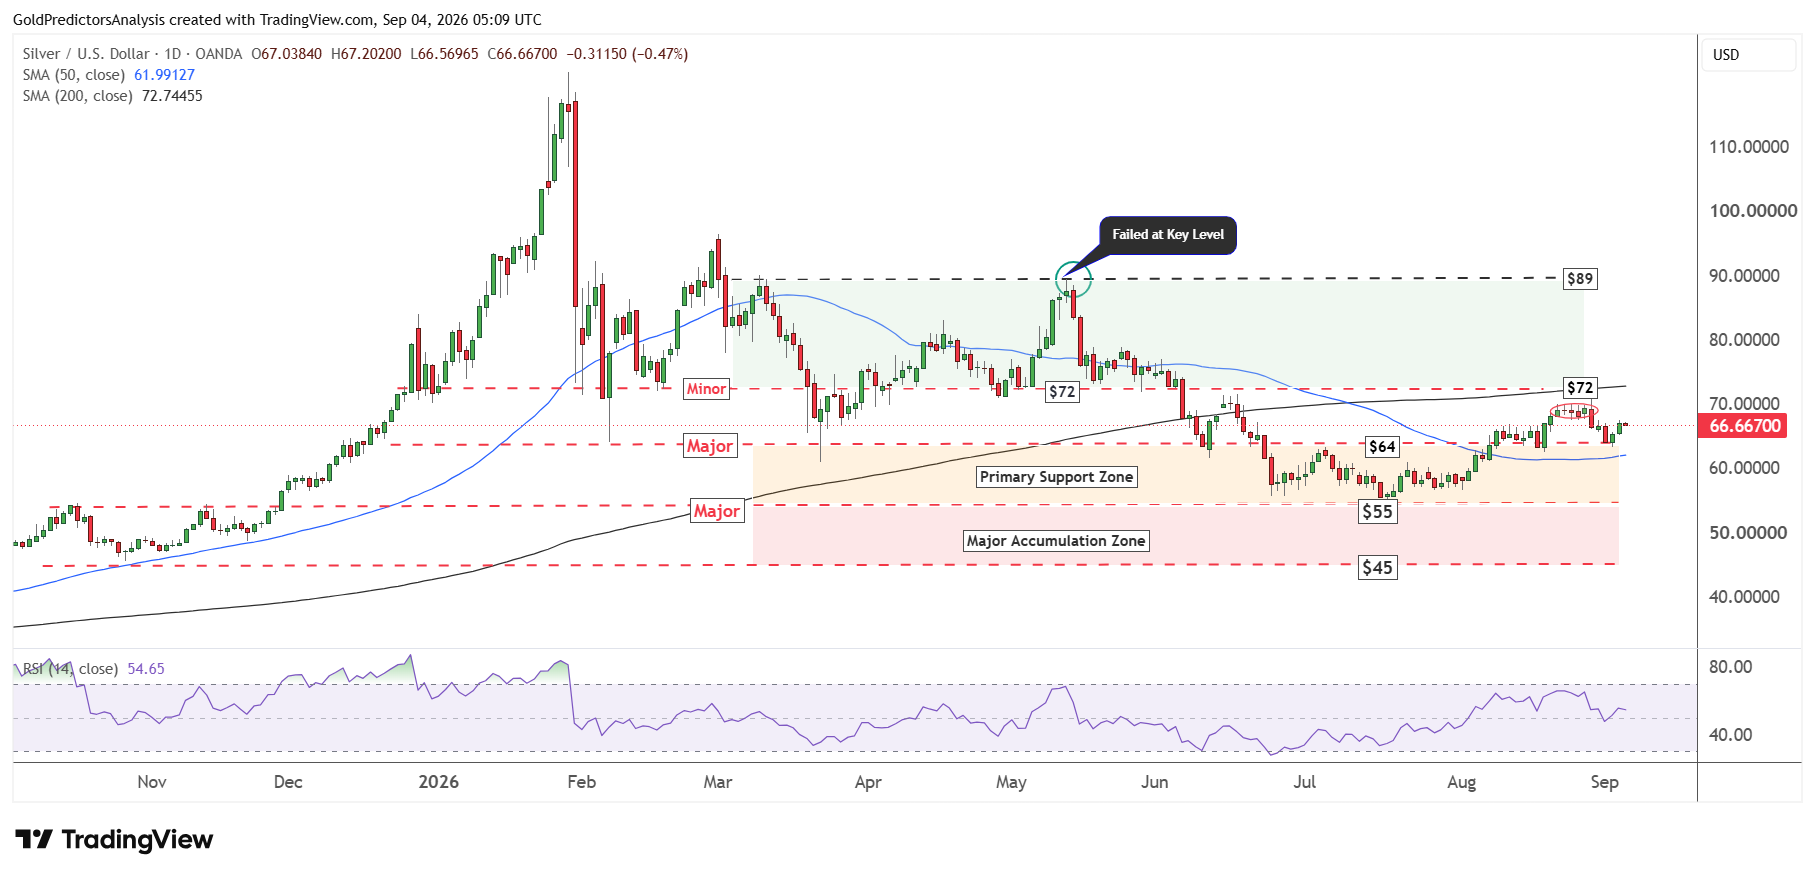
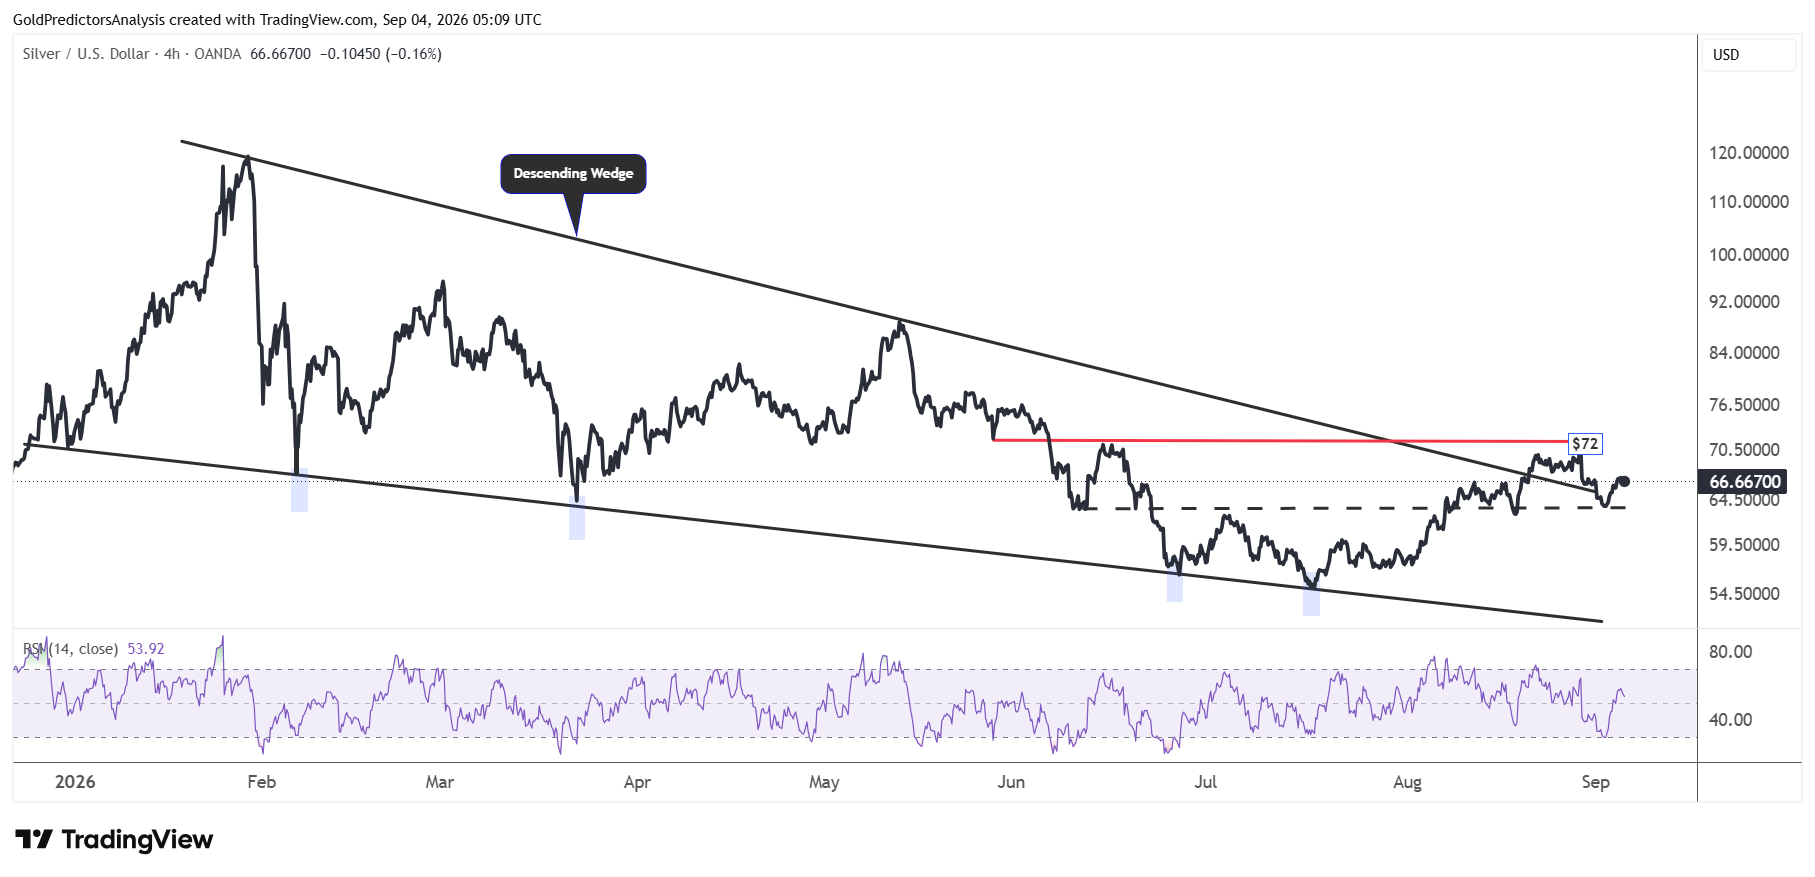
The daily chart for spot silver also shows strong consolidation above the $64 area. The silver price formed bullish hammer candle at the $64 support, just as the gold price formed a hammer candle above the $4,300 area. Silver needs to break the $72 region to open the way for a strong move towards the $89 area. But a break below $64 will push the price towards the $60 region.
The 4-hour chart for spot silver also shows strong consolidation between the $64 and $72 regions. A break of either level will define the next move. However, after the breakout from the descending wedge pattern in the spot silver market, the price action has shifted and the probability of a move higher has increased. Therefore, a break above $72 this time might lead to a quick move towards the $80 to $90 region.
What is Next for Gold and Silver
Gold and silver prices are riding a strong wave of momentum after hints of a potential pause in Fed rate hikes. In my view, the prices are currently in a technical holding pattern and are waiting for the upcoming U.S. jobs report to pick a clear direction. A weak employment report could spark massive breakout and push gold above $4,530 and silver above $72. But if the jobs data comes in surprisingly strong, it will likely revive rate hike fears and send prices down to their lower support zones.
Read more: Gold and Silver Key Support Levels Ahead of US Jobs Report