
Oil & Natural Gas Fundamentals: U.S.-Iran Conflict Tightens Crude Supply as LNG Demand Rebounds
Oil markets have ended the week under the control of geopolitical events. Recent U.S. strikes on Iran coupled with Iran limiting commercial shipping through the Strait of Hormuz has raised concern for the safety of Middle Eastern oil flows. The U.S. has said it will not negotiate until Iranian attacks on commercial shipping stop, while Iran has broadened restrictions on shipping through the Strait of Hormuz. Both the WTI (USOIL) and Brent (UKOil) crude oil prices are negatively affected by this situation, as the Hormuz strait is still an important oil transit choke point.
There are other factors which are affecting the oil market balance. From Iraq, it has been reported that exports have reached 2.34 million barrels per day in August, supported by Iranian approval of Iraqi shipping through the Hormuz strait. Oil shipments will continue at high levels in September. Meanwhile, for the first time in 17 years, Russia has said it expects oil production to drop to the lowest levels, due to the war in Ukraine and the disruption of refineries.
The disruptions cause a blockage of output beyond OPEC+, and the group could also create problems this weekend. It is expected that OPEC+ will keep its October production policy unchanged, after completing the phased removal of 1.65 million barrels per day of its voluntary cuts. There, however, remains a gap in oil supply due to geopolitical disruptions.
The U.S. appears to be leaning much tighter in its crude oil balance. EIA data showed crude stocks drew 4.5 million barrels, to 424.5 million barrels, far beyond the estimated 1.1 million barrel draw.
For natural gas (NG), fundamentals have been supported as LNG feed gas demand recovers following Tropical Storm Edouard, while significantly warmer-than-usual weather throughout the continental U.S. is expected to continue through mid-September. However, record production coupled with above average stock levels provides important counterbalance. The EIA reports U.S. dry gas production reached an all-time high in June while LNG exports for the first half of 2022 were 23% higher compared to the same period the previous year.
Fundamental bias: USOIL bullish, UKOil bullish, Natural Gas moderately bullish, with Middle East escalation and LNG flows the dominant near-term catalysts.

Natural Gas Technical Analysis: NG Holds $2.88–$2.90 Support as $3.03 Remains the Next Bullish Trigger
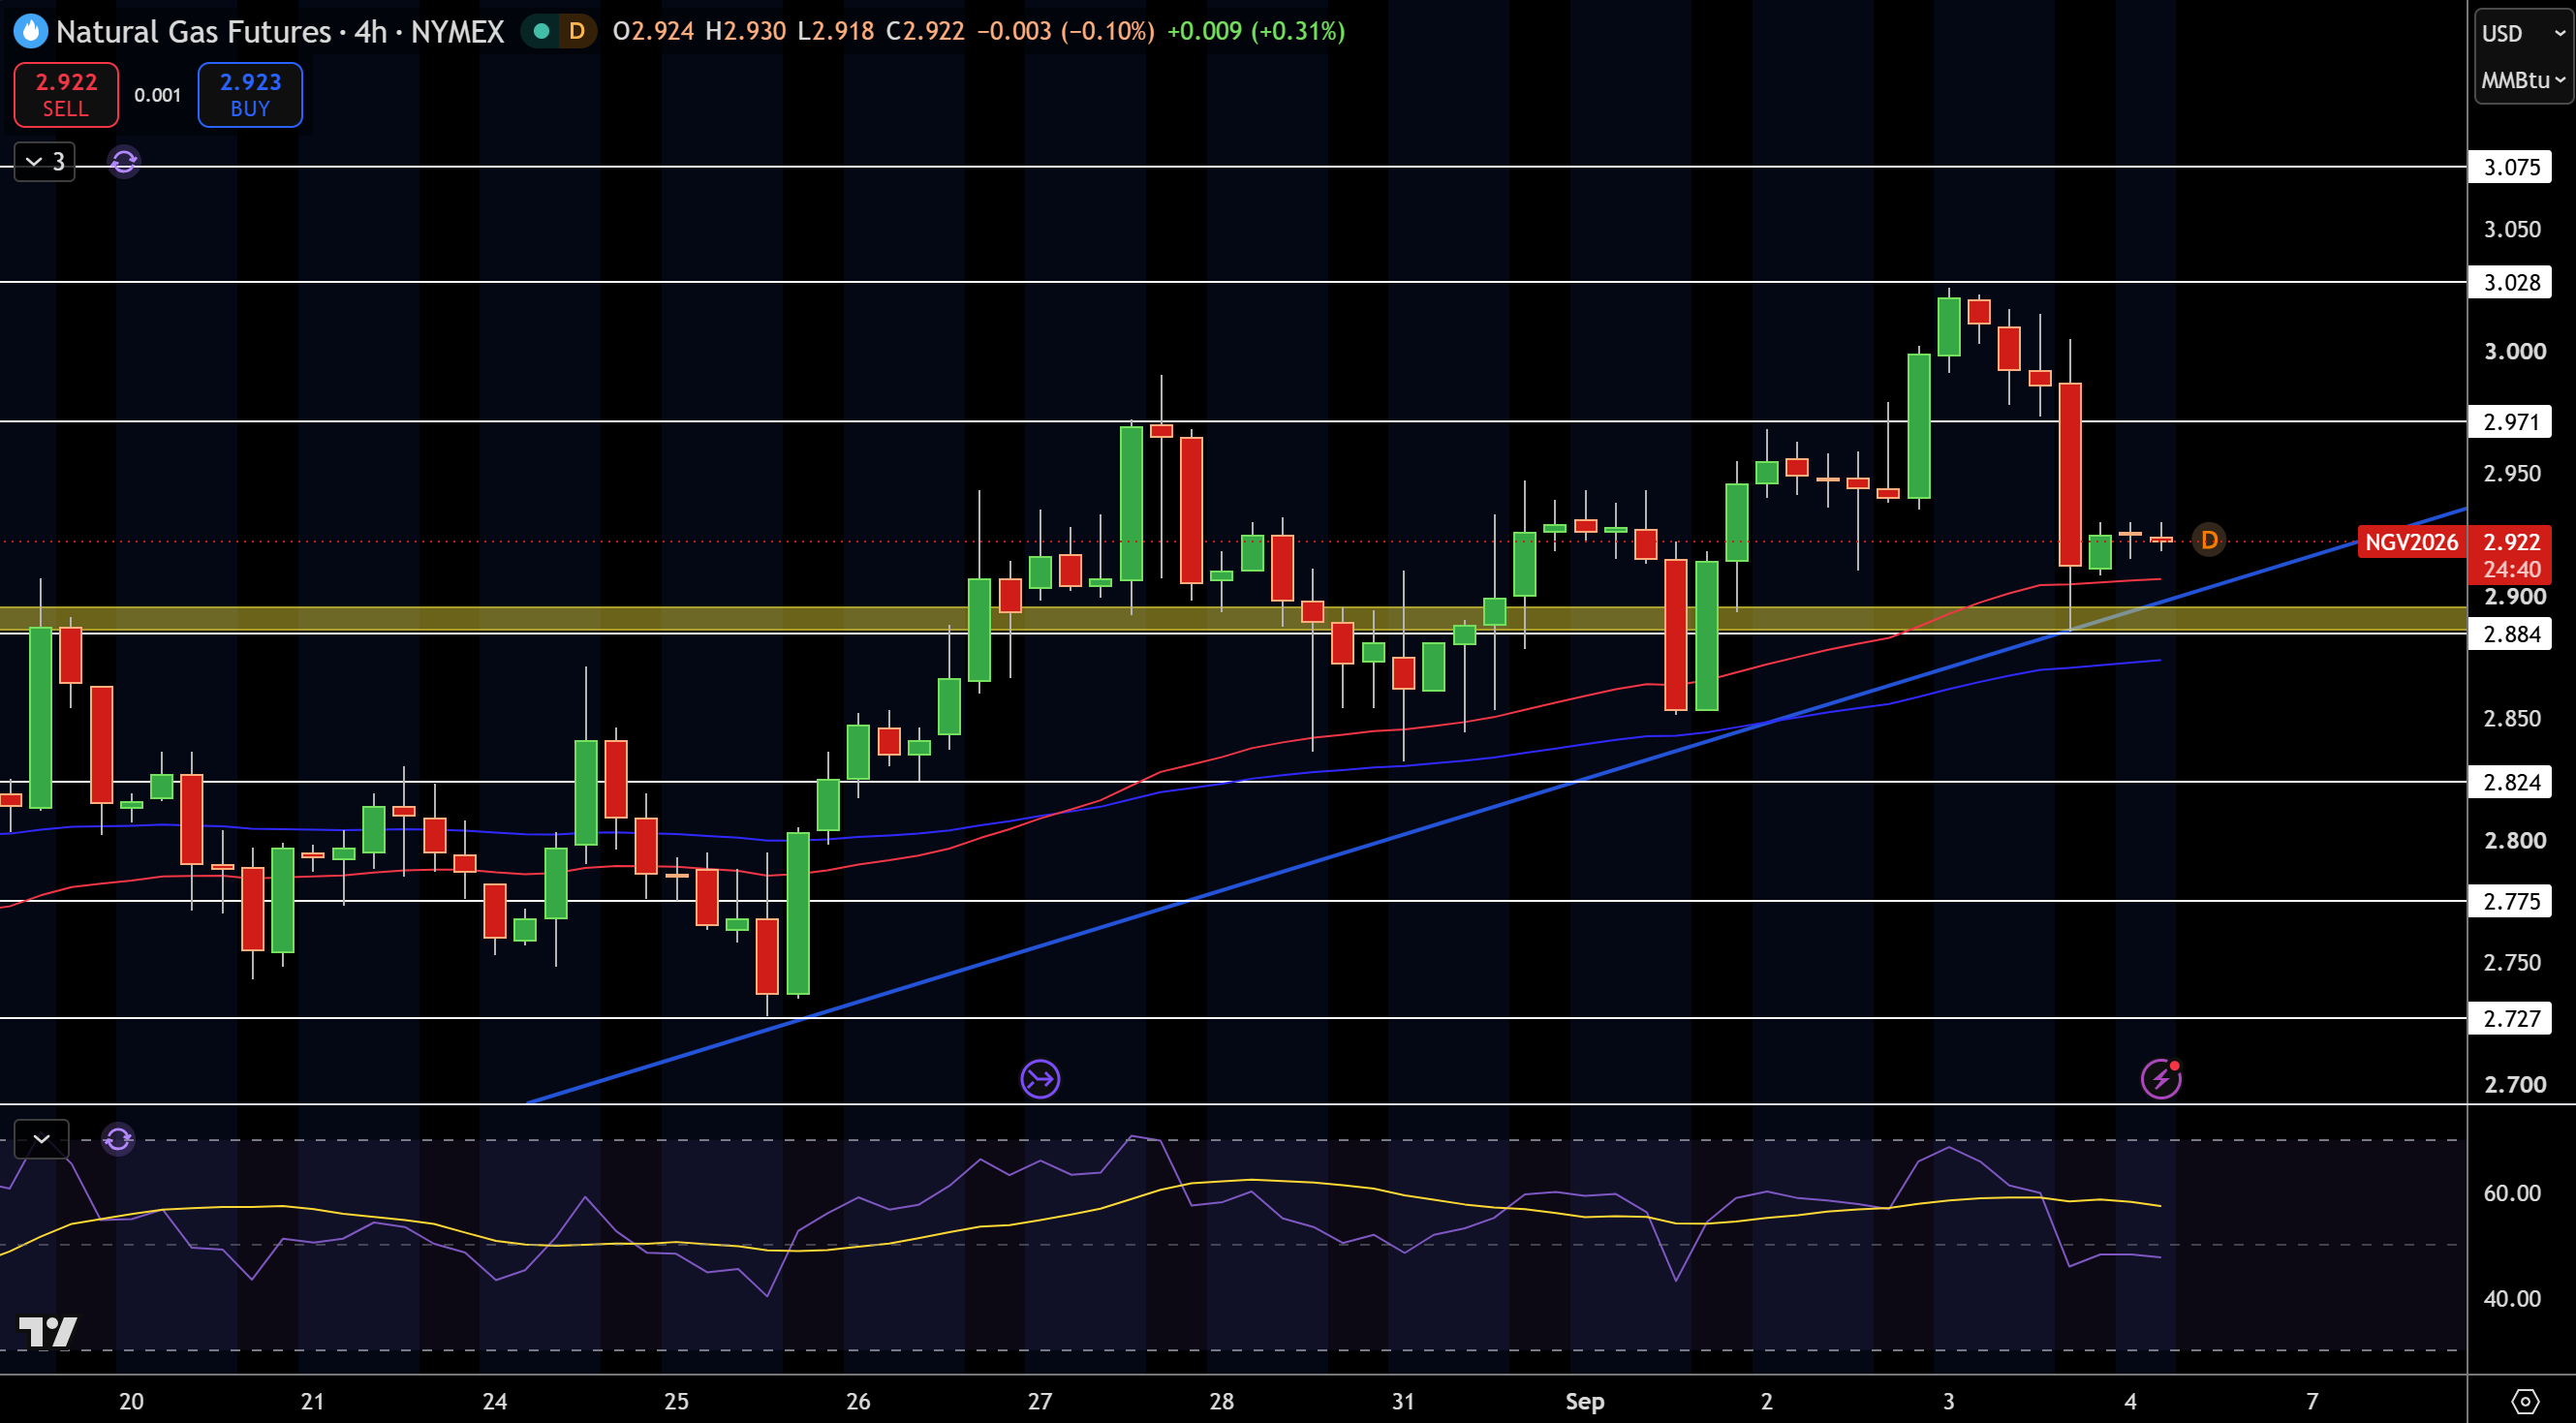
Natural gas trades at $2.92, and its price has retraced to the $3.03 area, which was previously a fresh high. I find the price action particularly constructive because the retracement paused at the $2.88 – $2.90 area. Natural Gas price had recently broken above this area and is also supported by a rising trend line and short-term moving averages.
Above current levels are resistance levels at $2.97, then $3.03 and $3.08. Below is support at $2.90 – $2.88, then $2.82, $2.78, $2.73.
RSI is less extended and, therefore, less bullish. I will favor bullish natural gas contracts as long as $2.88 holds. A break of this level will make the continuation setup less clear as $2.82 will come into play. Above $3.03 will get me watching $3.08.
Natural Gas Price Forecast
Every new Natural Gas analysis as it publishes, today's technical signal and key levels, live price — on one page.
See all Natural Gas forecastsWTI Crude Oil Technical Analysis: WTI Holds Above $89.90 as $92.67 Caps the Next Leg
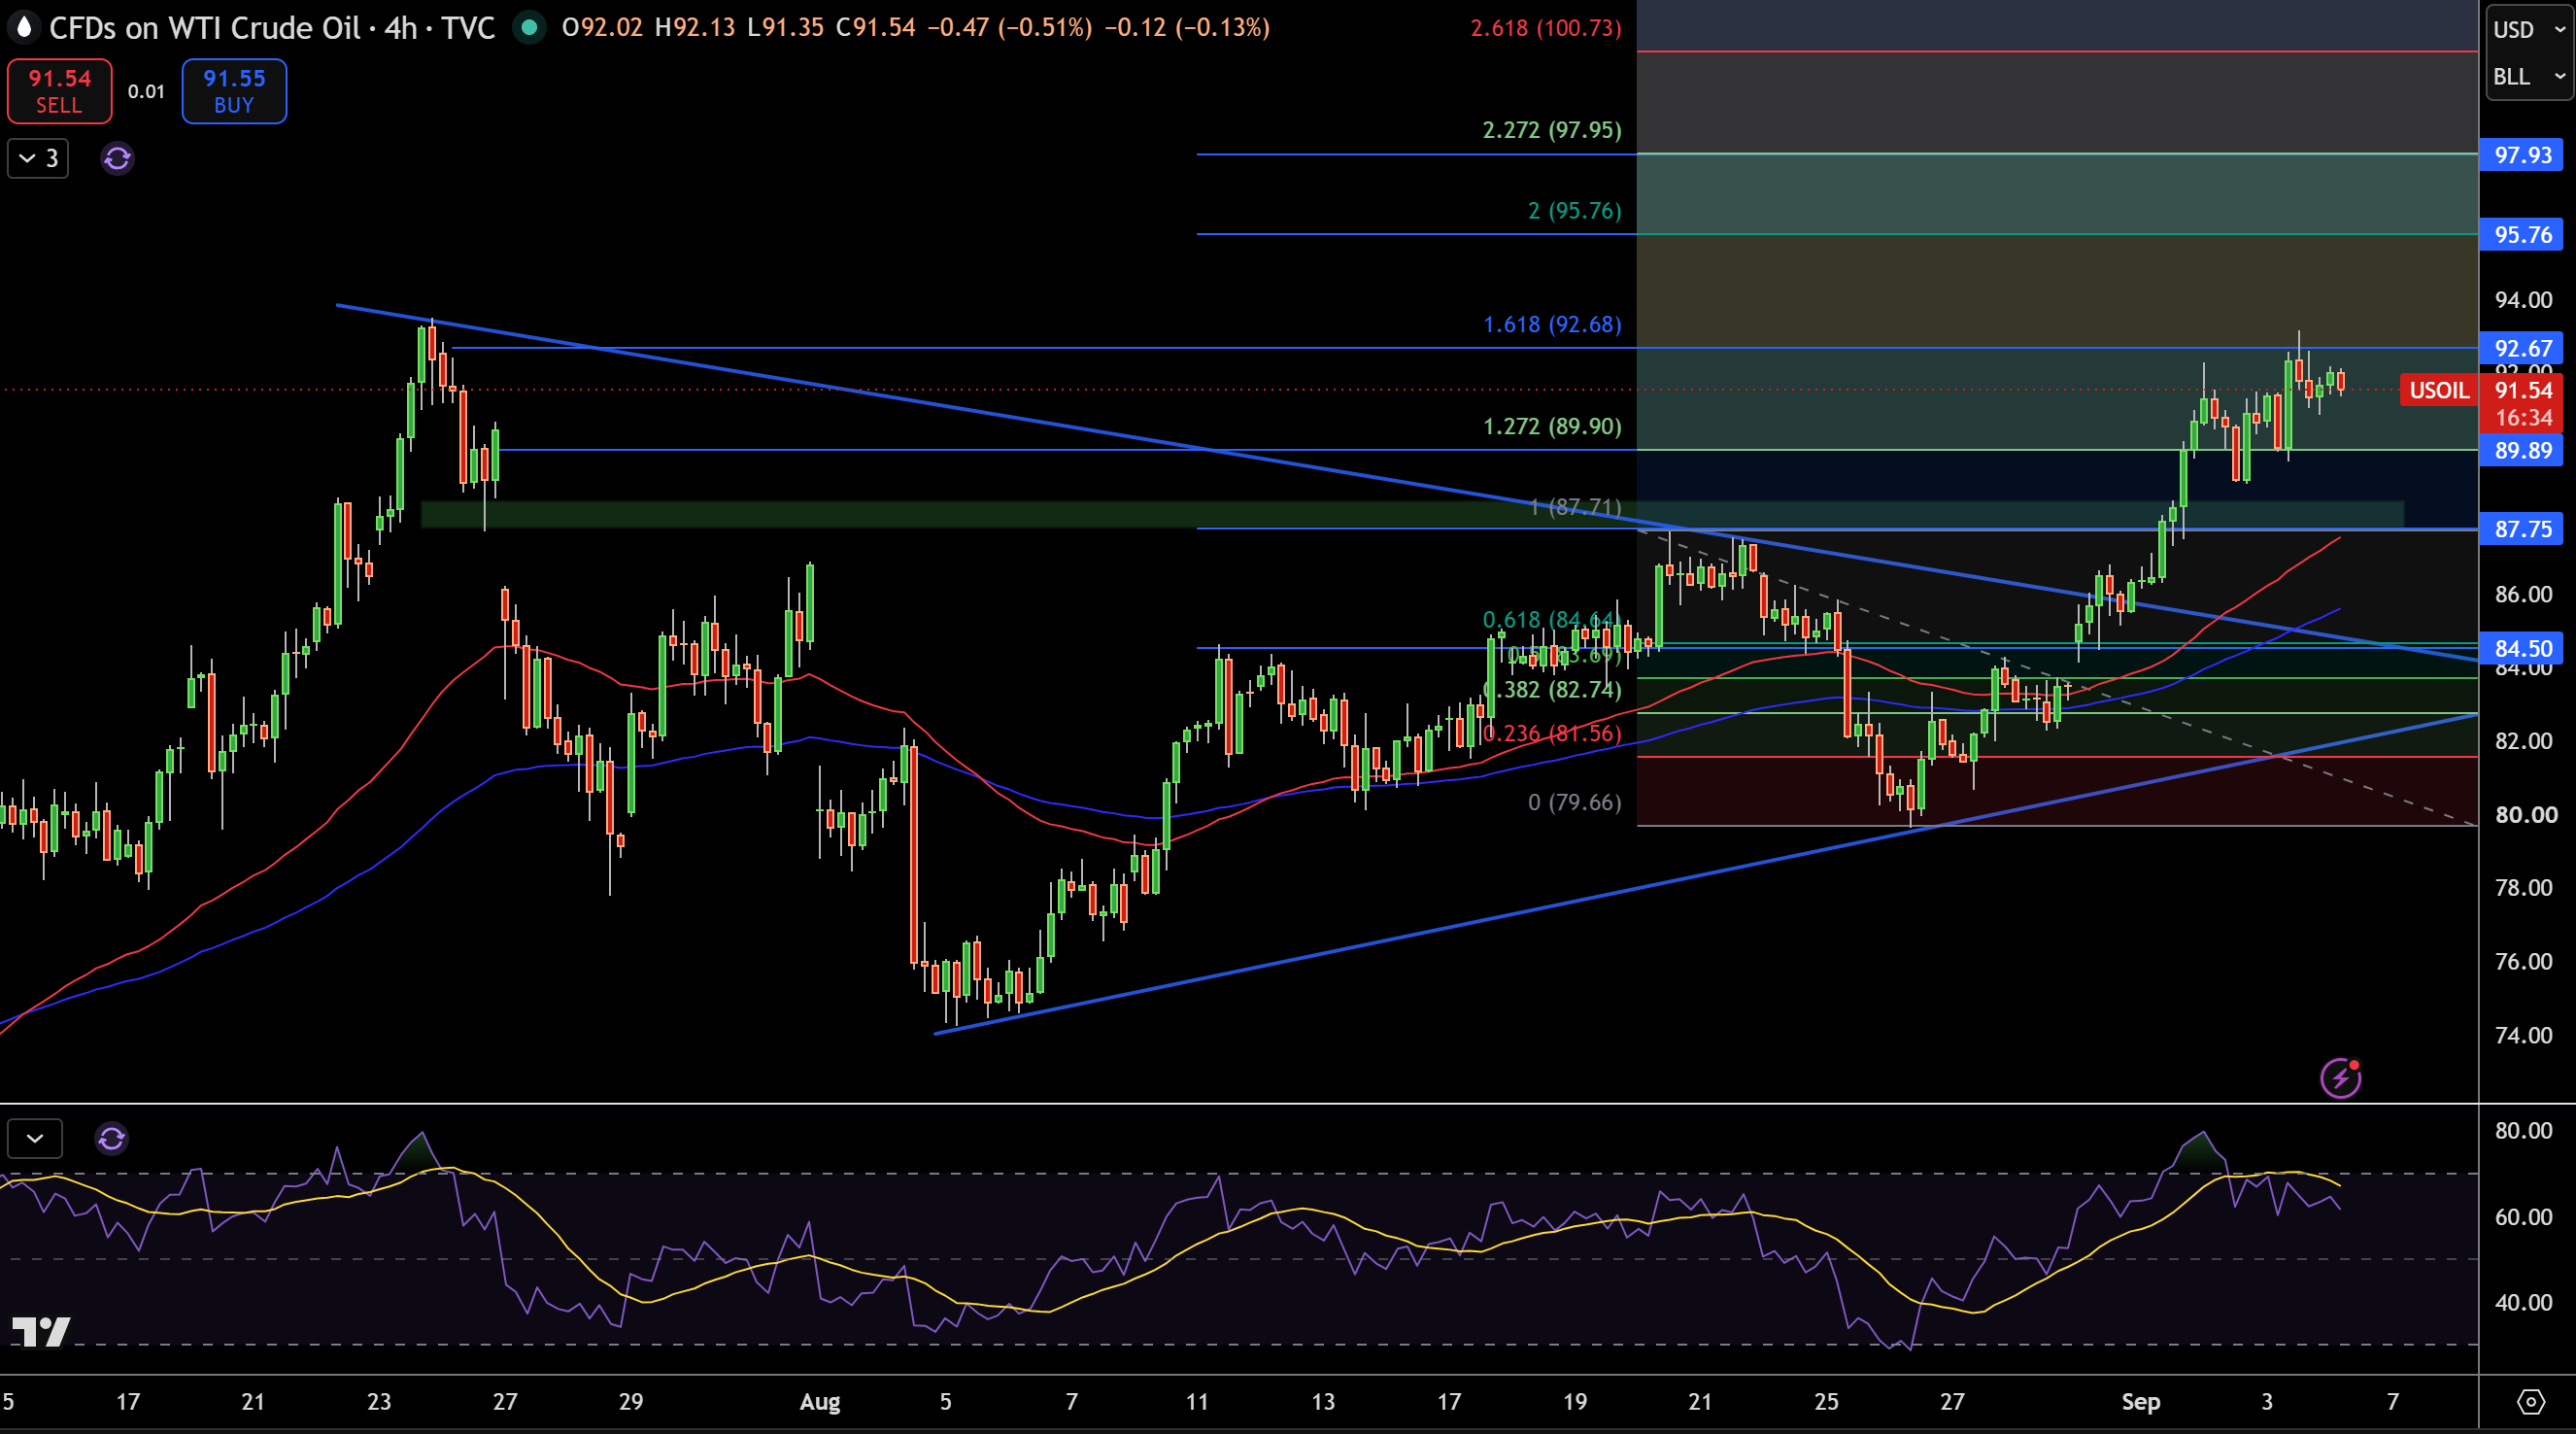
WTI crude is trading around $91.54 on the 4-hour chart having extended the breakout above the long-term falling trend line and the former resistance zone $87.75. What is interesting is that the current consolidation is happening above the $89.90 Fibonacci extension level and not as a quick retracement back toward the breakout level. This exemplifies that the bulls are defending the structure, but there has been some loss of momentum.
The next level to focus on is $92.67, which is the current level of resistance. A clear break above this would expose $95.76, $97.93, and $100.73. The first support is $89.90, but the more notable support would be $87.75. Below $87.75, support would be expanded to $84.50.
RSI has moved from fully extended levels, which I see as beneficial for the current bullish structure as WTI continues to hold above $89.90 and especially the level at $87.75. A break below $87.75 would invalidate the overall bullish structure, and a 4-hour close above $92.67 would confirm the continuation toward $95.76.
Brent Crude Oil Technical Analysis: Brent Consolidates Above $94.15 as $96.95 Remains the Key Breakout Level
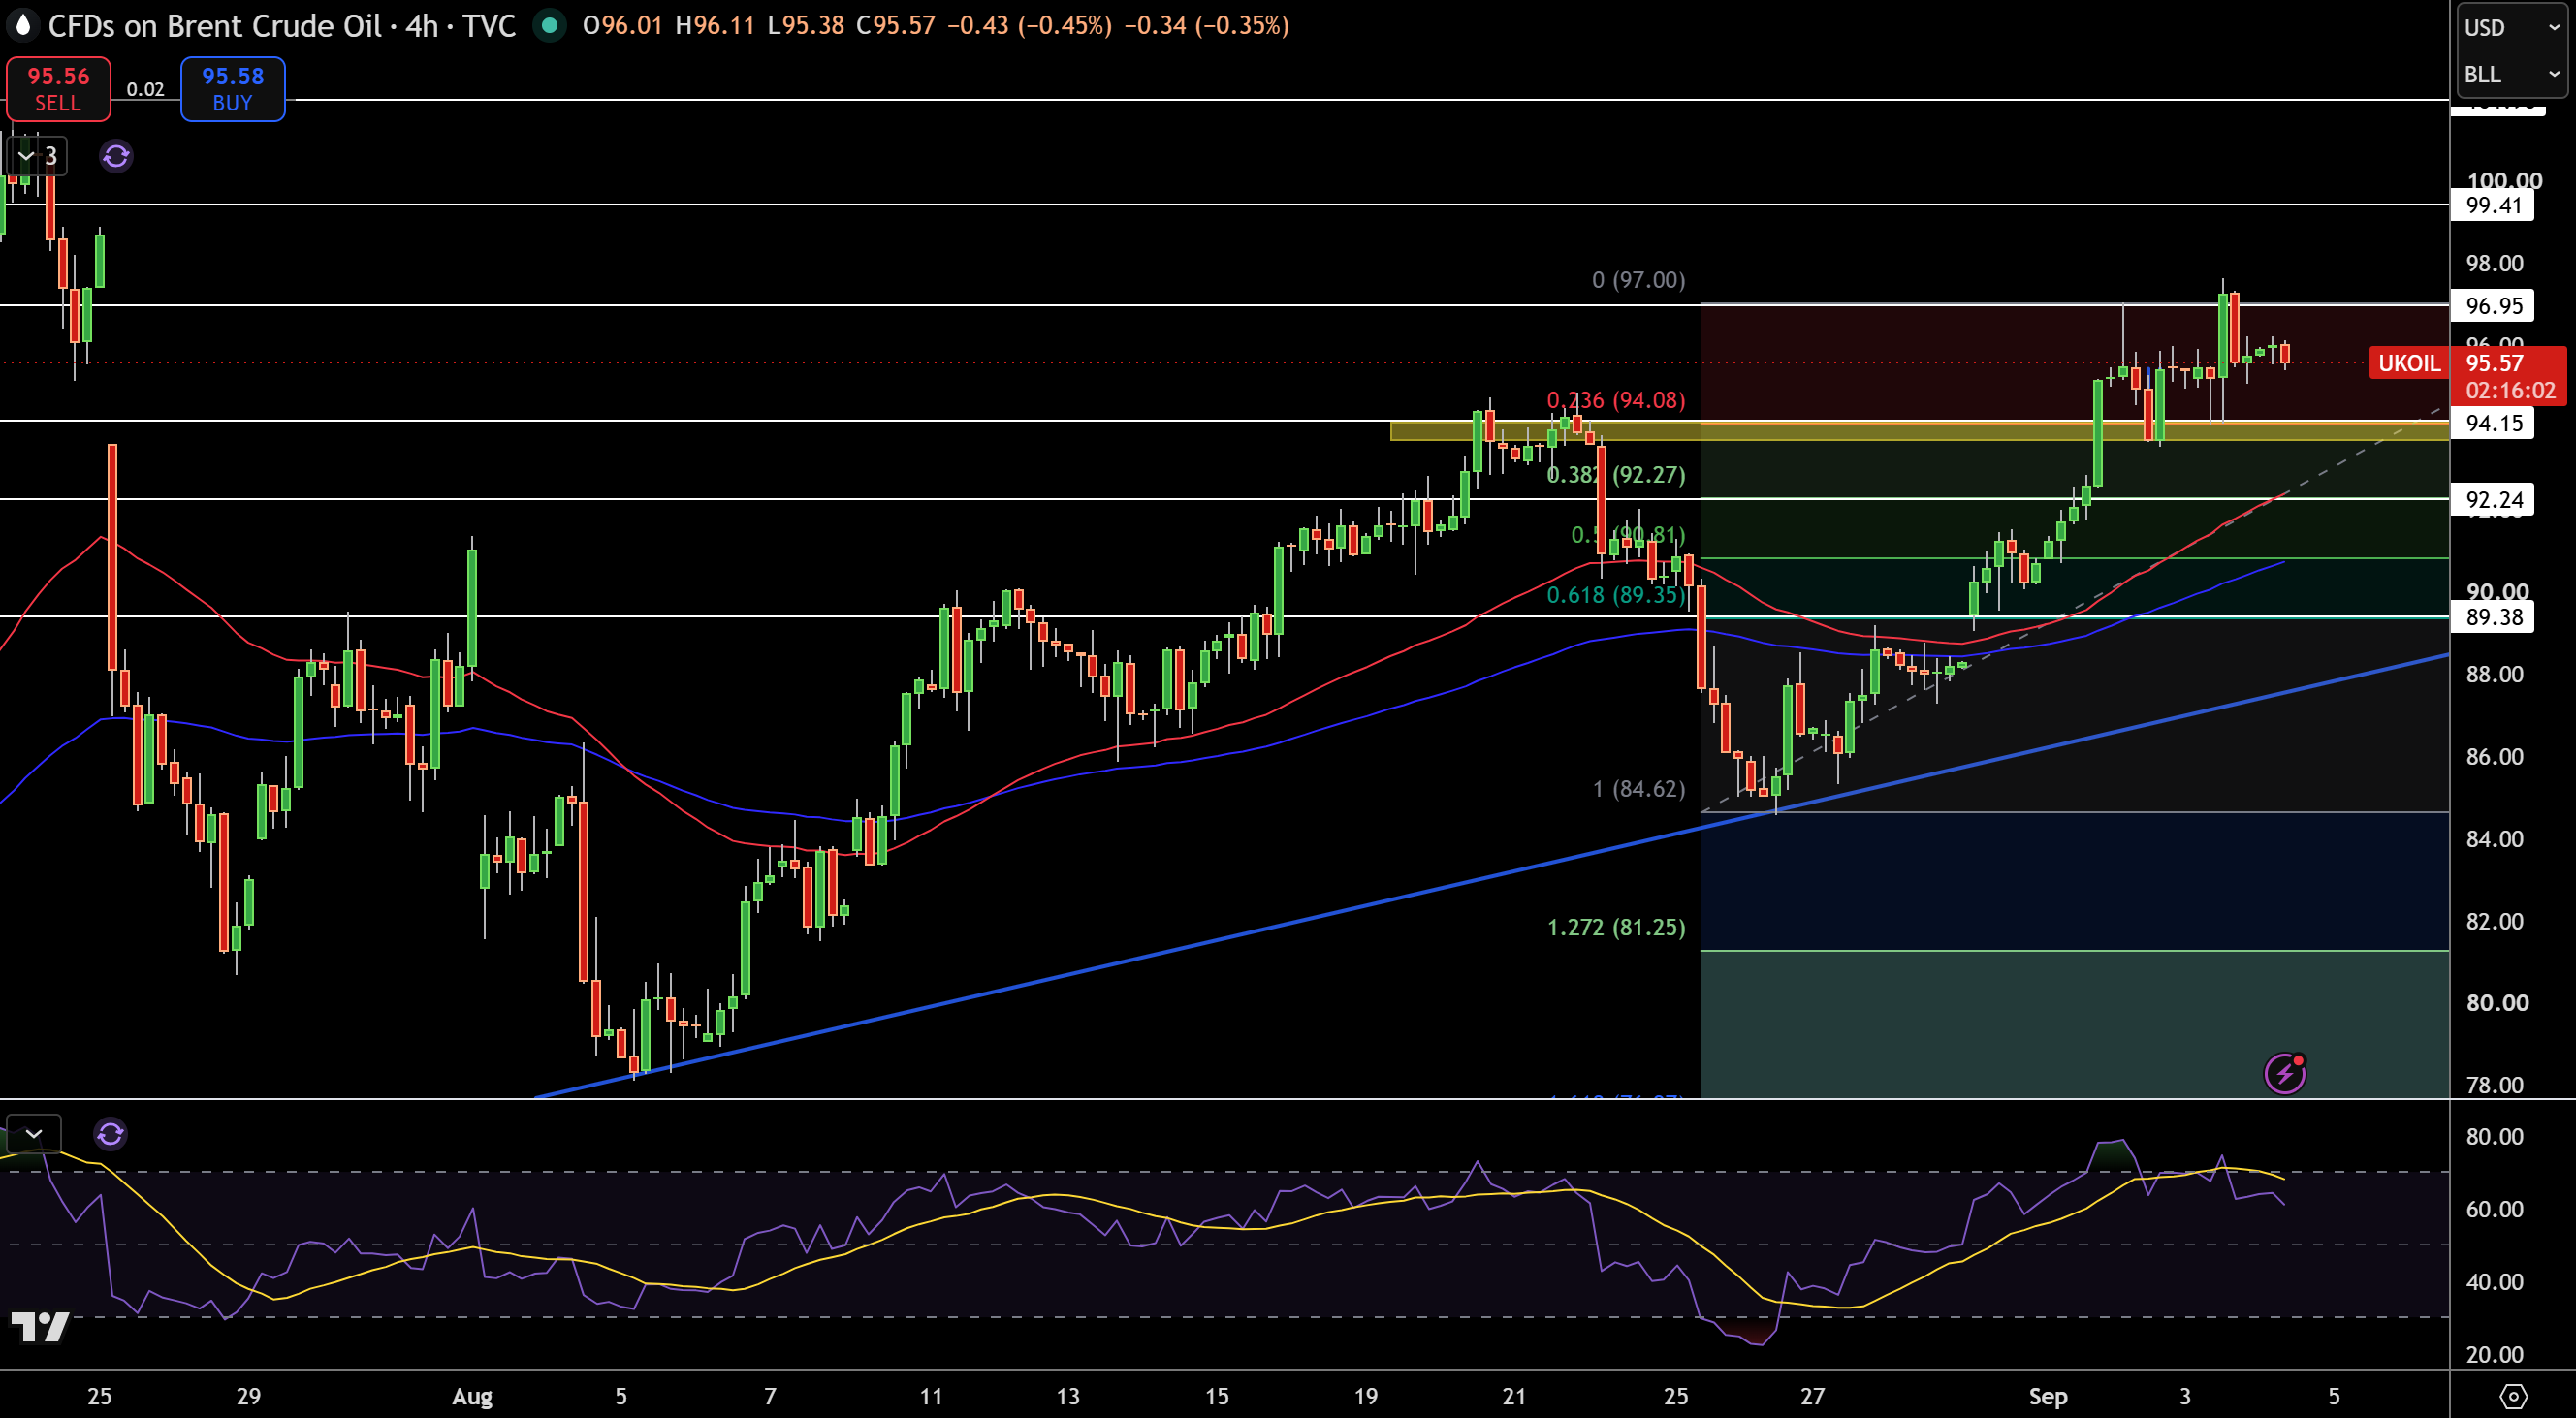
Brent crude is trading around $95.57 on the 4-hour chart, having bounced back strongly from the $84.62 swing low. What interested me is how price continues to consolidate above the $94.08 – $94.15 support zone. This zone was broken as resistance, and thus, continues to support the broad recovery structure.
For the meantime, $96.95 remains the level to watch for resistance, and we would expect buyers to take this level out and target $99.41 and then $101.96. Should price break below $94.15, we have $92.24, $90.81, and $89.38 as support levels. As price is trading above the rising moving averages, this bullish structure remains intact.
The RSI has backed off from overbought territory ; thus, price is consolidating, not collapsing. As long as Brent remains above $94.15, I will remain generally bullish. A break below $92.24 would be bearish, and a break above $96.95 would continue the bullish structure.