


$94 Target Comes Into View
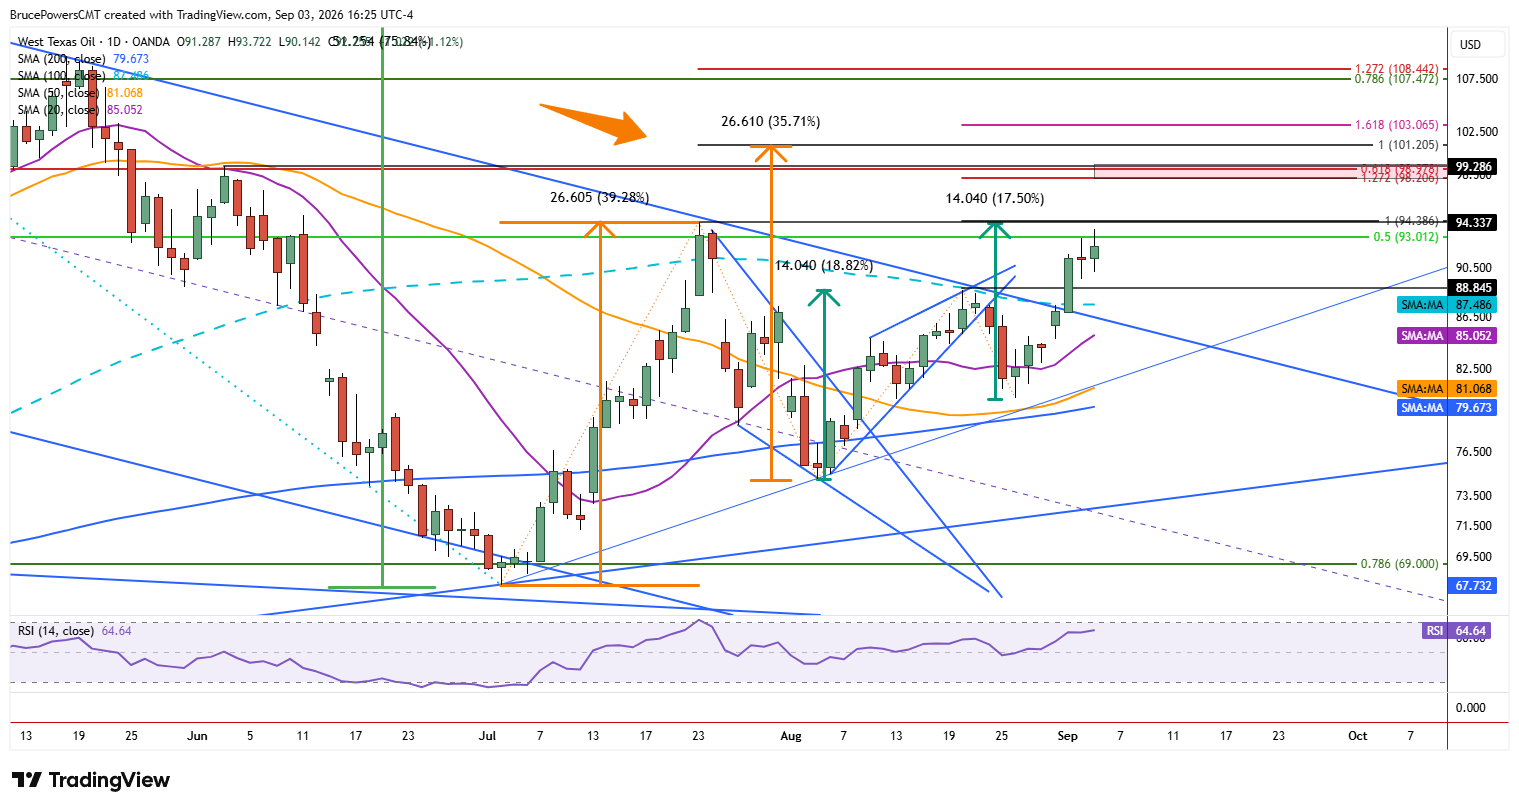
WTI crude oil extended gains on Thursday, reaching a new high of $93.72 and getting close to the next upside target zone near $94.34 to $94.39. That price zone is derived from the lower swing high from July and a 100% measured move projection for the short-term upswing, respectively. Given this week’s trendline and 100-day moving average upside break, that price zone is anticipated to be on the way to a higher resistance confluence zone and beyond.

Bigger Breakout, Bigger Potential
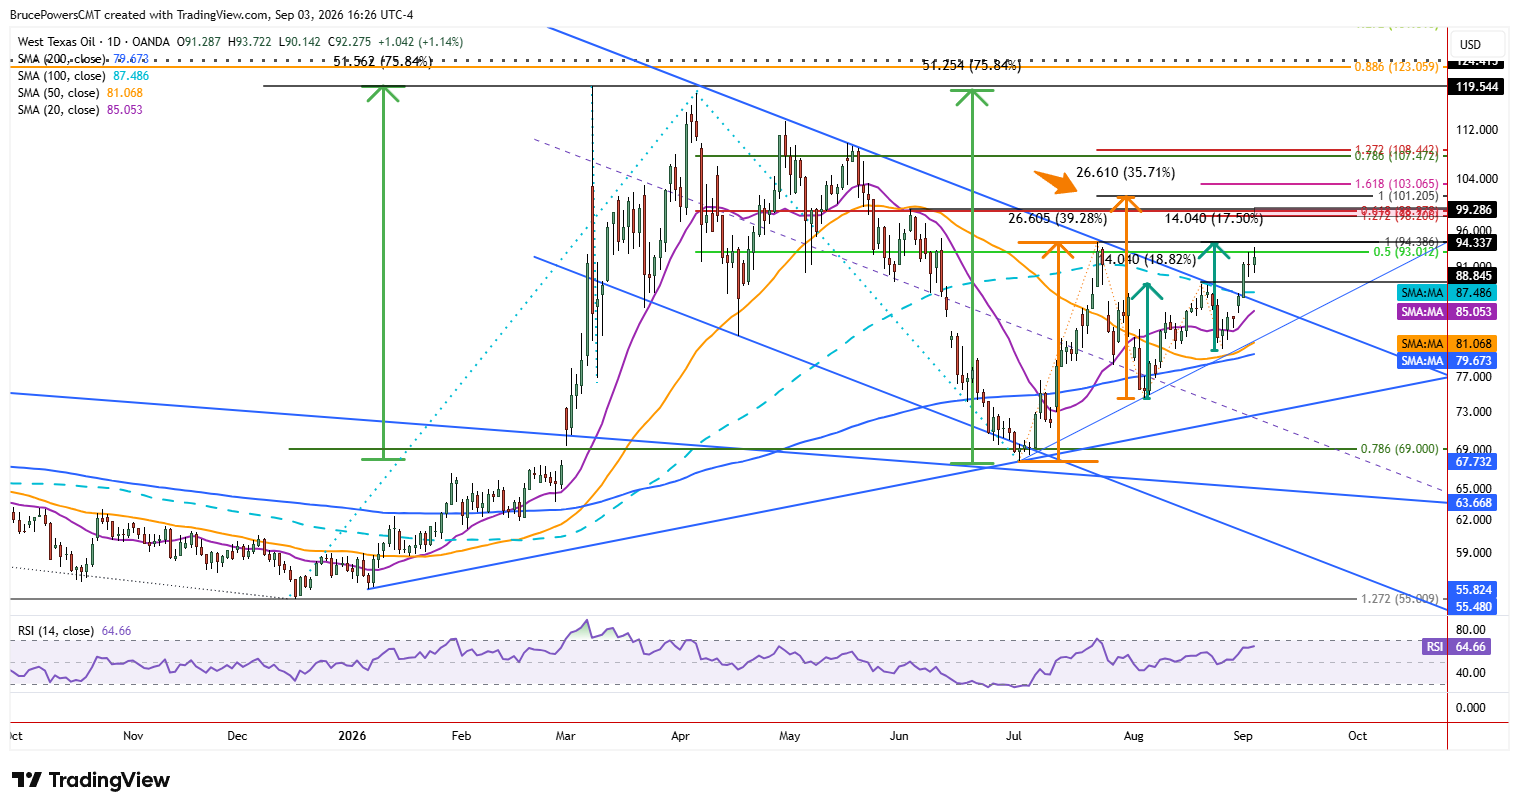
For perspective on this breaks channel breakout, consider the larger developing pattern in crude oil that shows the potential for higher potential resistance areas to be tested. This week’s advance adds to the technical evidence that the recent bearish correction has completed, and a new move up begun. The recent correction was in response to a long-term bullish breakout of a multi-year falling wedge pattern that triggered in March, resulting in a sharp advance of approximately 75.8% to a high of $119.54. A large falling channel followed, with an upside breakout triggering on Tuesday.
Compression Inside Wide Channel
One concern is that the channel is relatively wide and does not show a tight pattern channel overall. That is correct but within the channel there are basically two pieces to the pattern. A symmetrical triangle formed at the top of the channel and one recently near the bottom. Those smaller consolidation patterns show the compression of price that awaits a breakout signal for a spike in momentum.
Breakout Reclaims Key Average
The channel breakout on Tuesday also reclaimed the 100-day moving average at the same time and triggered the recent symmetrical triangle. This adds to the significance of the breakout. Over the past couple of months, the 100-day moving average confirmed as resistance twice during rallies. Consequently, there is an implication that buyers are in control and should retain control after a first pullback completes. Key potential support zones during weakness include the recent swing high at $88.64, the 100-day moving average currently near $87.48, which is near Monday’s high of $87.42.
If you’d like to know more about how to trade crude oil, please visit our educational area.



