Gold Reclaims Key Near-Term Resistance
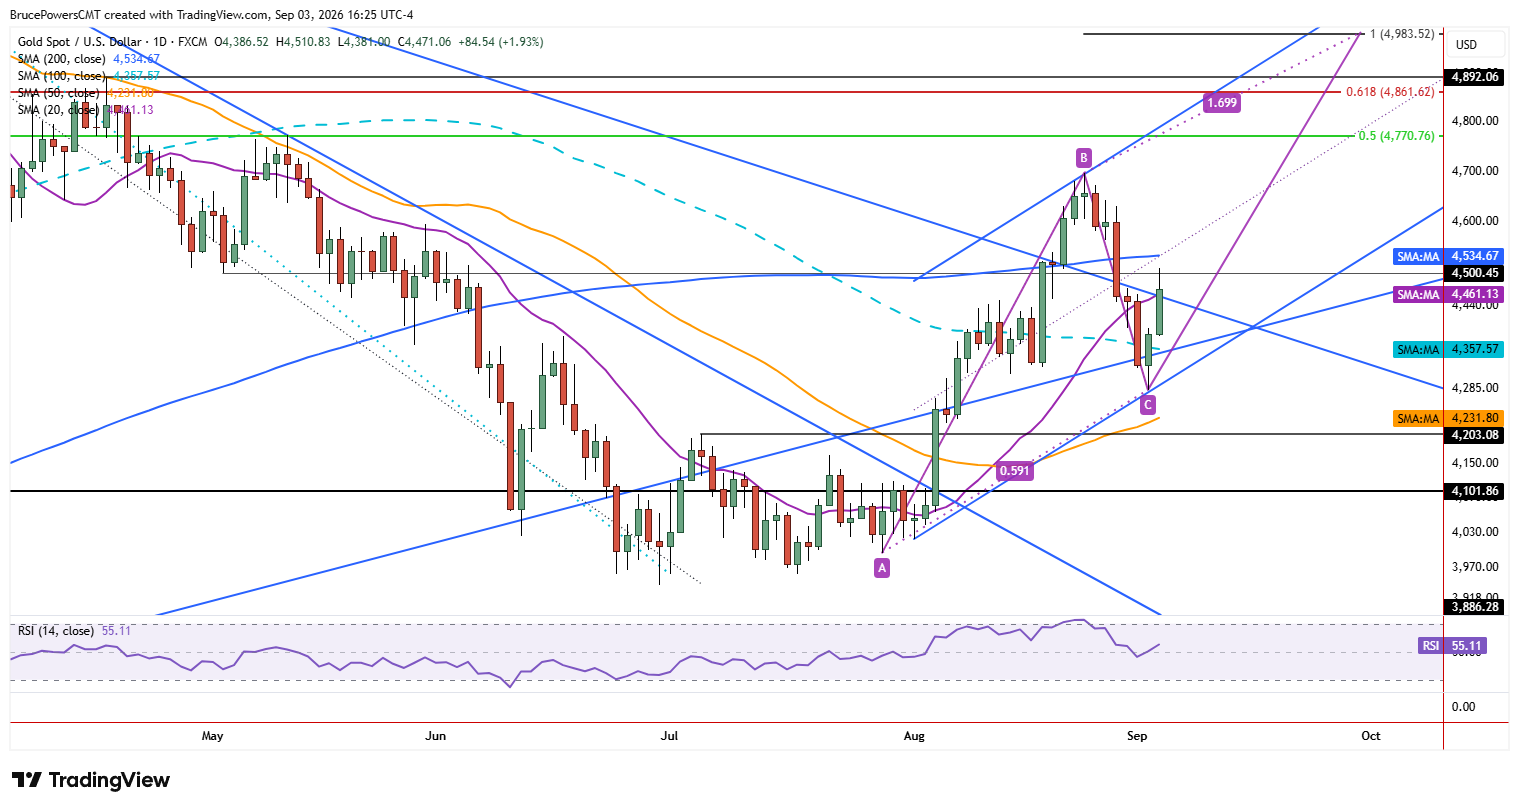
Gold advanced above a key near-term resistance zone on Thursday, reaching a four-day high of $4,511 and rising above the downtrend line and 20-day moving average. A break above the downtrend line triggered last week but did not confirm as resistance during the subsequent pullback that fell below the line.
Nonetheless, a second recovery of the trendline is bullish, especially when it occurs with a reclaim of the 20-day moving average at $4,461, concurrently. A daily close above Monday’s high of $4,472 would confirm the near-term bullish signals.

Resistance Turns Into Support
Wednesday’s low of $4,282 is now a higher swing low, which is bullish. Consequently, Thursday’s advance confirmed support near the uptrend line after it had represented resistance for about a month recently. That switch from resistance to support is also bullish.
Next Test Could Shift Long-Term Outlook
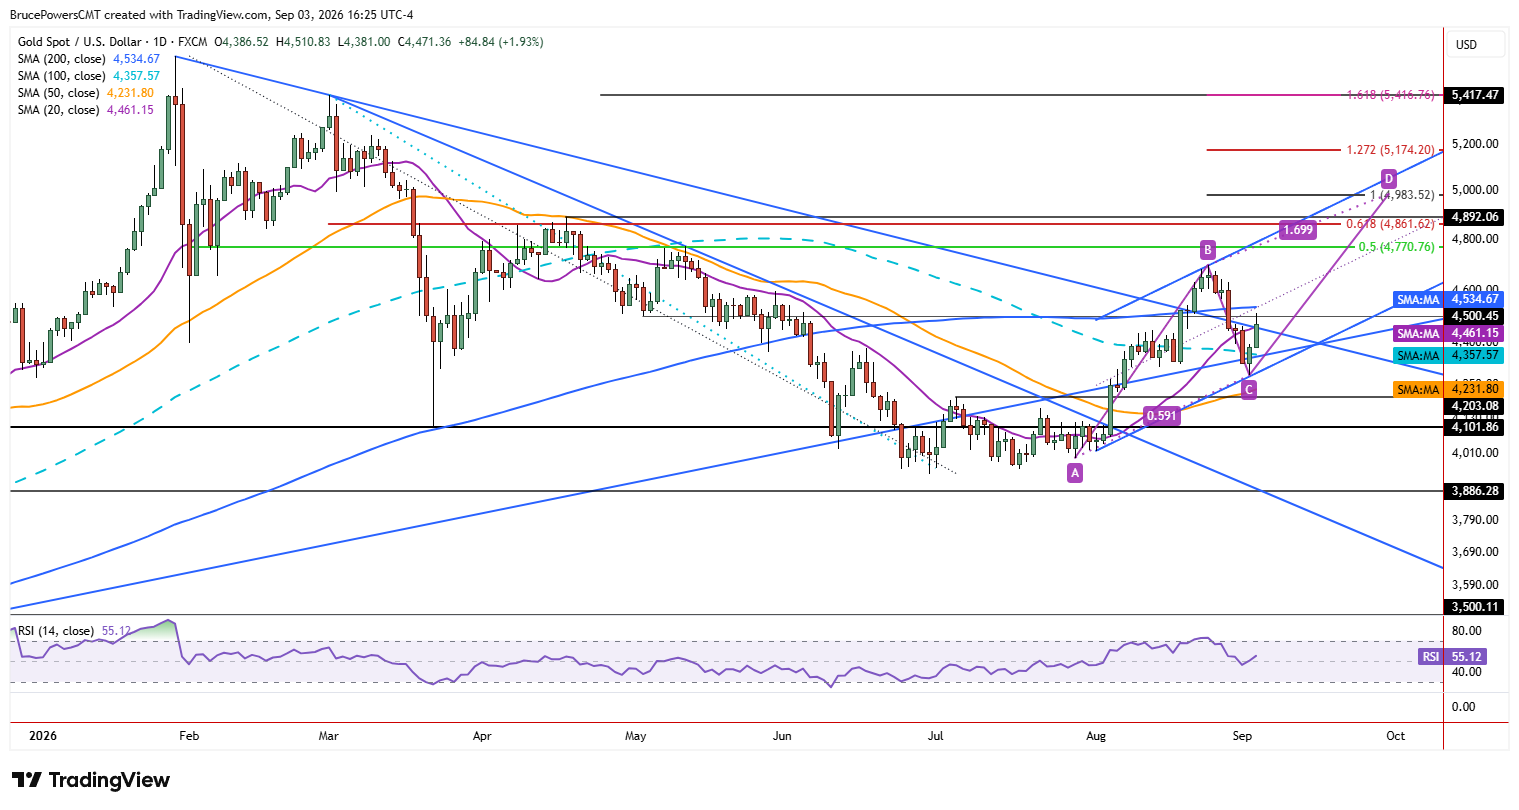
Altogether, recent technical signals show the possible beginning of an uptrend. If gold can now rise above and stay above the 200-day moving average near $4,534, the long-term picture should improve. That would likely lead to a continuation of the current advance above last week’s high of $4,697, thereby triggering a continuation of the developing advance.
ABCD Pattern Points Toward $4,984
With a new swing low, a potential rising ABCD pattern has formed, which shows an initial 100% projected target near $4,984. That is where there will be symmetry in price between the two legs up from the recent bottom. Typically, that projection identifies a minimum resistance target derived from the rising ABCD pattern. Given the potential upside indicated by the pattern, two lower targets become more likely to be reached.
There is the 50% retracement of the prior full decline at $4,771, and the 61.8% Fibonacci retracement at $4,852. Both of those areas are reinforced by a prior lower swing high, with the higher level showing greater significance given the series of lower swing highs in the prior downtrend.
Gold Price Forecast
Every new Gold analysis as it publishes, today's technical signal and key levels, live price — on one page.
See all Gold forecastsIf you’d like to know more about how to trade gold and silver, please visit our educational area.