Gold (XAU) and silver (XAG) continued to decline on Wednesday. Spot gold dropped to $4,290 and marked the lowest price since Aug. 7. Silver dropped to $63.60. Both metals were pressured by a stronger U.S. dollar and higher Treasury yields. The next clear direction is now the U.S. employment data to be released on Friday.
Oil prices also rose for the third day as tensions between the U.S. and Iran escalated. Brent oil rose over $95 and WTI oil rose over $91. Rising oil prices can help keep inflation high, which can force the Fed to increase interest rates. These risks have weakened gold’s safe haven reaction to the conflict.
The markets now expect 67% probability of a September rate hike. This is up from around 40% a week ago. Fed Governor Michael Barr also indicated that the Fed might have to hike rates if inflation does not slow down quickly. The ADP employment report is due today, followed by the nonfarm payrolls report on Friday. Weak employment data may introduce a correction in yields and support a recovery in gold and silver prices. But solid data could boost rate hike expectations and extend the current decline in gold and silver prices.
Gold Price Forecast: $4,220 Support in Focus Before US Jobs Report
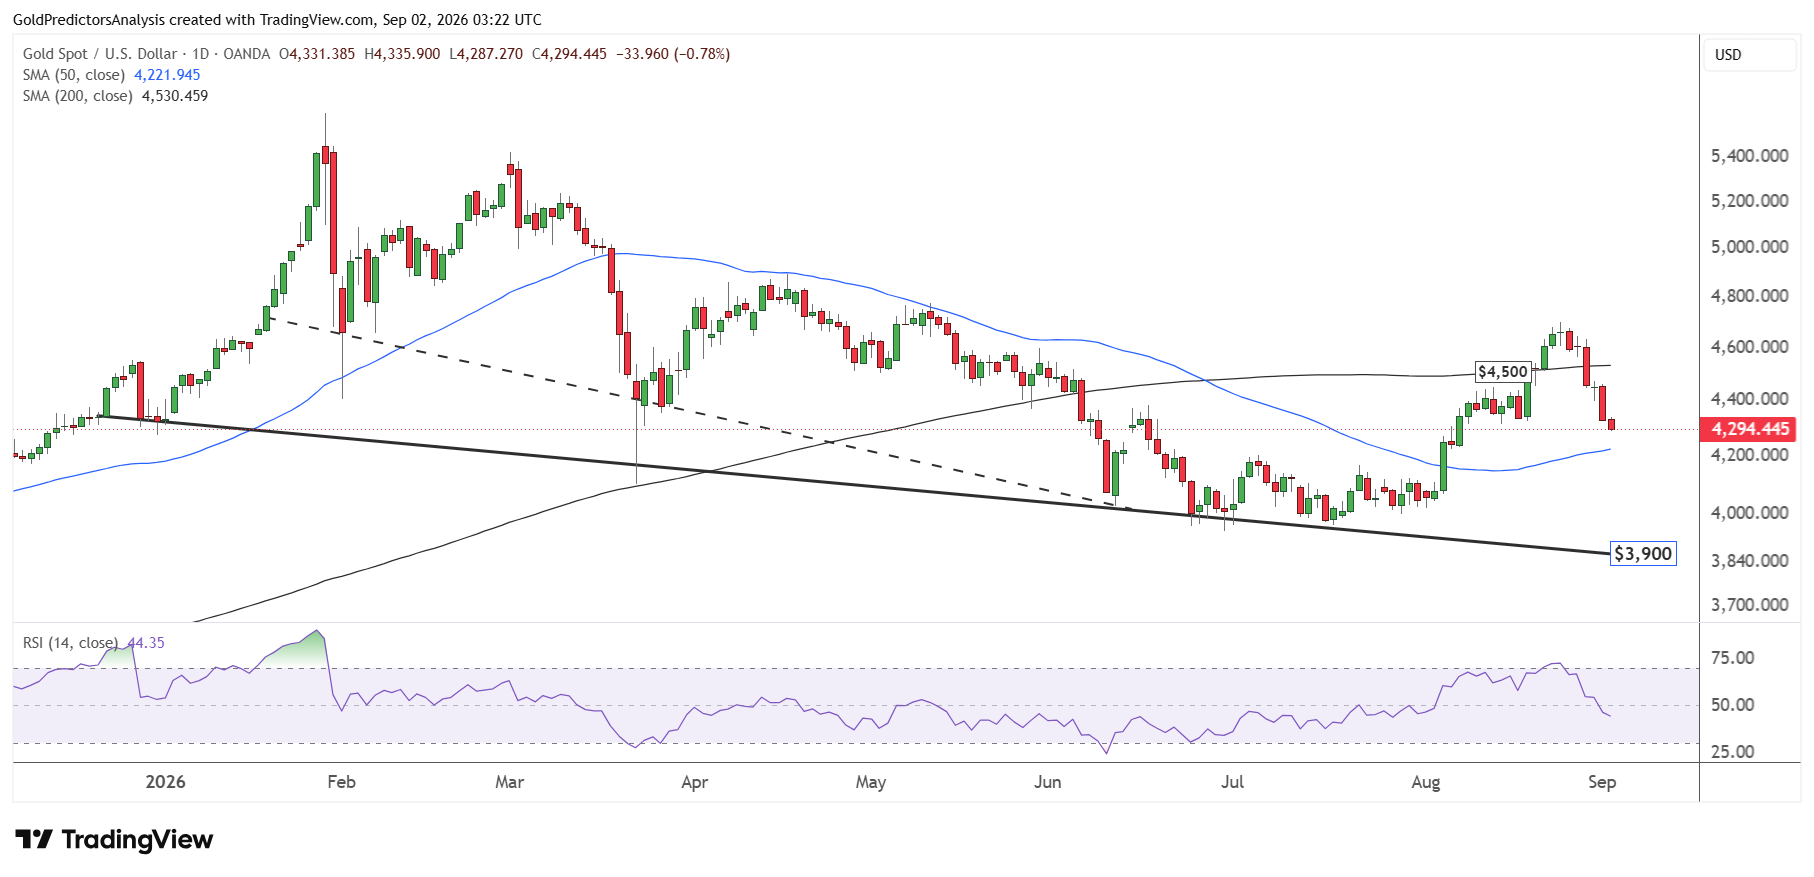
The daily chart for spot gold shows that the price has failed to break above $4,800 and continues to move lower. The immediate support remains the 50-day SMA at $4,220. A break below this level will likely open the door for another strong drop towards the $4,000 area. However, the key event for the gold market is the employment report on Friday. This data will likely drive the next short term move in the precious metals market.
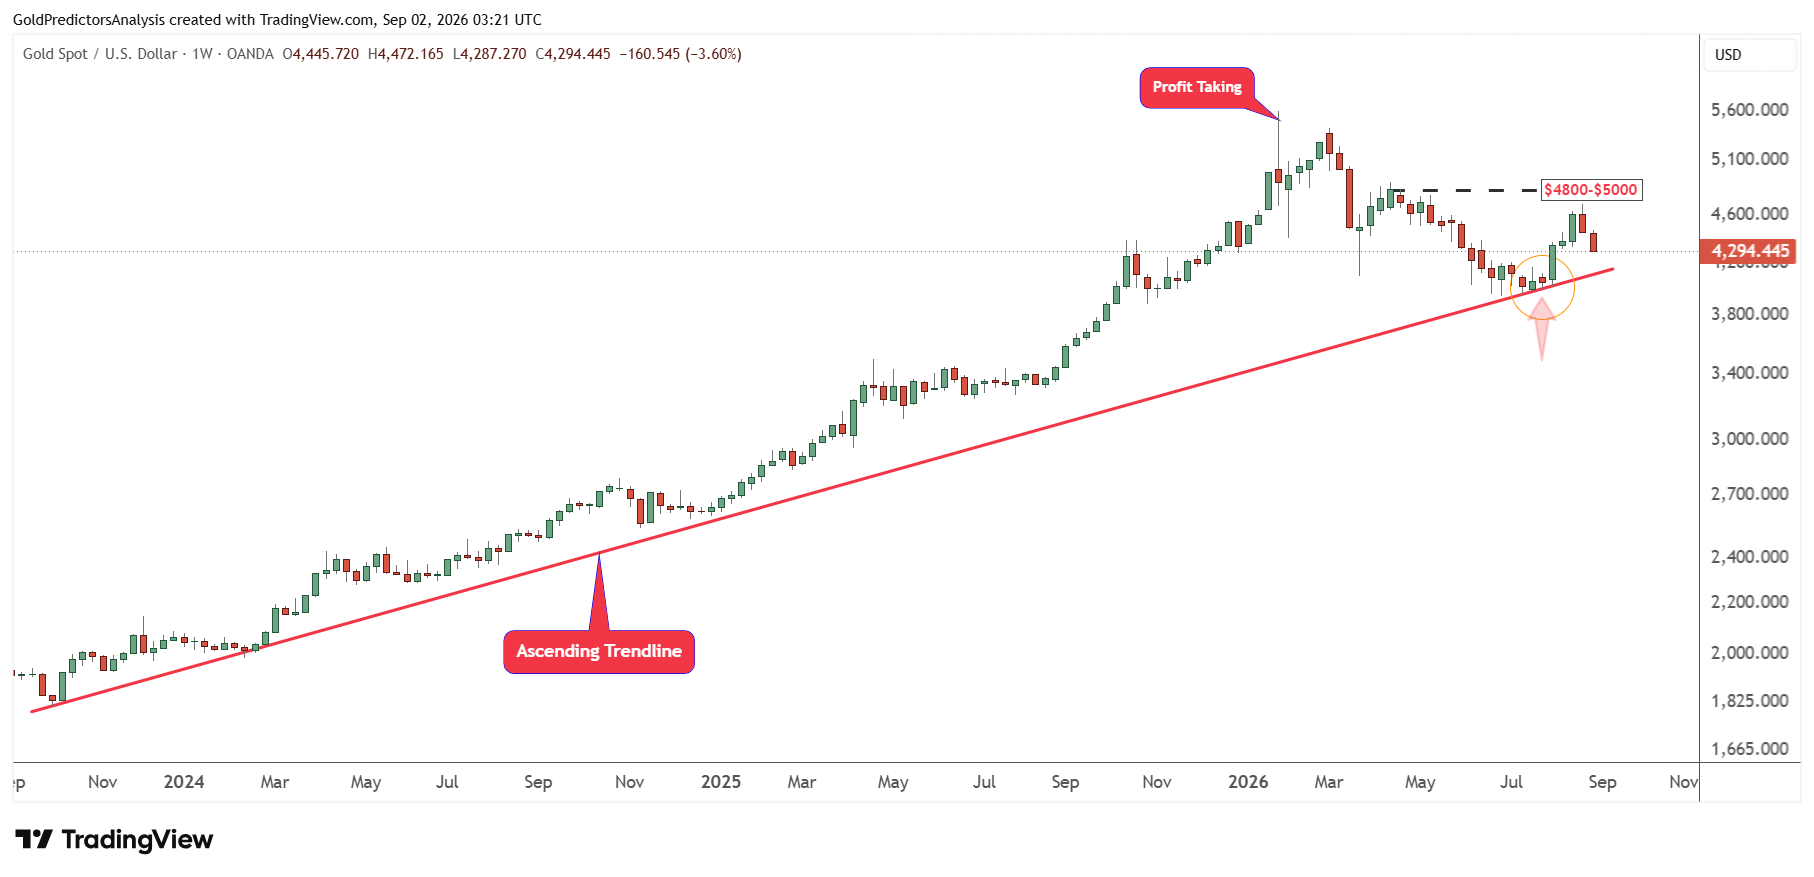
The negative price action in the spot gold market is observed on the weekly chart. The chart shows a failure at the key resistance area of $4,800. The price is moving again toward the ascending trendline support at $4,150. If the price drops again towards this zone and recovers strongly, it will likely form a strong bottom around this level. But a break below $4,000 will likely open the way for another strong drop towards the $3,500 area.
Silver Price Forecast
Every new Silver analysis as it publishes, today's technical signal and key levels, live price — on one page.
See all Silver forecastsSilver Price Forecast: $60 Support in Focus as Rate Hike Odds Rise
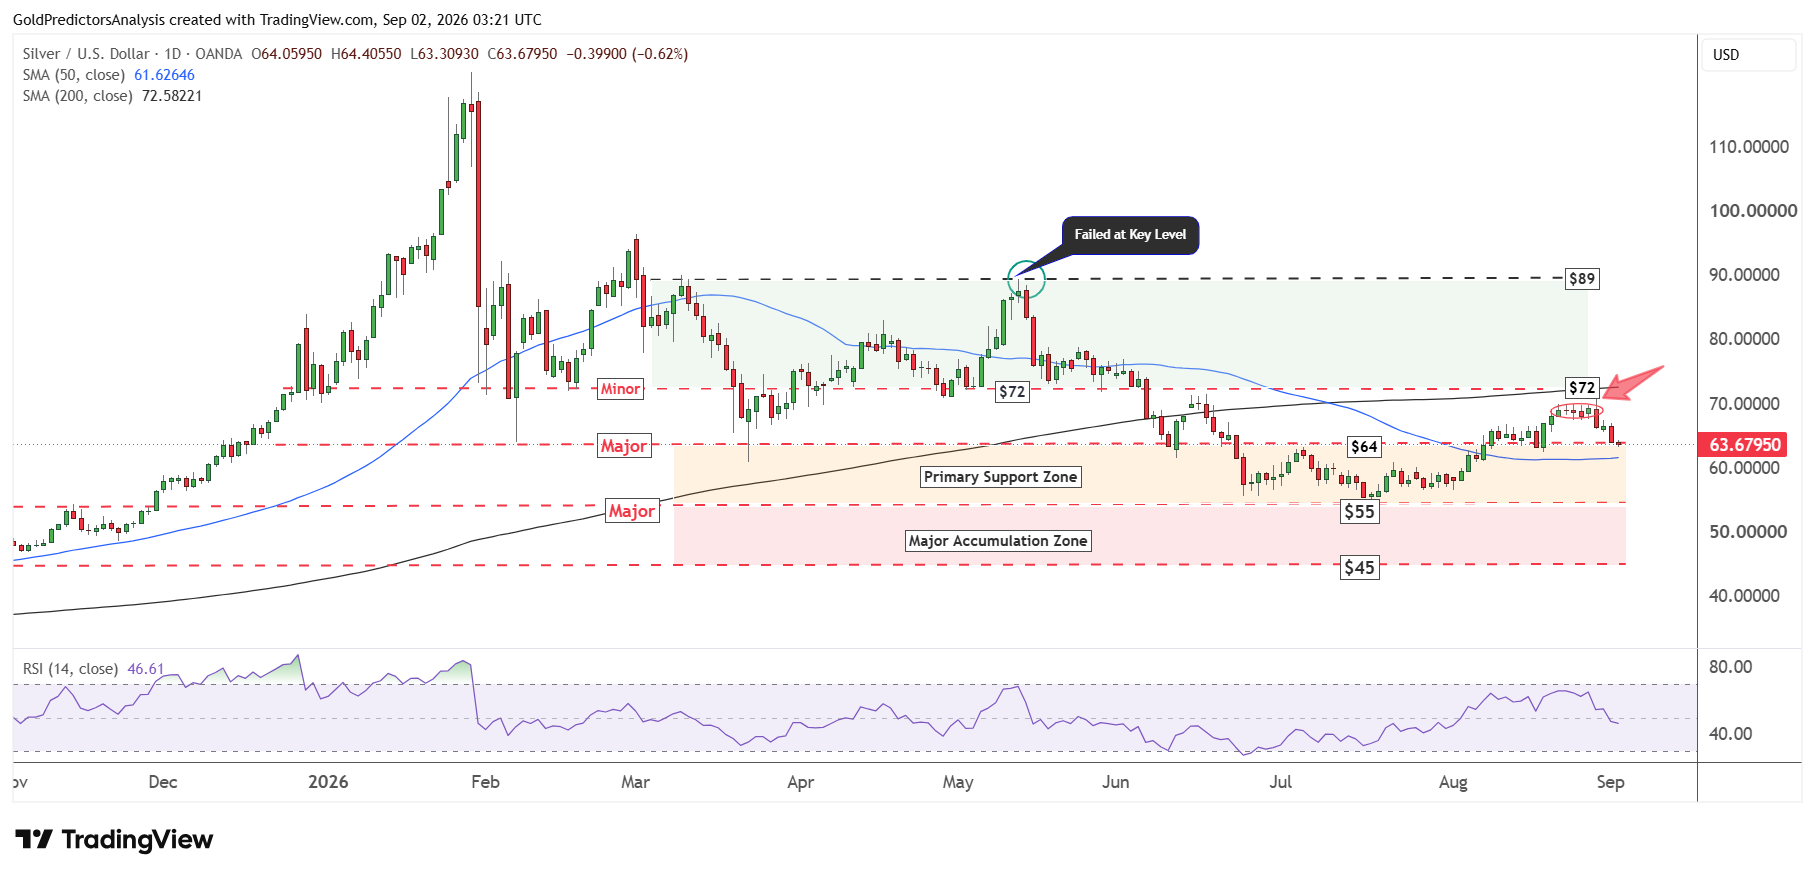
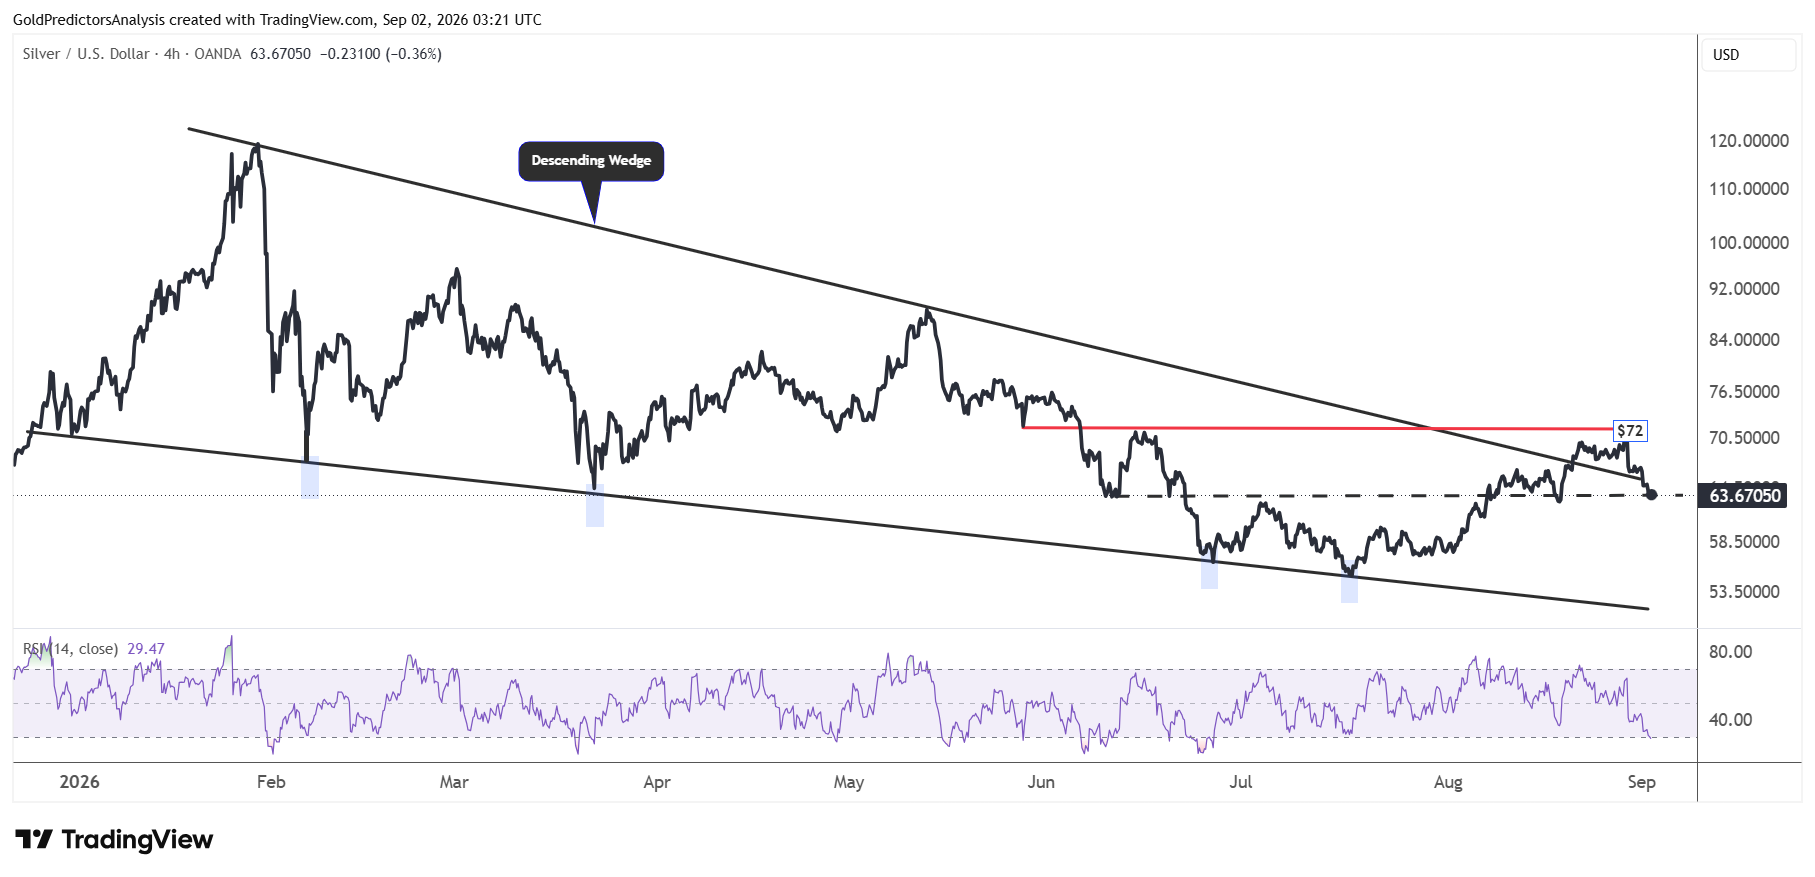
The daily chart for spot silver also shows strong resistance at $72. The price has now broken the $64 area. In the short term, the immediate support remains the $60-$61 region. A break below this level will likely trigger strong drop towards the $55 area.
The price is still above the major support zone between $45 and $55. If the price recovers and breaks above $72, it will likely confirm the bottom and continue higher.
The failure at the $72 resistance is evident on the 4-hour chart. The chart shows that the price broke the descending wedge pattern but failed to break above the key level of $72. The price has again moved below the descending wedge pattern, which indicates neutral price action. But a break below $60 may tilt this neutral movement towards bearish price action in the short term.
Gold and Silver Price Outlook Ahead of US Jobs Report
Gold and silver remain under pressure as the stronger U.S. dollar, higher Treasury yields and rising rate hike expectations weaken demand. The employment report on Friday will likely decide the next move. Weak data could pull yields lower and support the recovery in both metals from their support zones. But strong data could push gold below $4,220 and silver below $60. Gold must break above $4,800, while silver must clear $72 to restore bullish momentum. Until then, the short term outlook remains weak and price volatility may stay high.
Read more: Will $4,300 Support Hold Amid Fed Rate Hike Fears?