



The Nasdaq Break Spread Beyond the Chip Trade
The Nasdaq came into Friday with the chip trade already under pressure. It left the session with the selling spreading through AI infrastructure, rising volatility and another inflation problem from oil.
China competition is hanging over memory stocks. CoreWeave made the cost of financing AI capacity impossible to ignore. None of that gave Nasdaq buyers a reason to step in before the weekend.
At the close, the Nasdaq Composite settled at 26,140.03, down 572.99 or -2.15%.
The index lost more than 4% for the week, its worst weekly break since June. This was not one bad session in a handful of chip names. The group that carried the Nasdaq higher is now being sold on several different arguments.

Daily Nasdaq Composite Index (IXIC) Technical Analysis
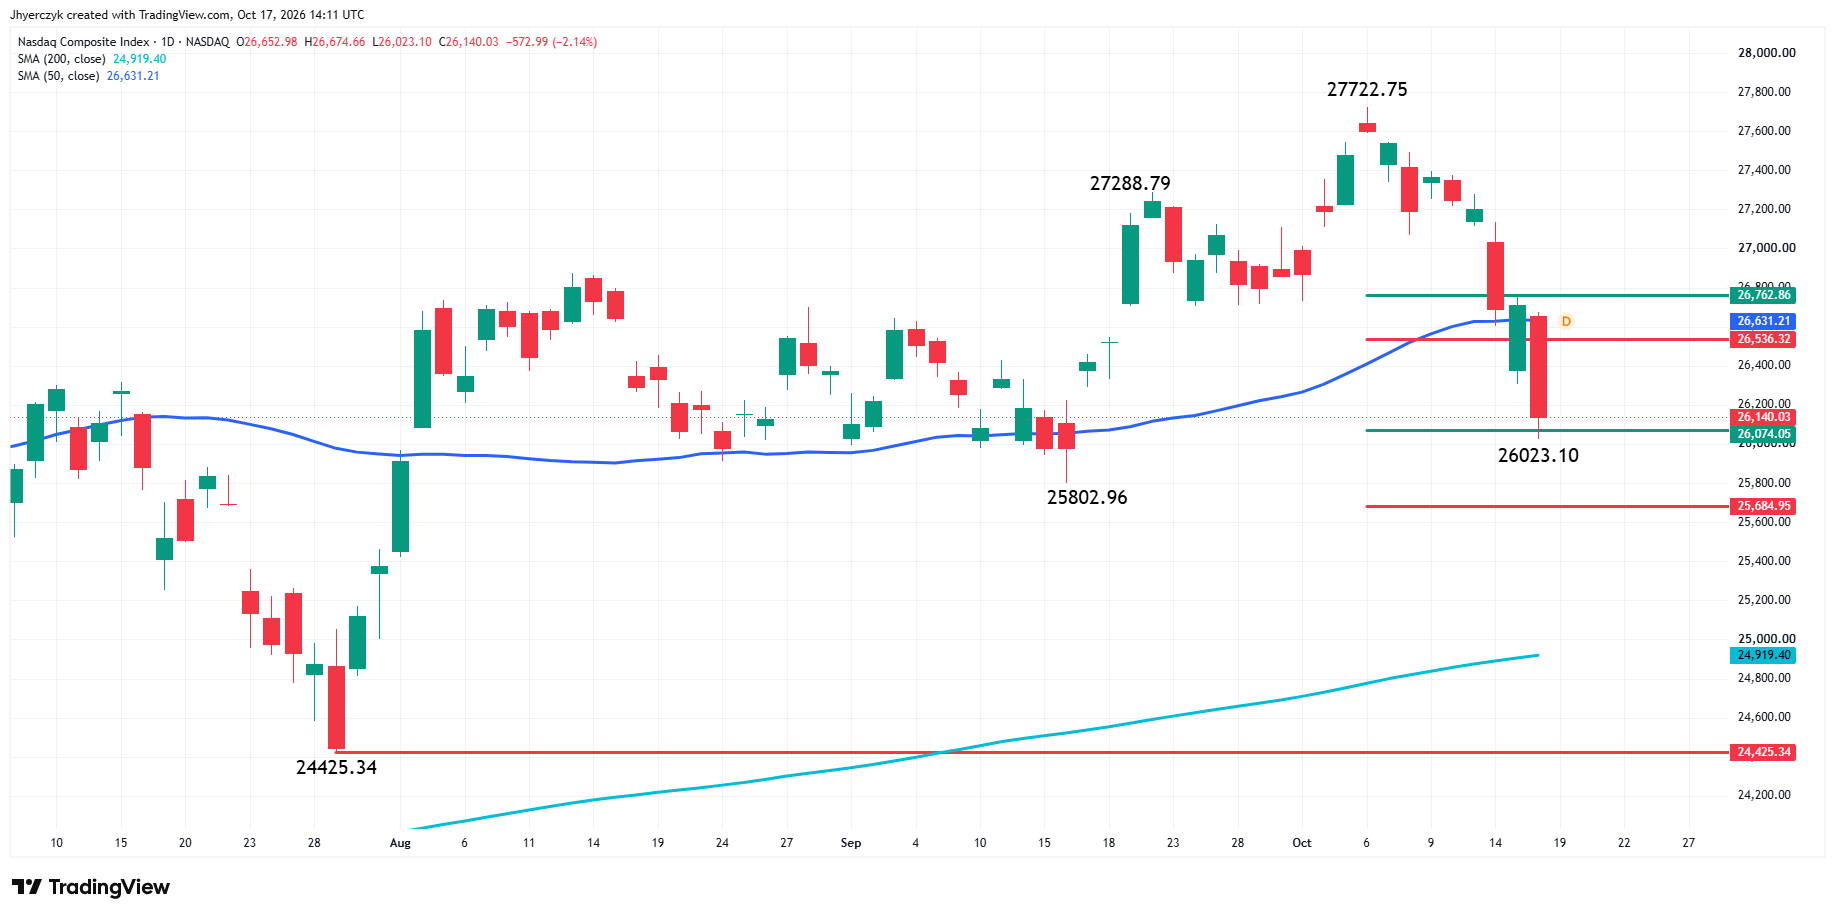
The Nasdaq Composite Index plunged on Friday, reaffirming its downtrend on the daily swing chart. Traders are now eyeing the next main bottom at 25802.96. The trend will change to up on a trade through the record high at 27722.75.
On the upside, resistance is the retracement zone at 26536.32 to 26762.86. Inside this area is the 50-day moving average at 26631.21. This trading tool is both resistance and a trend indicator.
The intermediate range is 24425.34 to 27722.75. Its 50% to 61.8% retracement zone at 26074.05 to 25684.95 was tested successfully on Friday when the market reached 26023.10 and rebounded slightly.
The main trend is down according to the daily swing chart. The market is trading on the weak side of a short-term retracement zone at 26536.32 to 26762.86 and on the bearish side of the 50-day moving average at 26631.21. All of these factors support my bearish bias.
NASDAQ 100 Price Forecast
Every new NASDAQ 100 analysis as it publishes, today's technical signal and key levels, live price — on one page.
See all NASDAQ 100 forecastsChip Sellers Were Still in Control
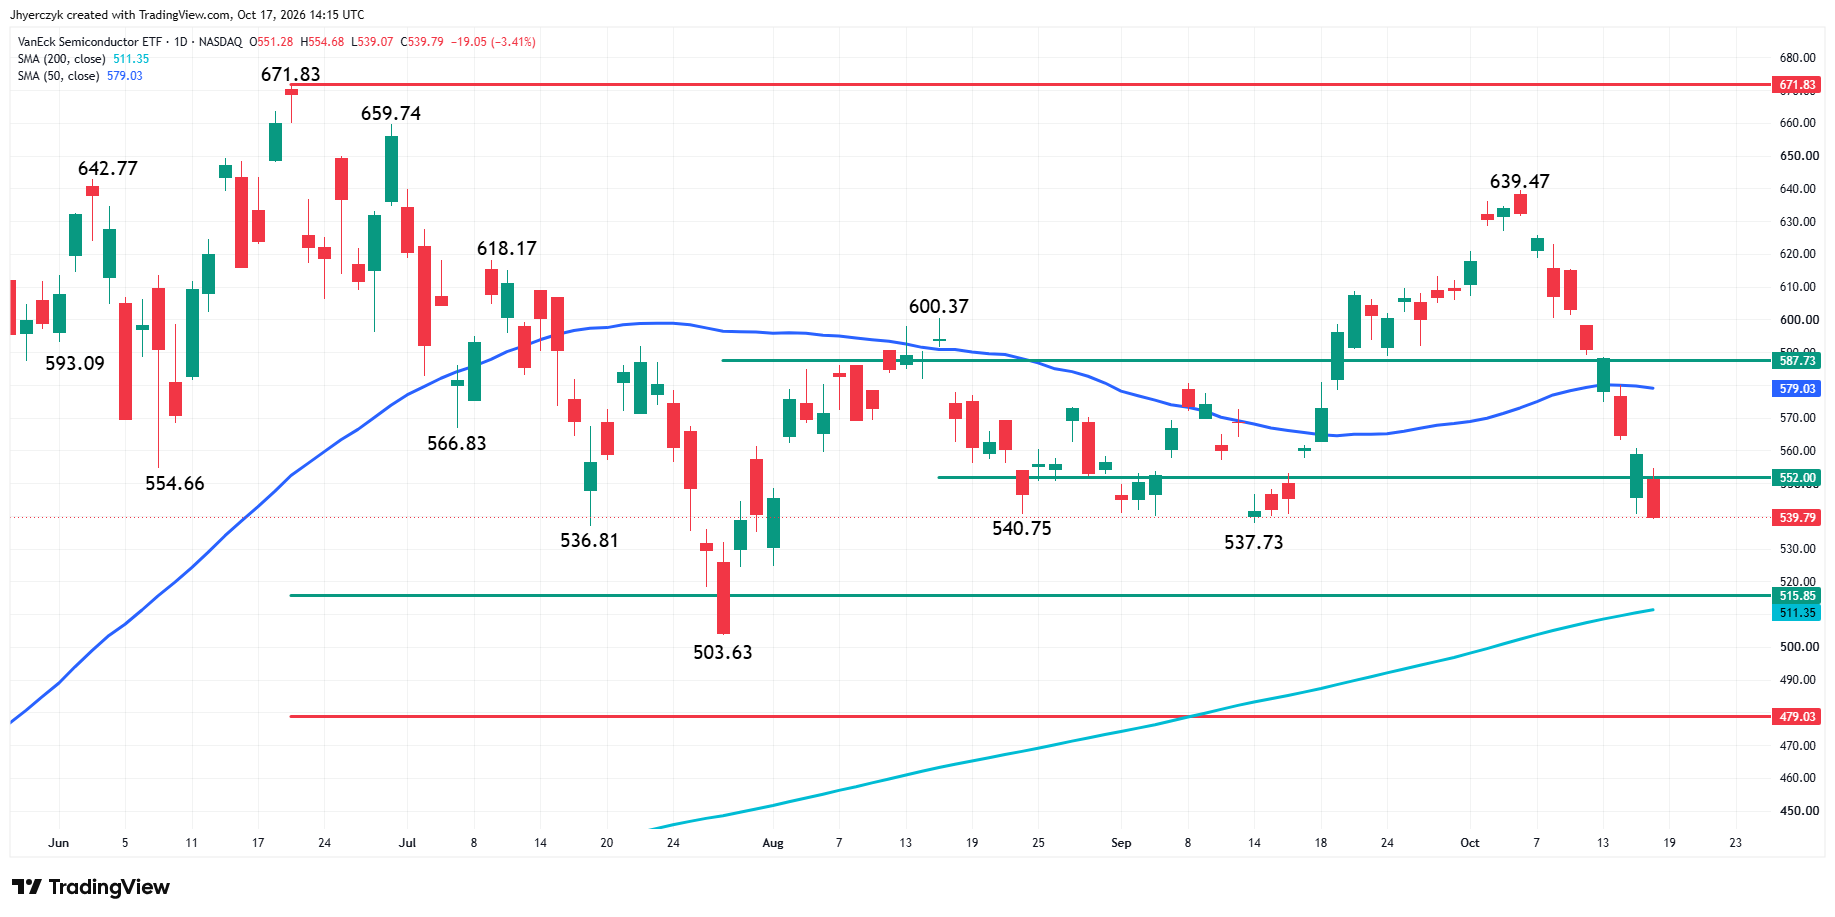
The semiconductor trade did not find a floor Friday. The VanEck Semiconductor ETF lost 3% and finished the week down 10%, its biggest weekly decline since April 2025.
Broadcom fell 3.6%. The PHLX chip index posted an eighth straight loss. Micron, AMD and Sandisk remained under pressure as traders kept looking at the supply side of the memory trade.
The group had a powerful run when AI demand was the only part of the story that mattered. That changed this week. China competition gave sellers something concrete to work with after a long run in the shares.
The Nasdaq recorded 263 new lows Friday and only 49 new highs. The break had moved beyond one company or one corner of the chip group. Sellers were working through the stocks carrying the biggest AI premium.
CoreWeave Became the Financing Trade
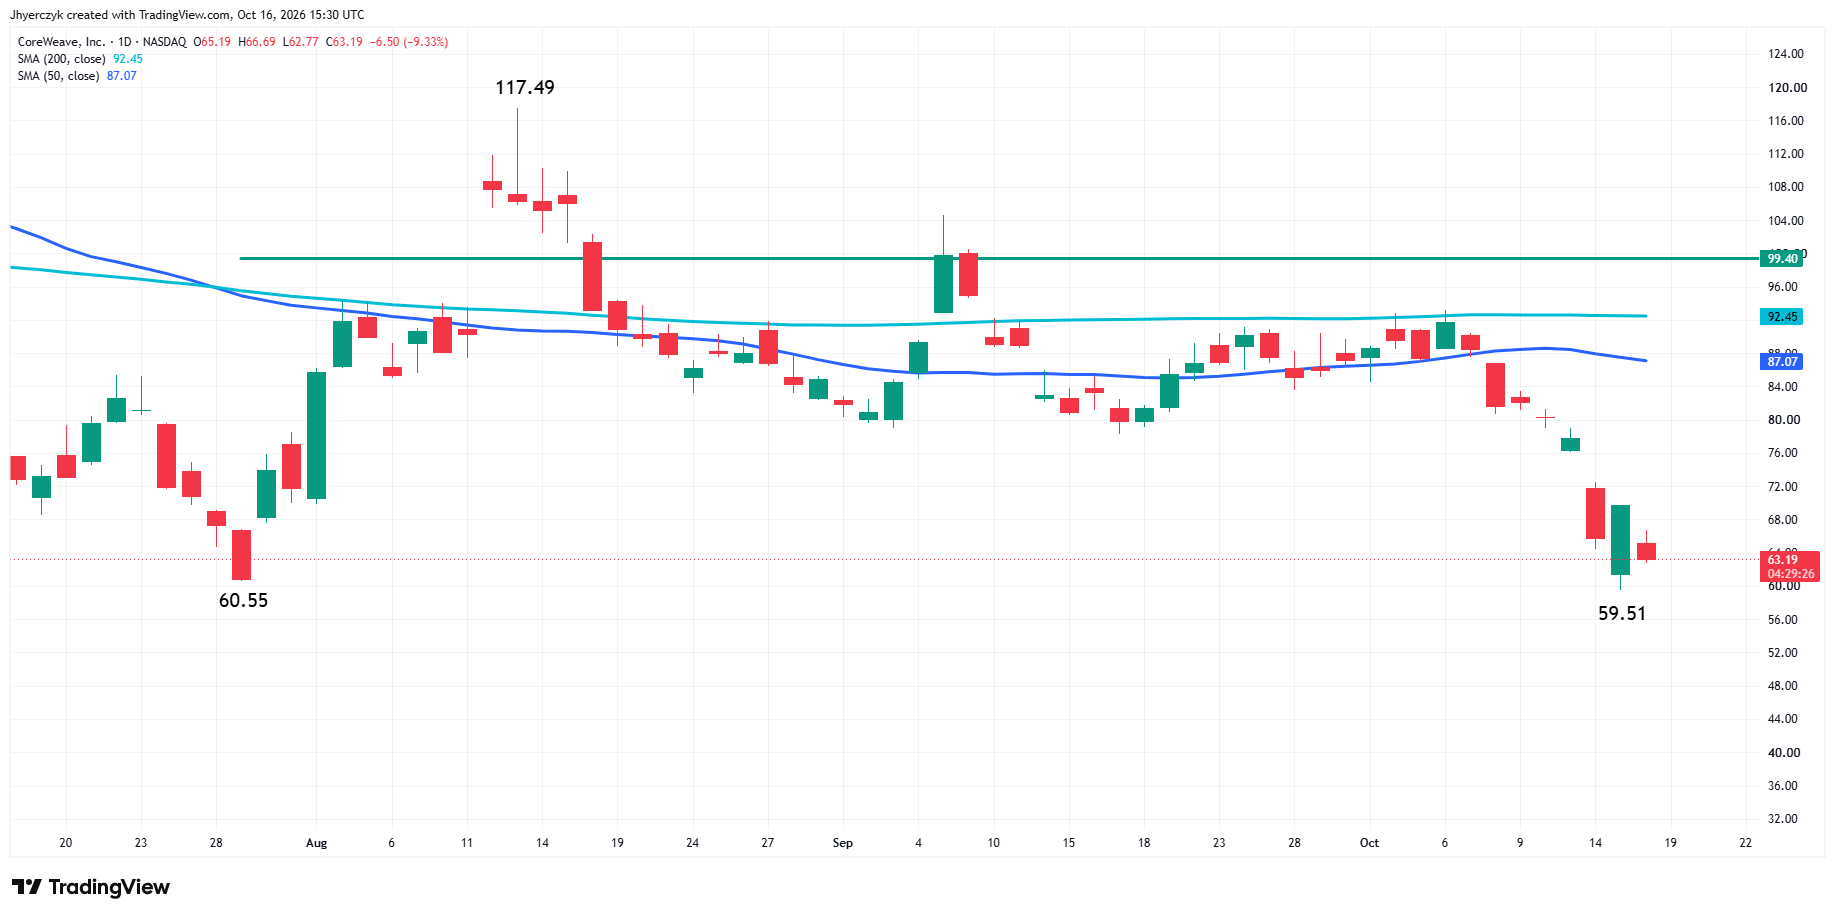
CoreWeave fell nearly 12% Friday and about 25% for the week. Its debt is above 51 billion dollars, while bond yields moved above 15% during the selloff.
The stock had been trading on the demand for AI computing power. It is now trading on the cost of building it. The demand story is still there, but the market is no longer giving the financing side of the trade a pass.
That is the part of the selloff that matters for the Nasdaq. Investors are not just cutting memory exposure. They are looking at which AI companies need capital and what that capital is going to cost.
The VIX Finally Joined the Selloff
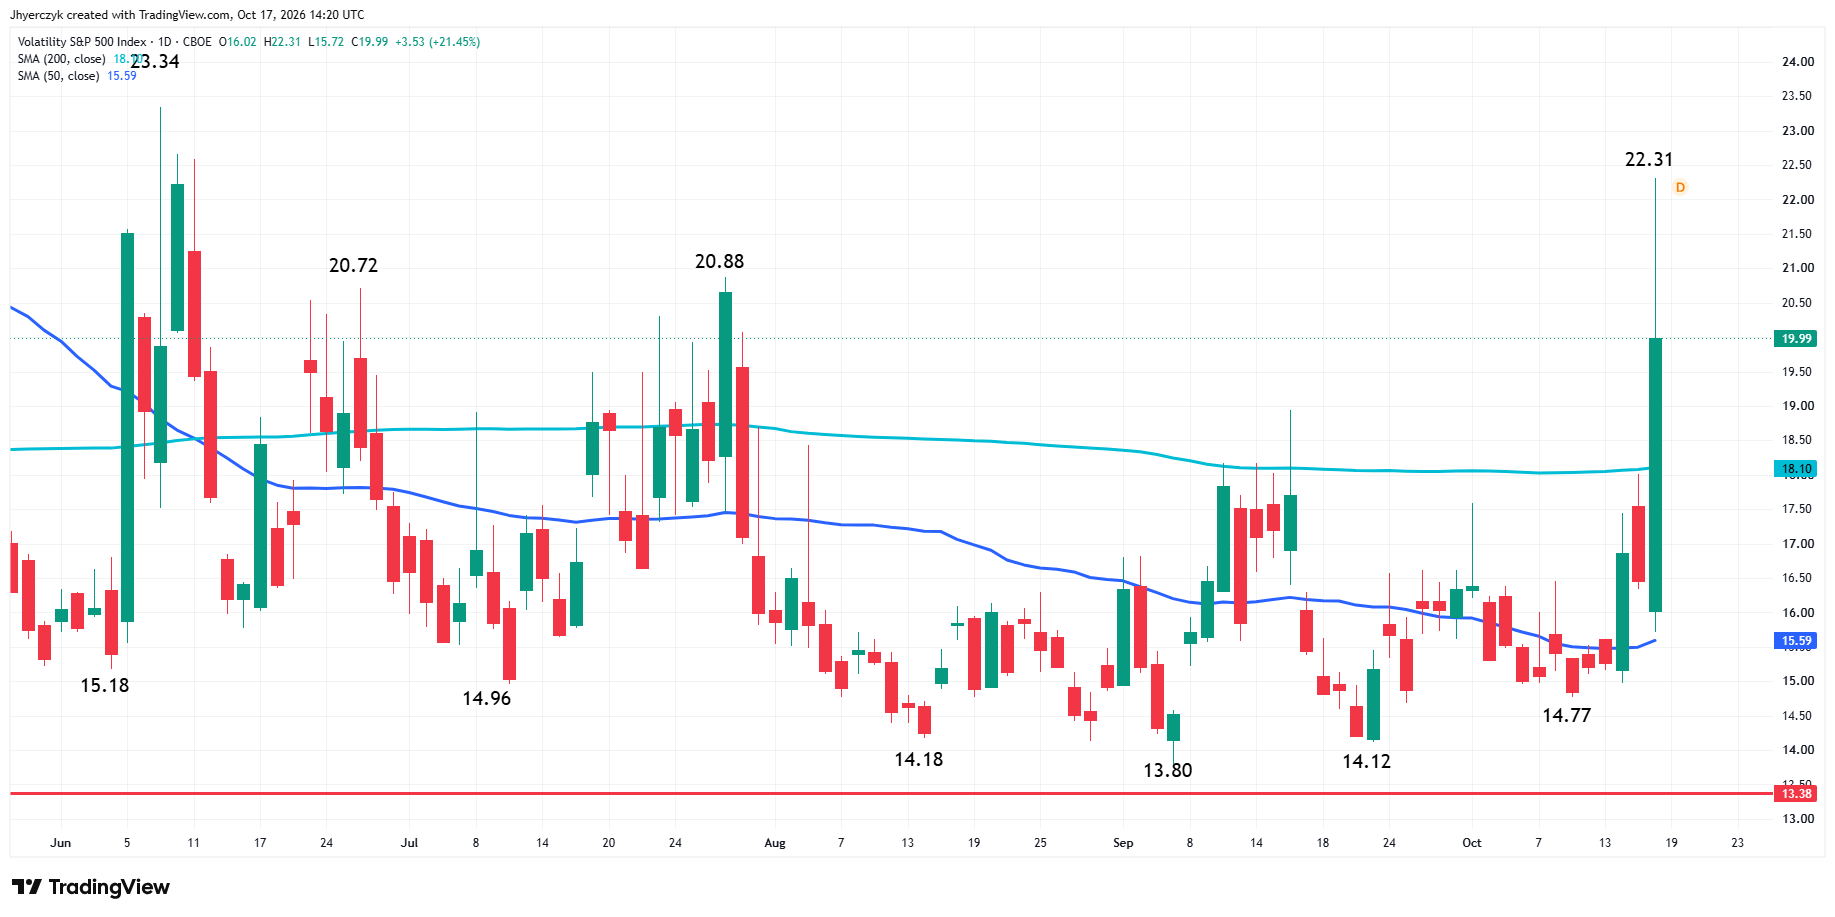
The VIX moved above 22 Friday for the first time in four months. It came after the Nasdaq had already broken below its 50-day moving average and chip stocks had been falling all week.
Volatility did not lead this move. It confirmed it. Traders were no longer treating the selling as a routine pullback after a strong run in technology.
What to Watch
Tesla and Meta Platforms report next week. The AI megacaps have been carrying the earnings story as well as the Nasdaq. Their numbers arrive after the market spent a week questioning the cost of the build-out.
The chip group needs to stop breaking before the Nasdaq can stabilize. CoreWeave put the financing problem in front of traders, while oil kept the inflation issue alive. Those are separate trades, but both are hitting the same part of the index.
The bias remains bearish with the Nasdaq in a daily swing-chart downtrend and trading below its 50-day moving average. Friday found buyers at the lower retracement area, but the rebound was small and the index closed on the weak side of the nearby zone. Sellers still control the trade unless buyers can take back that area and hold it.
More Information in our Economic Calendar.


