


Third Resistance Test Threatens Weekly Reversal
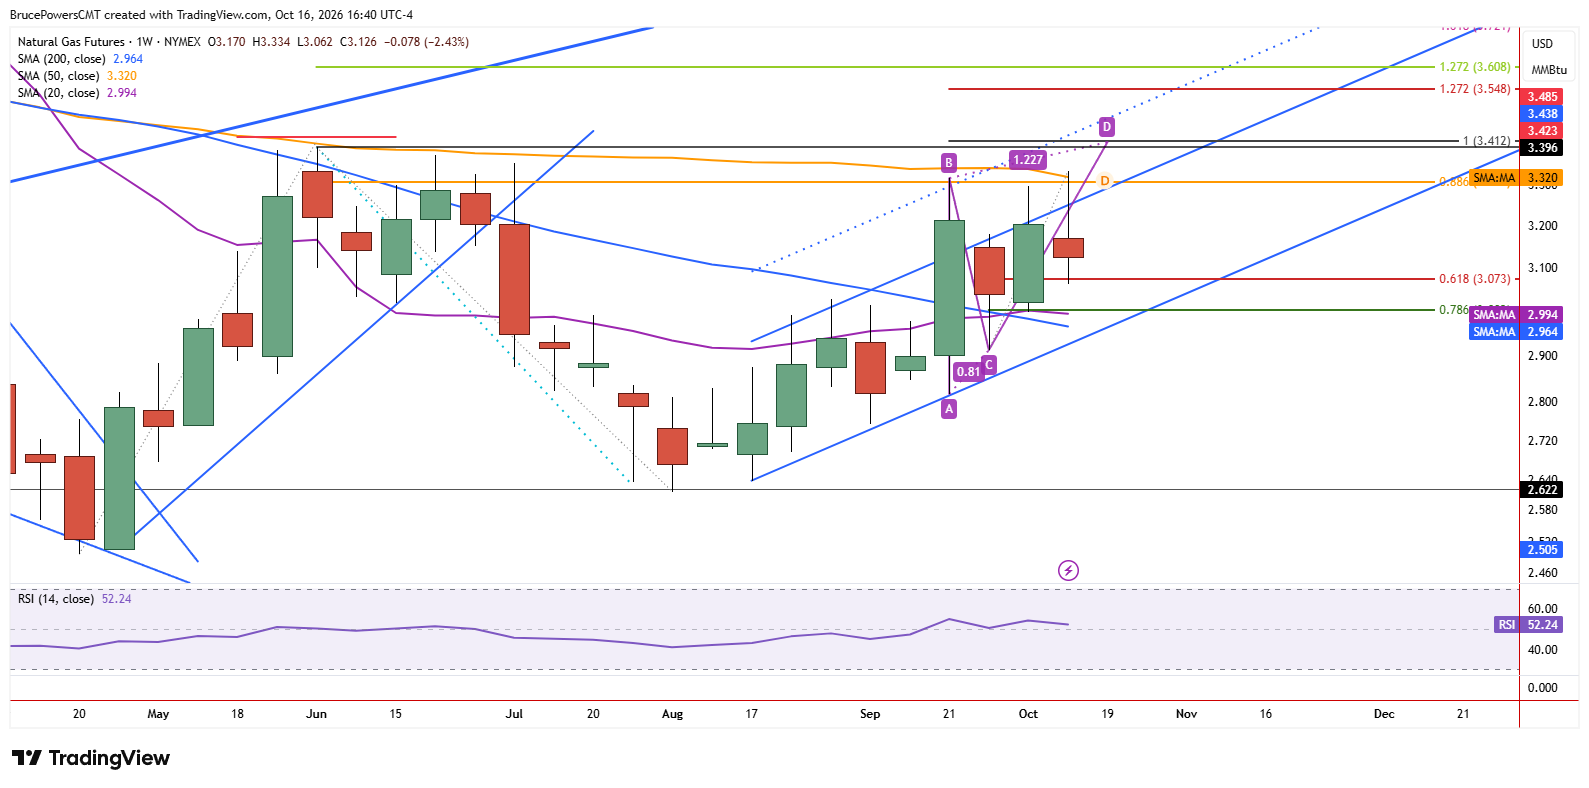
Natural gas is on track to end the week with a weekly bearish shooting start candlestick pattern, suggesting further downside if it triggers below this week’s low of $3.062. Notably, this week marked the third test of resistance near the 88.6% Fibonacci retracement level for the prior decline at $3.32 and the 50-week moving average, also near $3.32. The week initially showed promise by advancing to a new high of $3.334 and exceeding the prior highs of $3.298 from last week and the $3.317 high from three weeks ago.

Weekly Support Holds as Resistance Persists
Consequently, bearish weekly price action shows resistance being sustained near key resistance, suggesting that downward pressure may continue. Keep in mind that the recent highs were supported by resistance near the lower swing high of $3.396 from June. Weekly support is shown near last week’s low of $2.997 and the 20-week moving average, near $2.99.
Signs of strength were indicated last week as its full range was contained above support at the 20-week moving average. That is a sign of strength on the longer timeframe, and it hasn’t happened since June. So, key dynamic resistance is noted by the 50-day moving average and support is near the 20-week moving average. A sustained break through either indicator could lead to a continuation in that direction.
Daily Breakdown Could Expose $2.95 Support
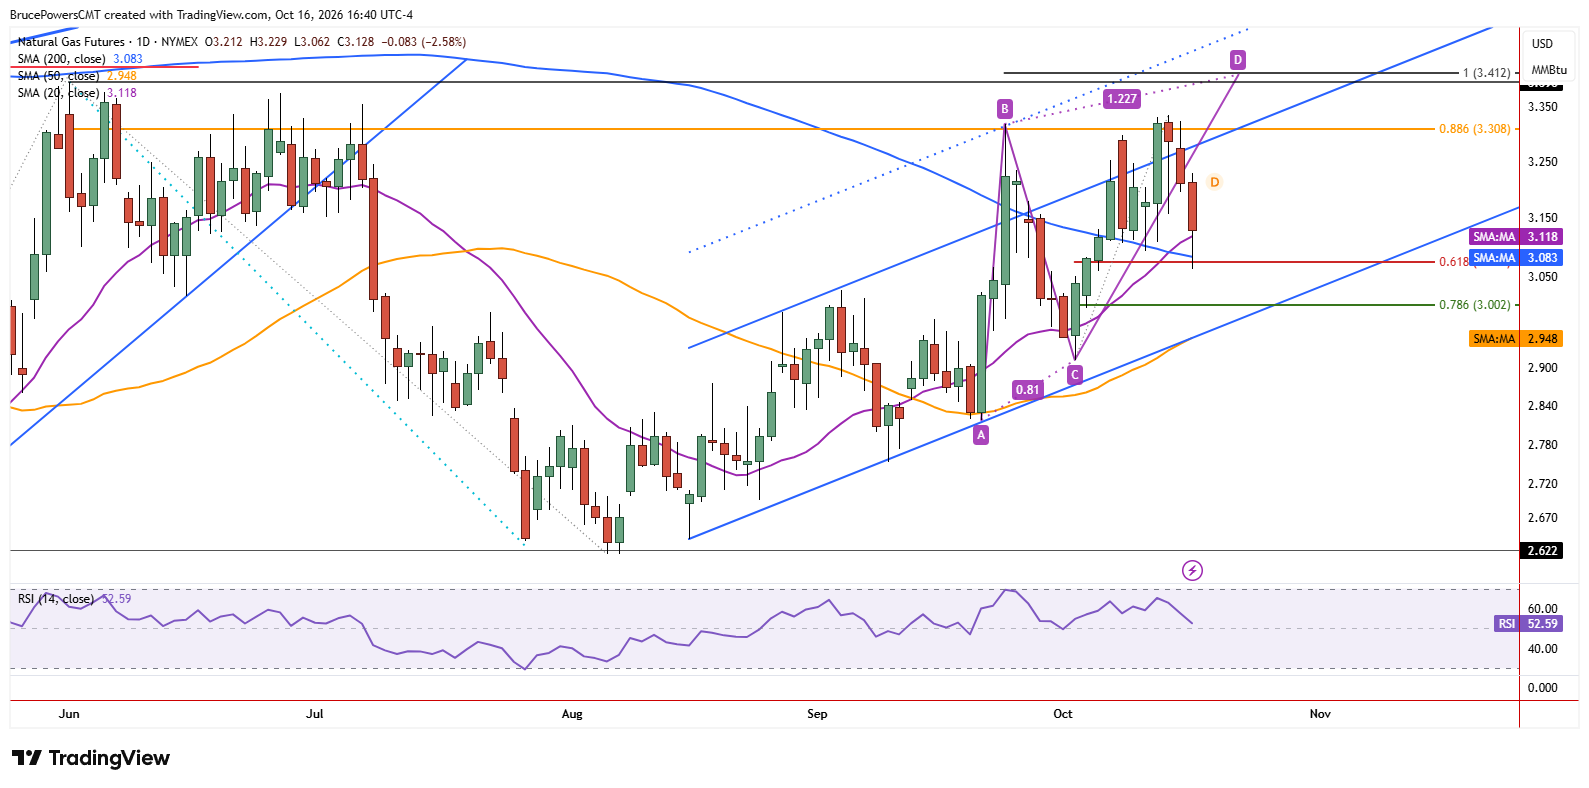
On the daily chart, near-term support is defined by the 200-day moving average near $3.08 and Friday’s low of $3.06. A break below Friday’s low will target the lower uptrend line, along with the rising 50-day moving average, now near $2.95, which is aligned with the trendline. Keep in mind that since natural gas has now been rejected from resistance near the top of the rising channel, the lower end of the channel becomes a potential target, adding to the possibility that support near the 50-day moving average is tested. Since the moving average is rising it may be above the 20-week moving average before price reaches it.
If you’d like to know more about how to trade natural gas, please visit our educational area.



