Gold and Silver Hold Ground as Warsh Keeps the Fed’s Options Open
The key driver of the precious metals complex on Friday was the Federal Reserve, rather than geopolitics.

Gold: The Rate Path Is the Swing Factor
With hot inflation data in September and October, and hawkish comments from John Williams, traders priced in over a 50% chance of an October rate hike before the comments from Bowman and Daly on Thursday. The dollar eased, and 10-year yields fell to about 5.08% on Thursday and Friday, the lowest level since September 25.
The September CPI report showed a 0.6% m/m gain, which was in line with estimates, but the y/y figure showed a 3.7% gain, which was the highest level since May. With the increase, PPI y/y was up 6.3%, the biggest gain since December 2022. With continued, and some would say surprising, strong inflation data, traders are watching to see if the Fed will remain hawkish and tighten further.
Official sector demand was robust, with the People’s Bank of China increasing their holdings by 740,000 oz, the most since September 2023, and the 23rd consecutive month of PBoC buying. This was reflected in the physical markets as well, as ETFs saw record inflows of $31bn in Q3, including $10bn of inflows in September alone. This brought total holdings to a new record high of 4,256 tonnes.
Silver: Rate Headwinds Meet a Structural Deficit
Silver faces similar rate pressures as gold, but without central bank buying to help it. The supply side of the equation is also tighter. The Silver Institute expects a sixth consecutive annual deficit of 46.3 million ounces in 2026, even as the declining use of silver in solar panels by about 19% through thrifting, is expected to continue. Declining use in solar has been partially offset by increasing demand for data centers and autos as well as AI related technology.
Gold Price Forecast
Every new Gold analysis as it publishes, today's technical signal and key levels, live price — on one page.
See all Gold forecastsWhat Comes Next
The Fed goes quiet starting Saturday as it enters its pre-meeting blackout period. However, the September PCE inflation number, the Fed’s favorite inflation number, is not due until October 29, a day after the October 27-28 Fed meeting.
Gold Technical Analysis: XAU/USD Holds $4,176 as $4,201 Comes Into Focus
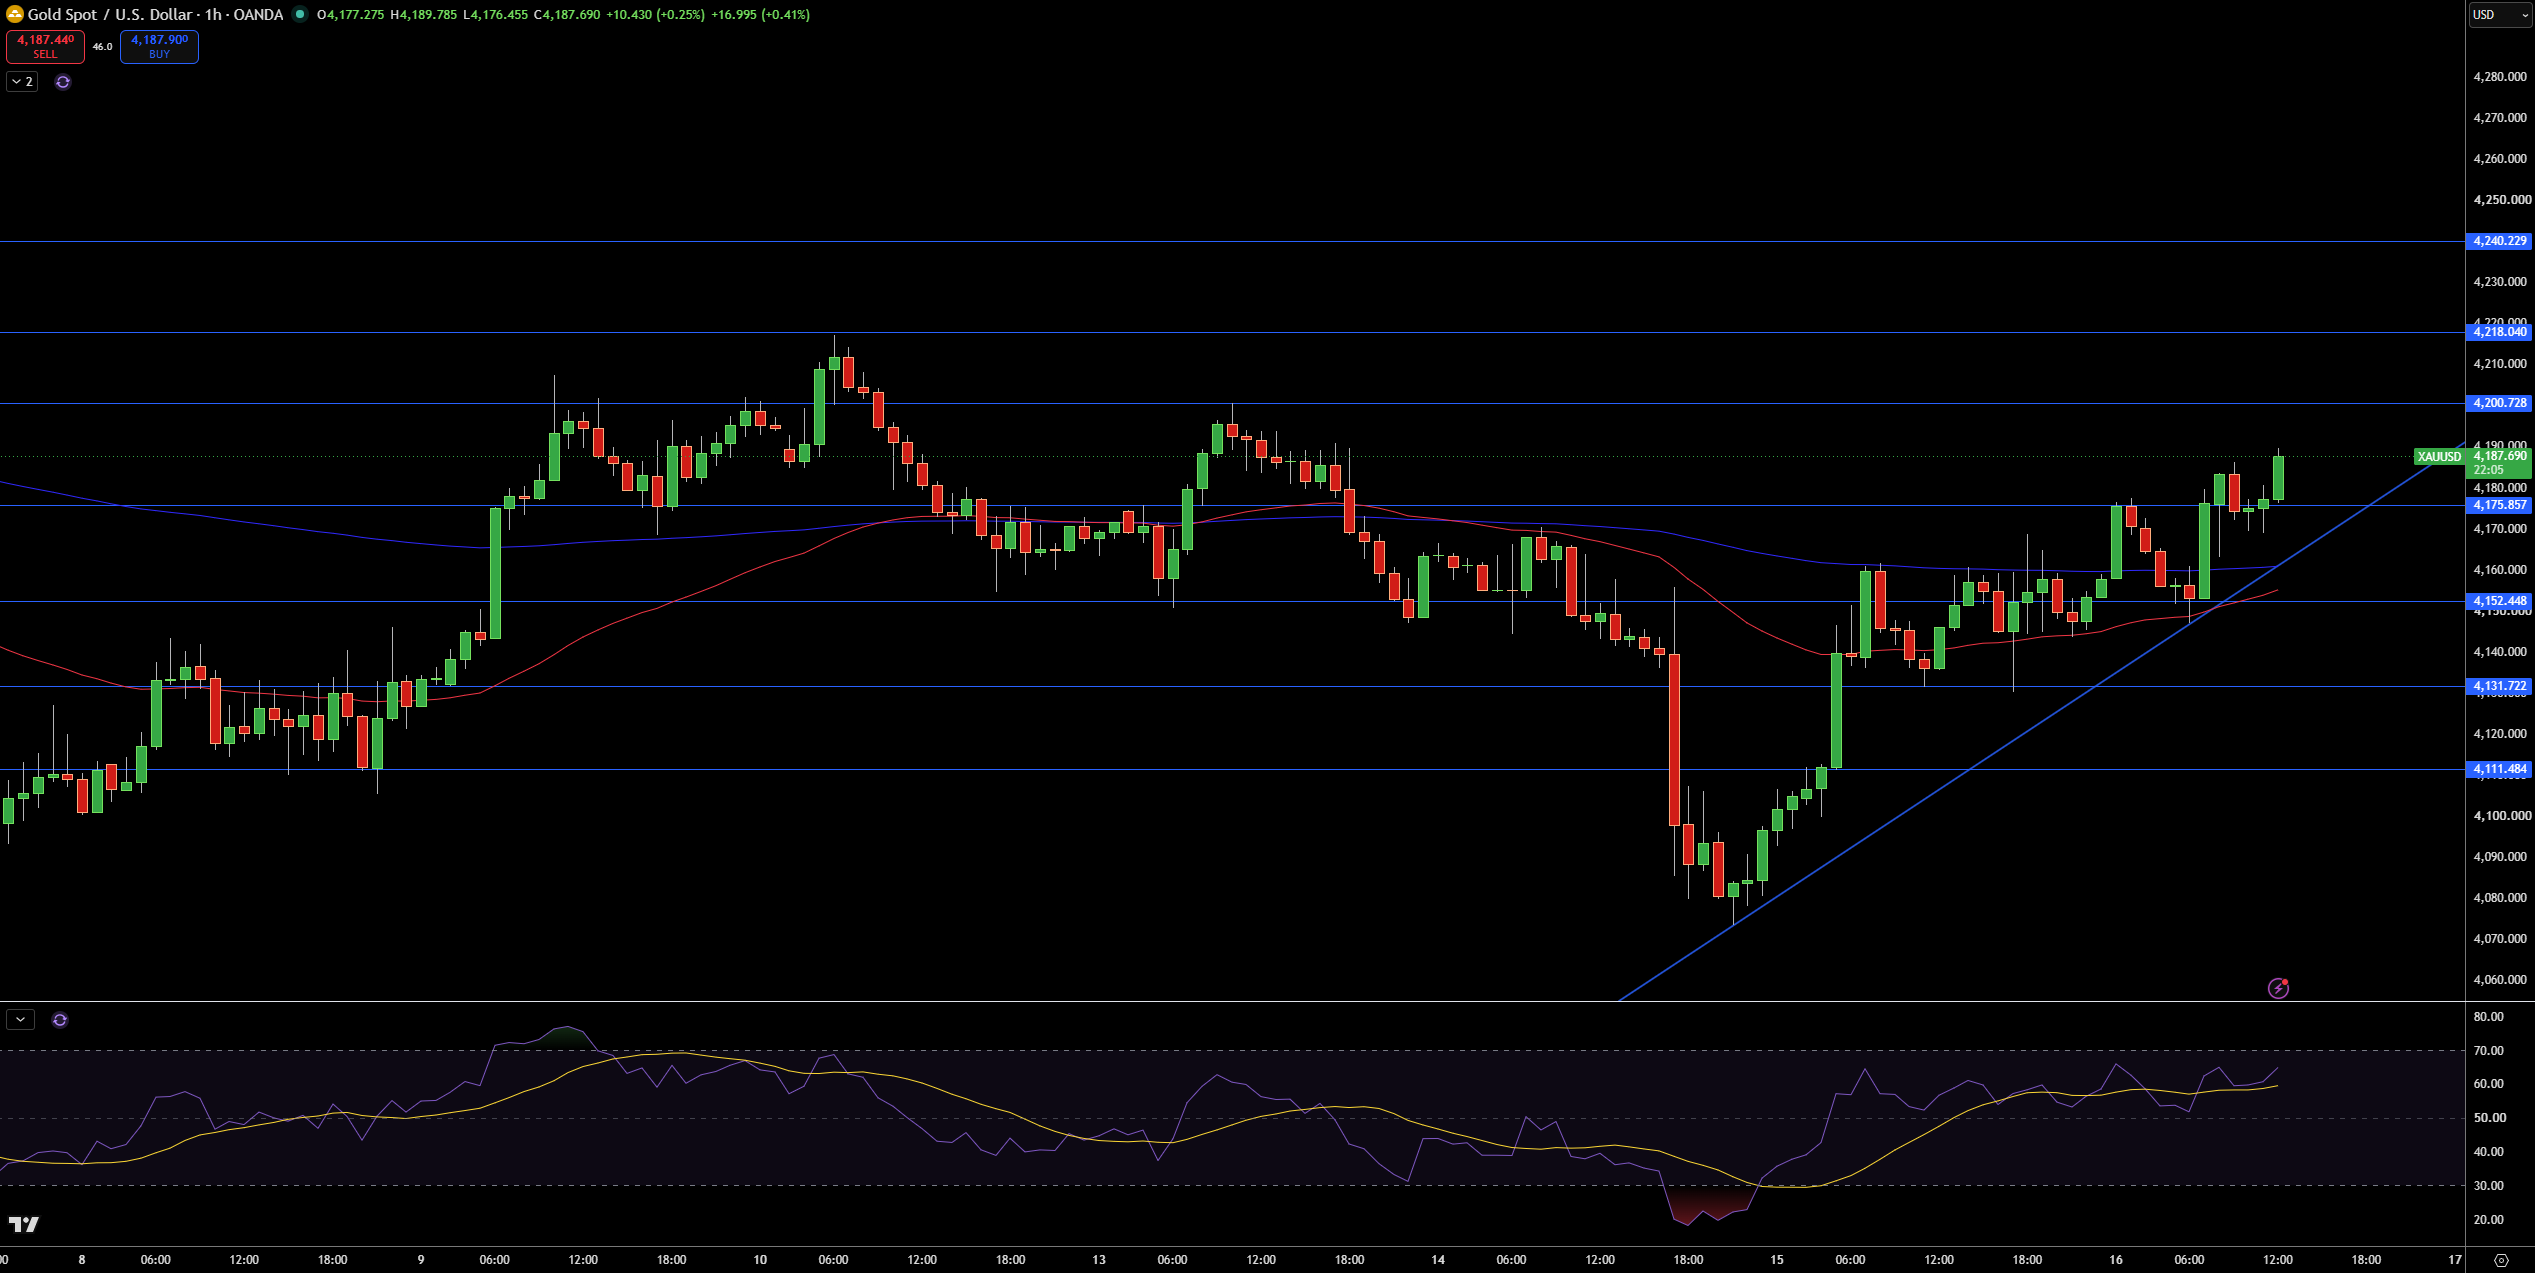
Gold is trading around the $4,188 level on the 1-hour time frame. Price has steadily rebuilt the structure since the large drop to $4,075. This has produced a rising trendline with a series of higher lows. Price has also taken back both moving averages and the 50 and 200 hour MAs are heading higher. This is also bullish.
I see the first major resistance at $4,201. This is the level that contained the move higher earlier in the week. Above there, $4,218 and $4,240 come into view. Support comes in at $4,176, with $4,152, $4,132 and $4,111 coming into view if we head lower.
Momentum is constructive with the RSI at 64 and above its signal line at 59.
Looking bullish so long as Gold trades above $4,176 and the rising trendline. A break above $4,218 would be bullish. A move below $4,152 would negate the recent higher lows and risk the recovery.
Silver Technical Analysis: XAG/USD Holds $57.39 as $57.86 Fibonacci Resistance Is Tested
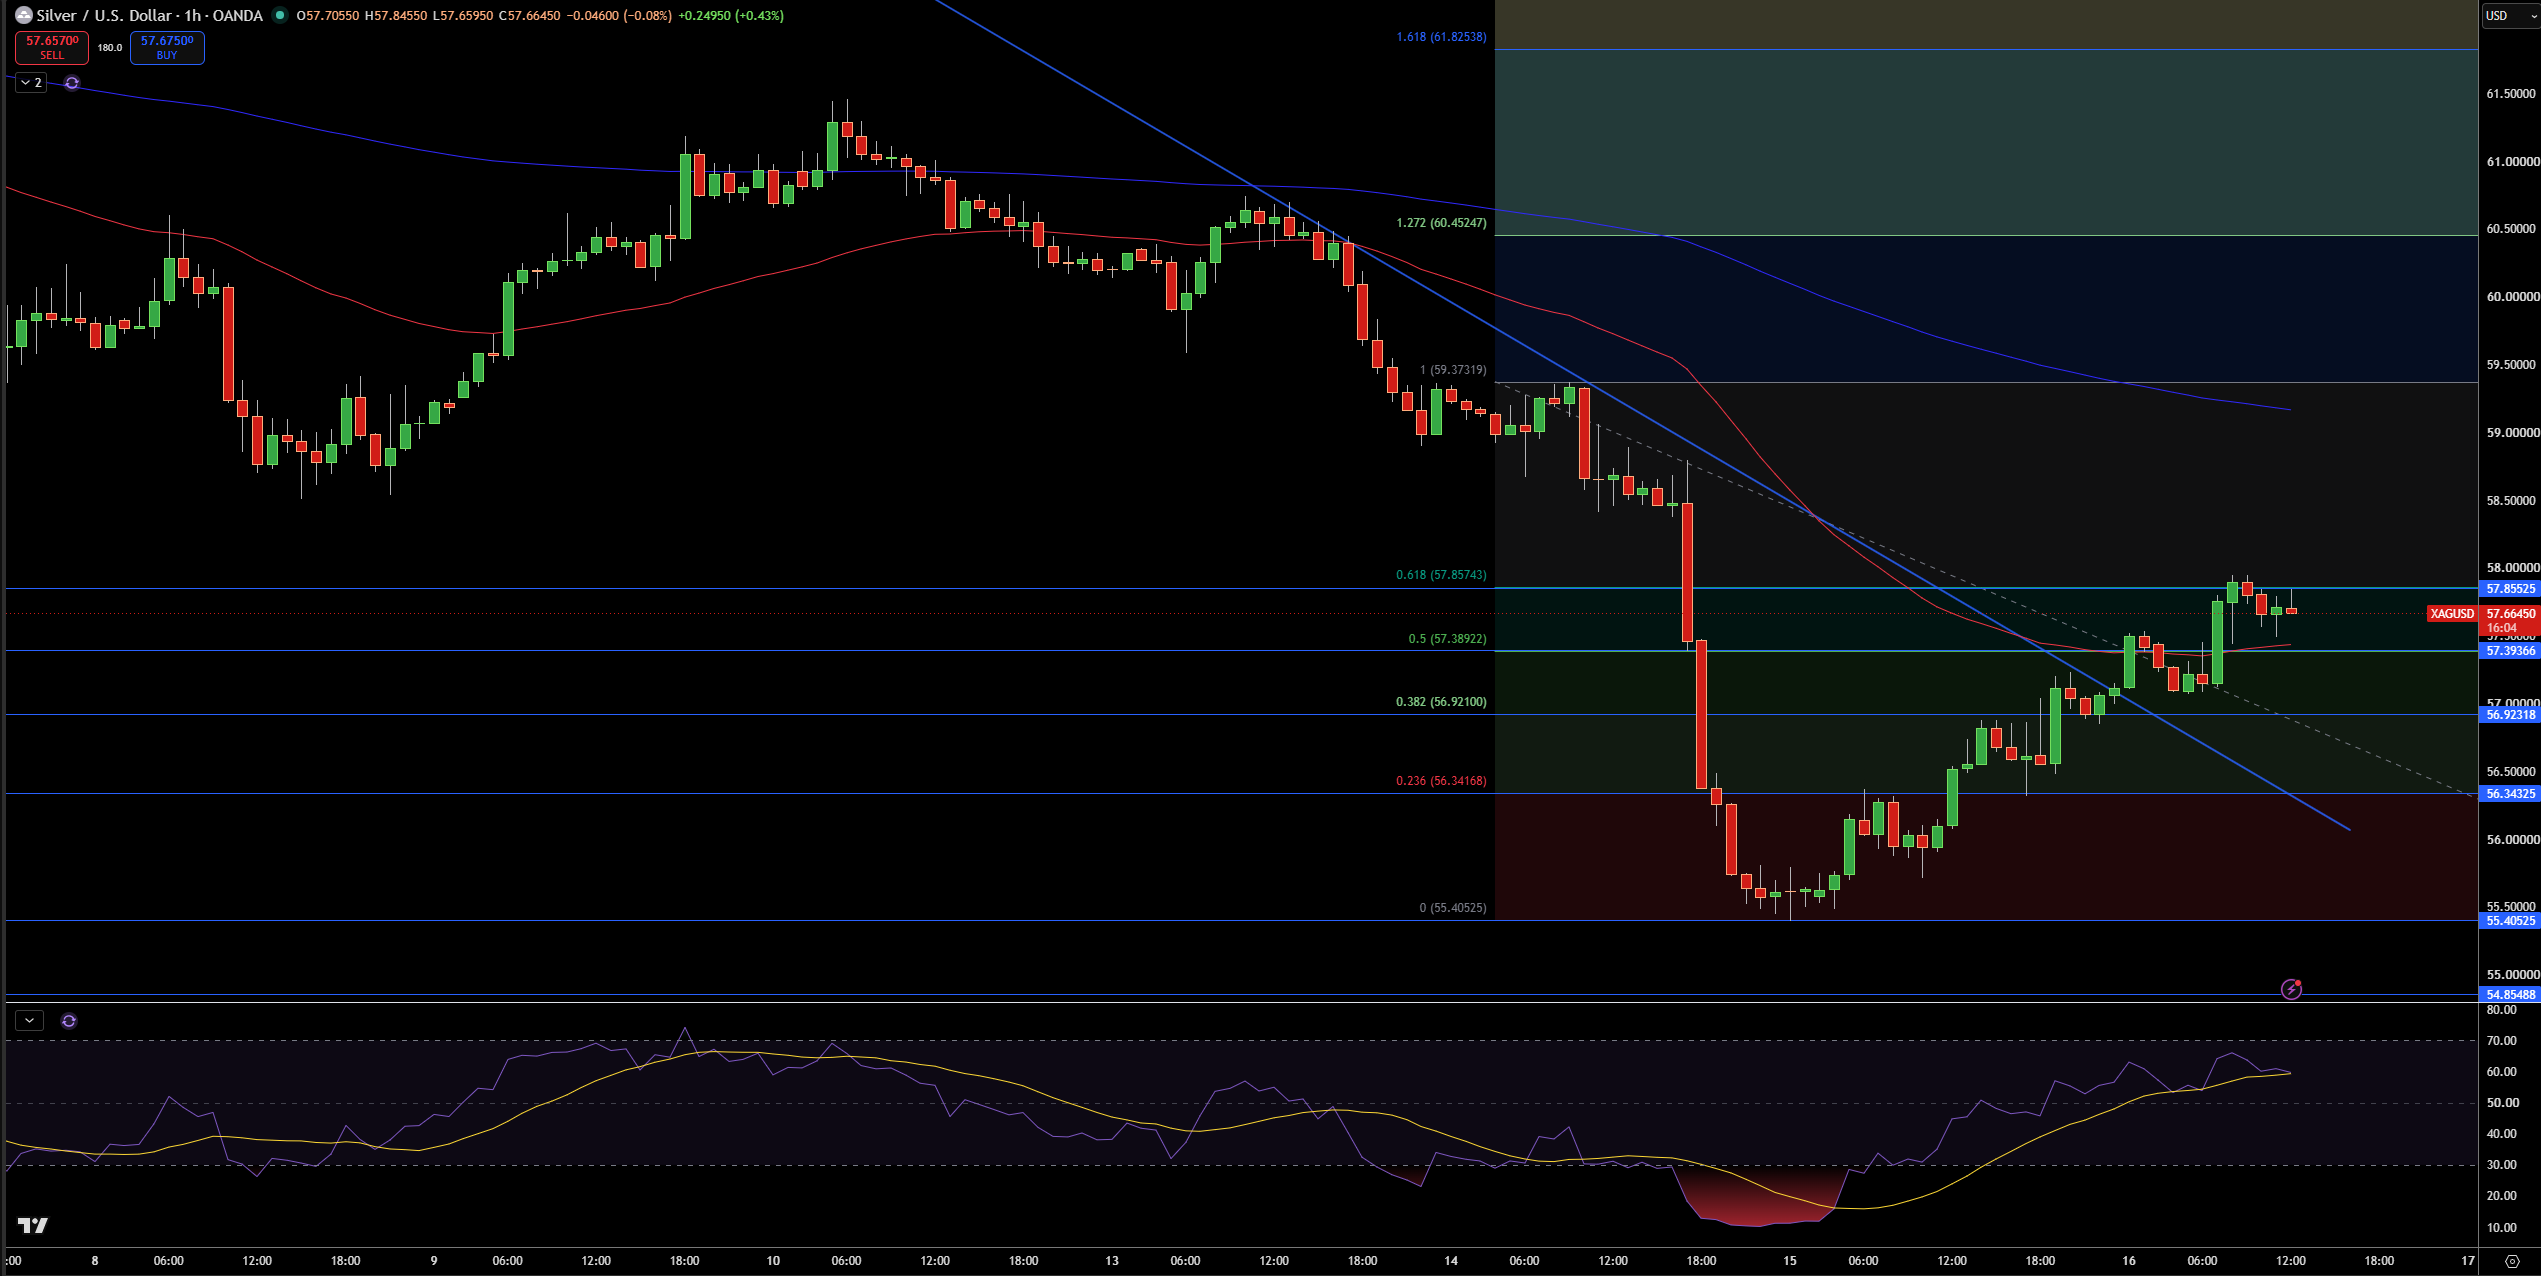
Silver is trading at $57.66 on the 1 hour chart. One thing that jumps out at me is the recovery from the $55.41 low, which already broke above the descending trend line. The price action is currently testing the 61.8% fib level at $57.86, which is also above the faster moving average.
I am looking for price action to break $57.86 to the upside first to retest $59.37 and the 200 moving average and also test the 1.272 fib extension level at $60.45. On the downside I see $57.39 as the first strong support level, followed by $56.92 and then $56.34.
RSI is currently at 60, and with the signal line running flat alongside, we can conclude that momentum is positive, but slowing. As long as the price action holds above $57.39, I will keep a bullish bias. A clear break above $57.86 would confirm the recovery, and $59.37 would come back into play. A move below $56.92 would suggest a break of the bullish trend and a continuation of the move to the downside.