



Dollar Softens as Warsh Holds Fire, While Sterling Leans on Growth
The dollar started Friday weak. Euro and sterling fundamentals will depend on how each central bank responds to inflation.

Dollar Index: Warsh Keeps October Open
Kevin Warsh said on Friday in Bangkok that he does not preview rate decisions, and that the September hike removed a dose of policy accommodation, offering nothing about the October 27-28 meeting. The dollar fell following his comments.
September CPI data was released on Wednesday, showing a 3.7% increase from the previous year, slightly above estimates. Core inflation was at 2.6% and headline PPI rose 6.3%. Traders were pricing in a 30% chance of a hike in October. The Fed enters its blackout period on Saturday.
Euro: Inflation Pressure Meets Fiscal Risk
Faced with fiscal challenges, Italy’s bond yields touched 4.7% this month, up more than 100 basis points this year. Germany’s bund yields have been hovering around their highest levels since 2009. The spread between Germany’s and Italy’s 10-year bond yields hit its widest in almost 18 months, at around 105 basis points. Against this backdrop, the euro came under selling pressure.
September’s inflation rate hit a three-year high at 3.8% according to Eurostat’s preliminary figures. Energy prices rose by 18.8% from last year. Further figures for September will be published today. According to a Reuters poll, the ECB will hold its deposit rate at 2.50% in October, and will raise it by 25 basis points in December. However, Citi noted that the fiscal constraints in France mean the ECB could hold after December, or raise rates even less, depending on how the situation evolves.
EUR/USD Price Forecast
Every new EUR/USD analysis as it publishes, today's technical signal and key levels, live price — on one page.
See all EUR/USD forecastsPound: A Growth Surprise Strengthens the Hike Case
Surprising growth in UK GDP in August, with month on month growth of 0.1% and growth of 0.7% in the three months to August, has strengthened expectations for further Bank of England rate hikes. In a recent poll of 63 economists, 54 expect Bank Rate to rise to 4.00% in November. October brings UK inflation data, and the Autumn Budget.
US Dollar Index Technical Analysis: DXY Tests 101.80 Support as 101.60 Comes Into Focus
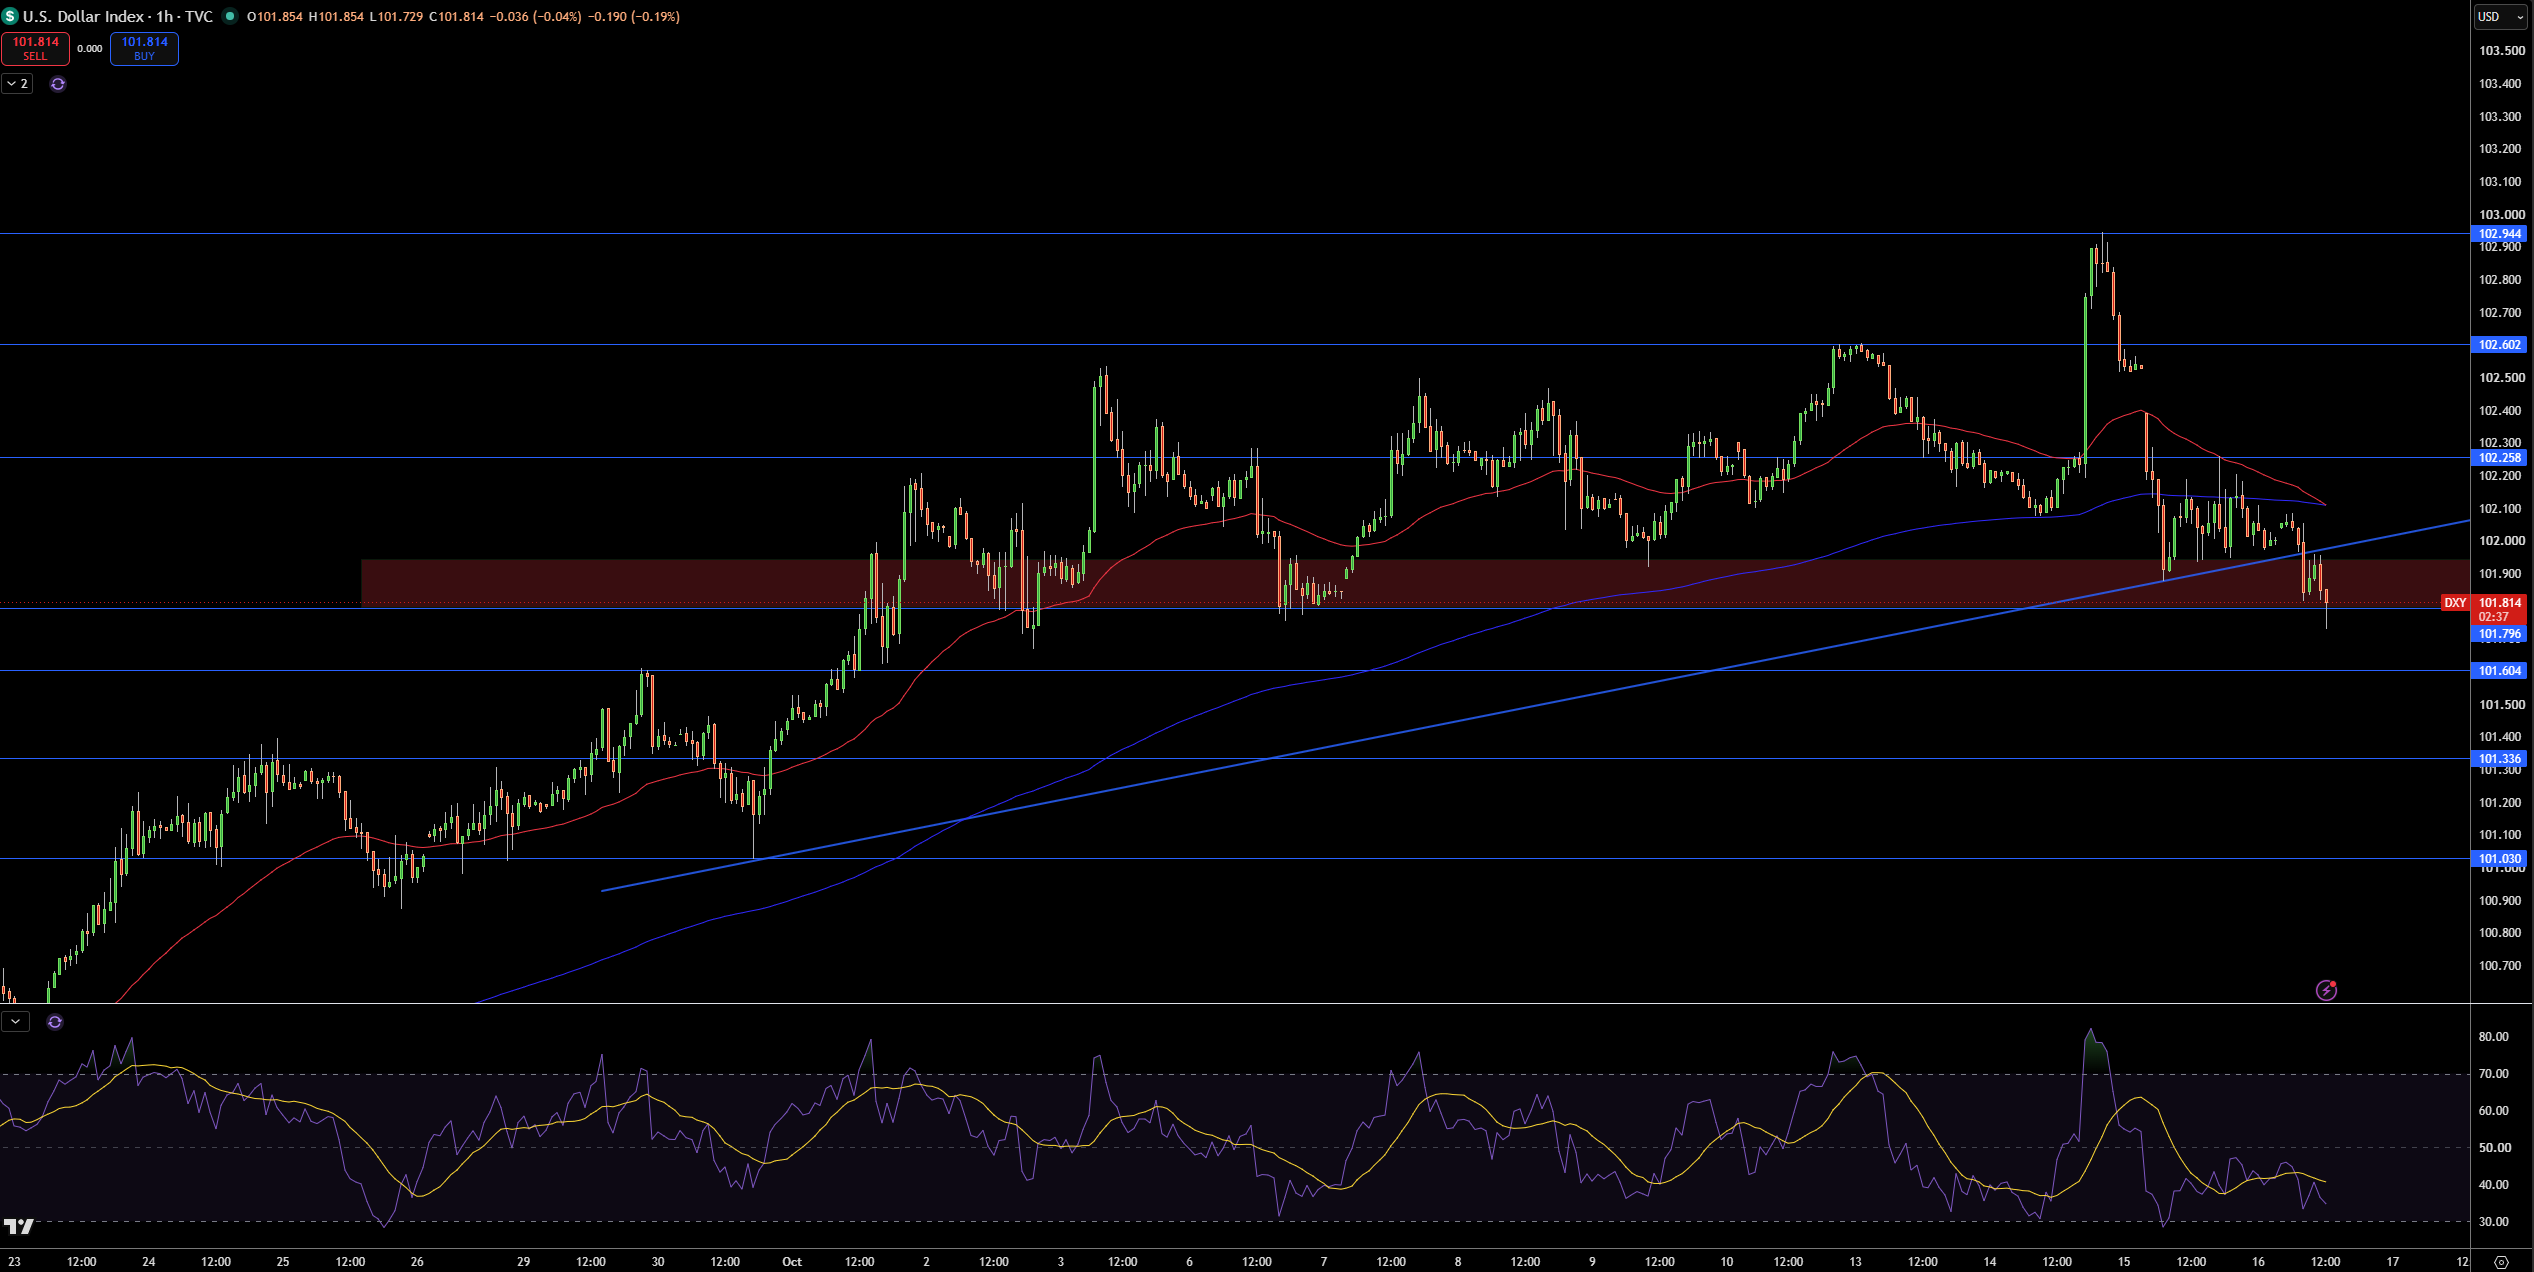
The US Dollar Index is trading at the 101.81 level on the 1 hour chart. The Dollar Index (DXY) has broken below its rising trendline and is currently testing the lower edge of the 101.80 support zone. The sharp move up to 102.94 was quickly rejected and DXY has subsequently broken below both the 200 and 50 moving averages, which are also rolling over.
The first important support I am watching is at 101.80. If we break this level, we will more than likely see 101.60, 101.34, and 101.03. The 101.95 area is currently the first important resistance, and if we see a move higher, the 102.26 and 102.60 levels are next.
RSI is currently at 35 and the moving average converge on the trendline near 101.95. A close below 101.60 would also strengthen the bear case and 102.26 would be a bearish invalidation level.
I am somewhat bearish as long as DXY is trading below the rising trendline and both the 50 and 200 hour moving averages.
GBP/USD Technical Analysis: Pound Holds 1.3268 Breakout as 1.3322 Caps the Rally
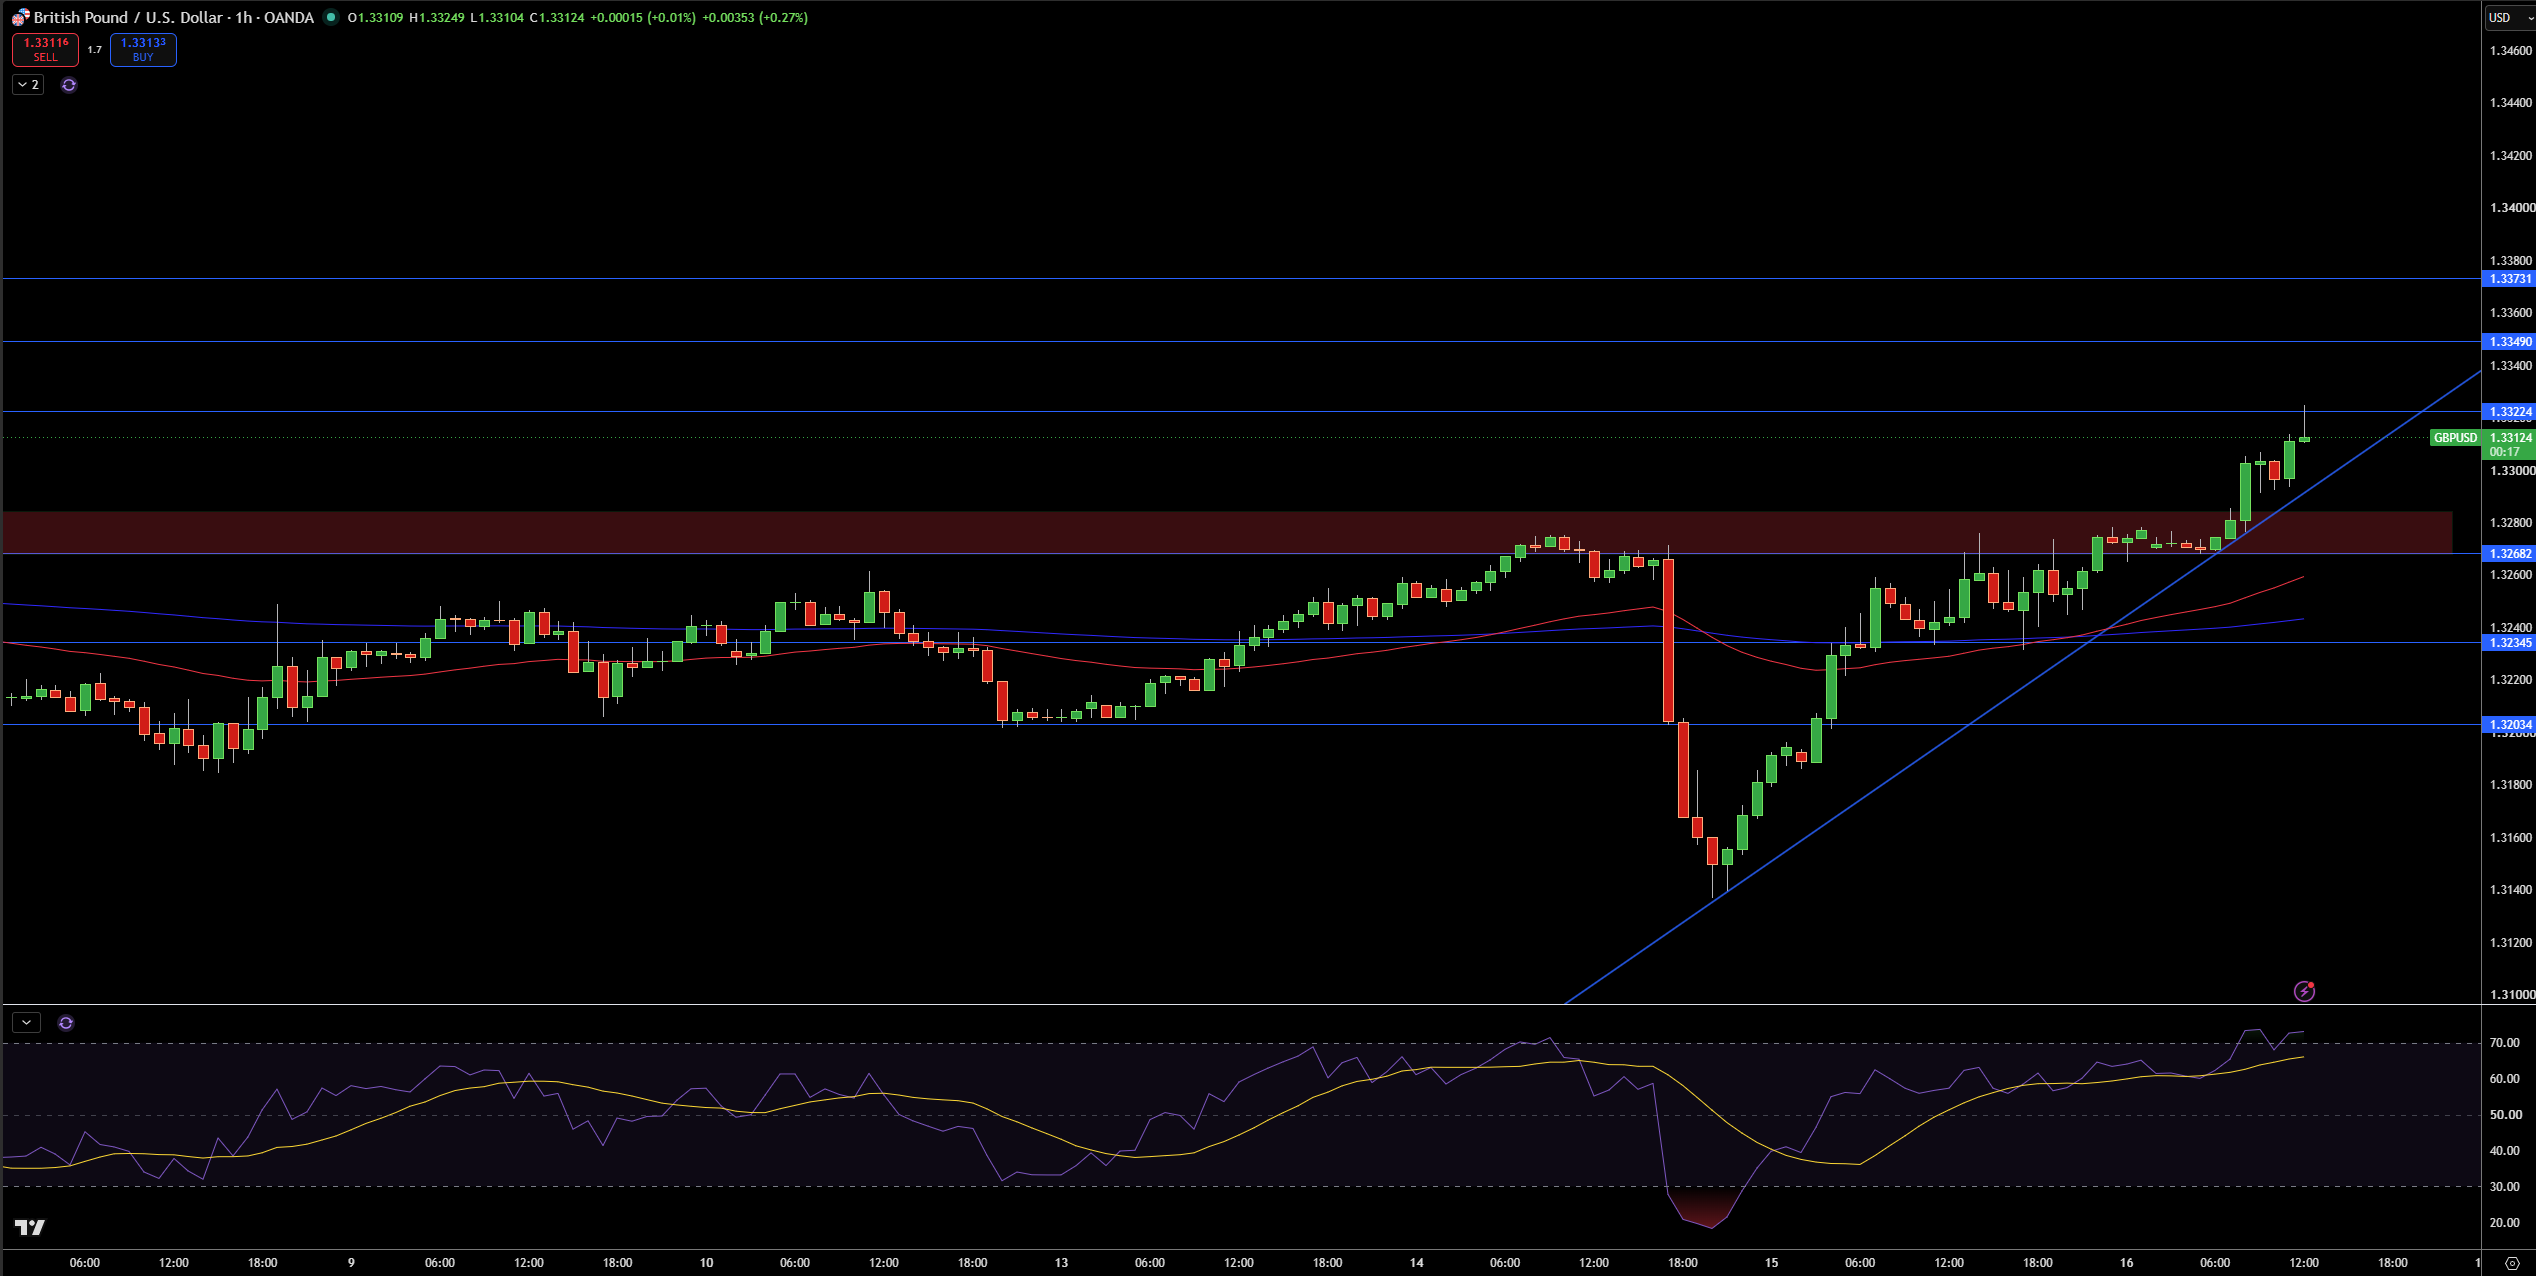
GBP/USD is currently at 1.3312 and increasing. One thing that stands out is the clean break above the resistance zone at 1.3268. This area capped price for a few days. The 1.3135 low is where the upward trend from began, and price is above both moving averages. The pair is currently testing the 1.3322 area, and the latest candle on the H4 chart left an upper wick there.
1.3322 is the first resistance level. A break above this area exposes the next area at 1.3349. A break above 1.3349 would expose the 1.3373 resistance area. The 1.3268 breakout zone is the next area of support, and under that is 1.3235 and 1.3203.
RSI is at 72 and is above the signal line at 66. This indicates the pair is in overbought territory. I am looking for a pullback towards 1.3268. A close above 1.3322 would make the trend even more bullish. Conversely, a close below 1.3235 would invalidate the breakout above 1.3268.
EUR/USD Technical Analysis: Euro Holds 1.1221 as 1.1277 Comes Into Focus
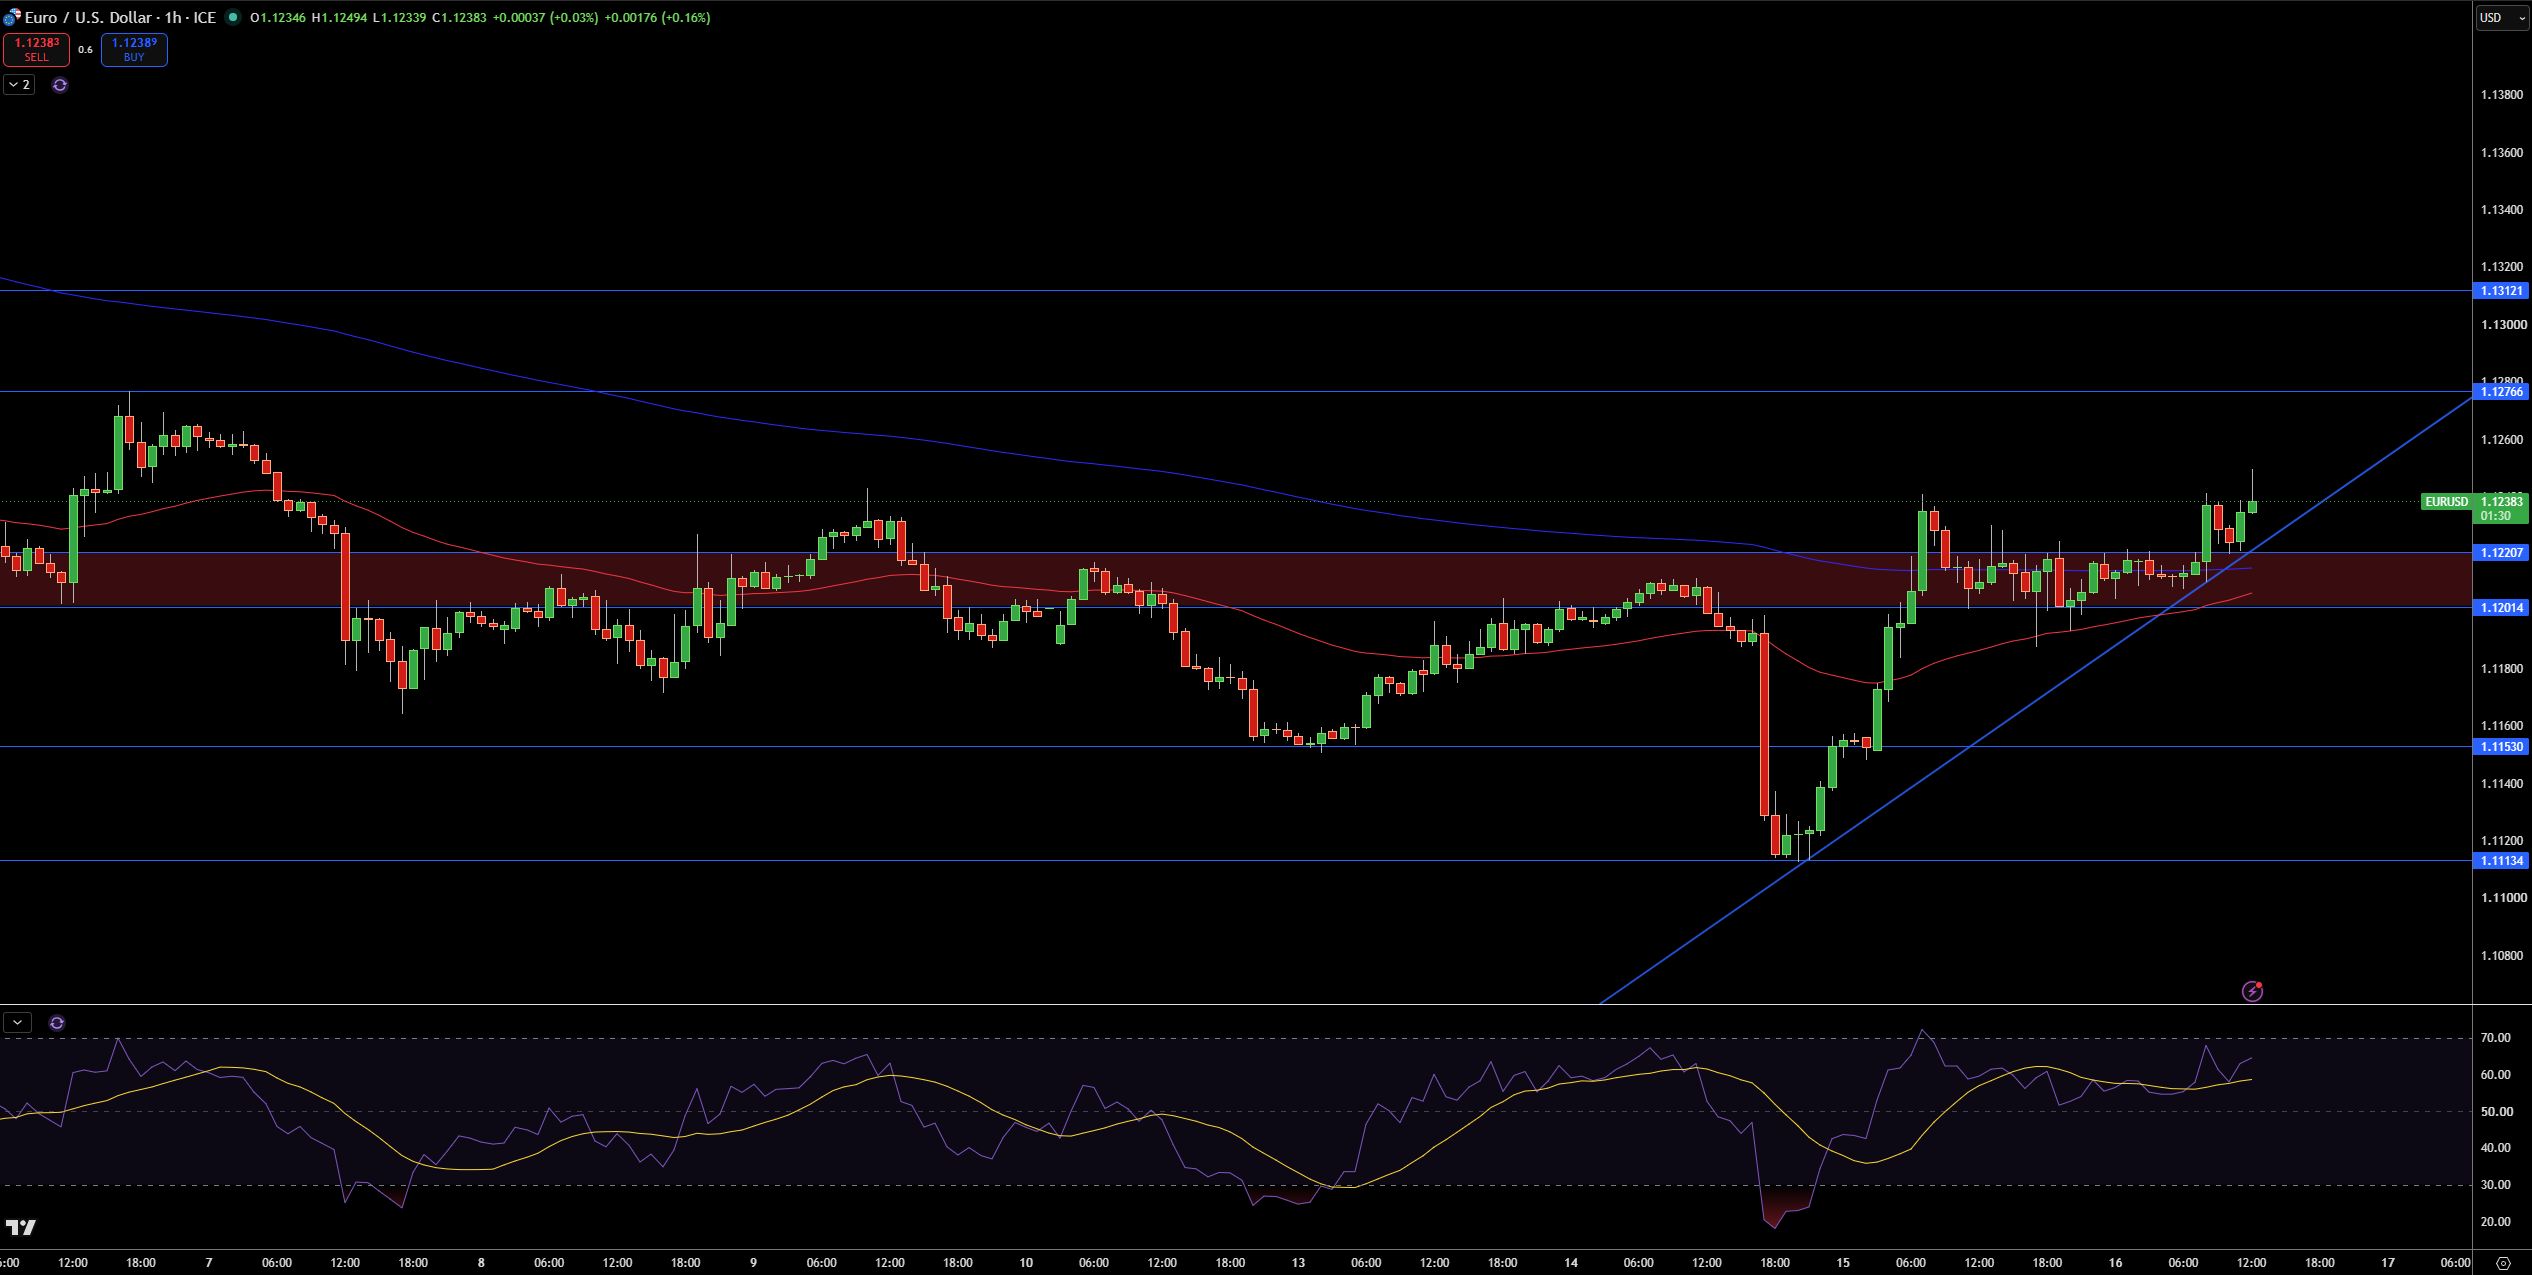
EUR/USD is around 1.1238 on the 1 hour chart. What stands out to me is the strong recovery from 1.1113 with rising trendline support and higher lows. EUR/USD has also moved above the 1.1201 to 1.1221 resistance zone and is also above both moving averages, suggesting the bulls are in control.
I am looking at 1.1277, the high from earlier in the month, as the first serious resistance. The 1.1221 level is the first support and is followed by 1.1201 and the rising trendline. Below the trendline and 1.1201, 1.1153 and 1.1113 come into play.
RSI is near 64 and is above its signal line at 59. This tells me that the EUR/USD is in positive territory and trending up, but not to the extent that it is overbought. I am bullish while EUR/USD stays above 1.1201. Should we see a close back below 1.1201, it would call into question the breakout. A move above 1.1277 would confirm and add to the upside recovery.


