Consolidation Holds Near Trend Highs
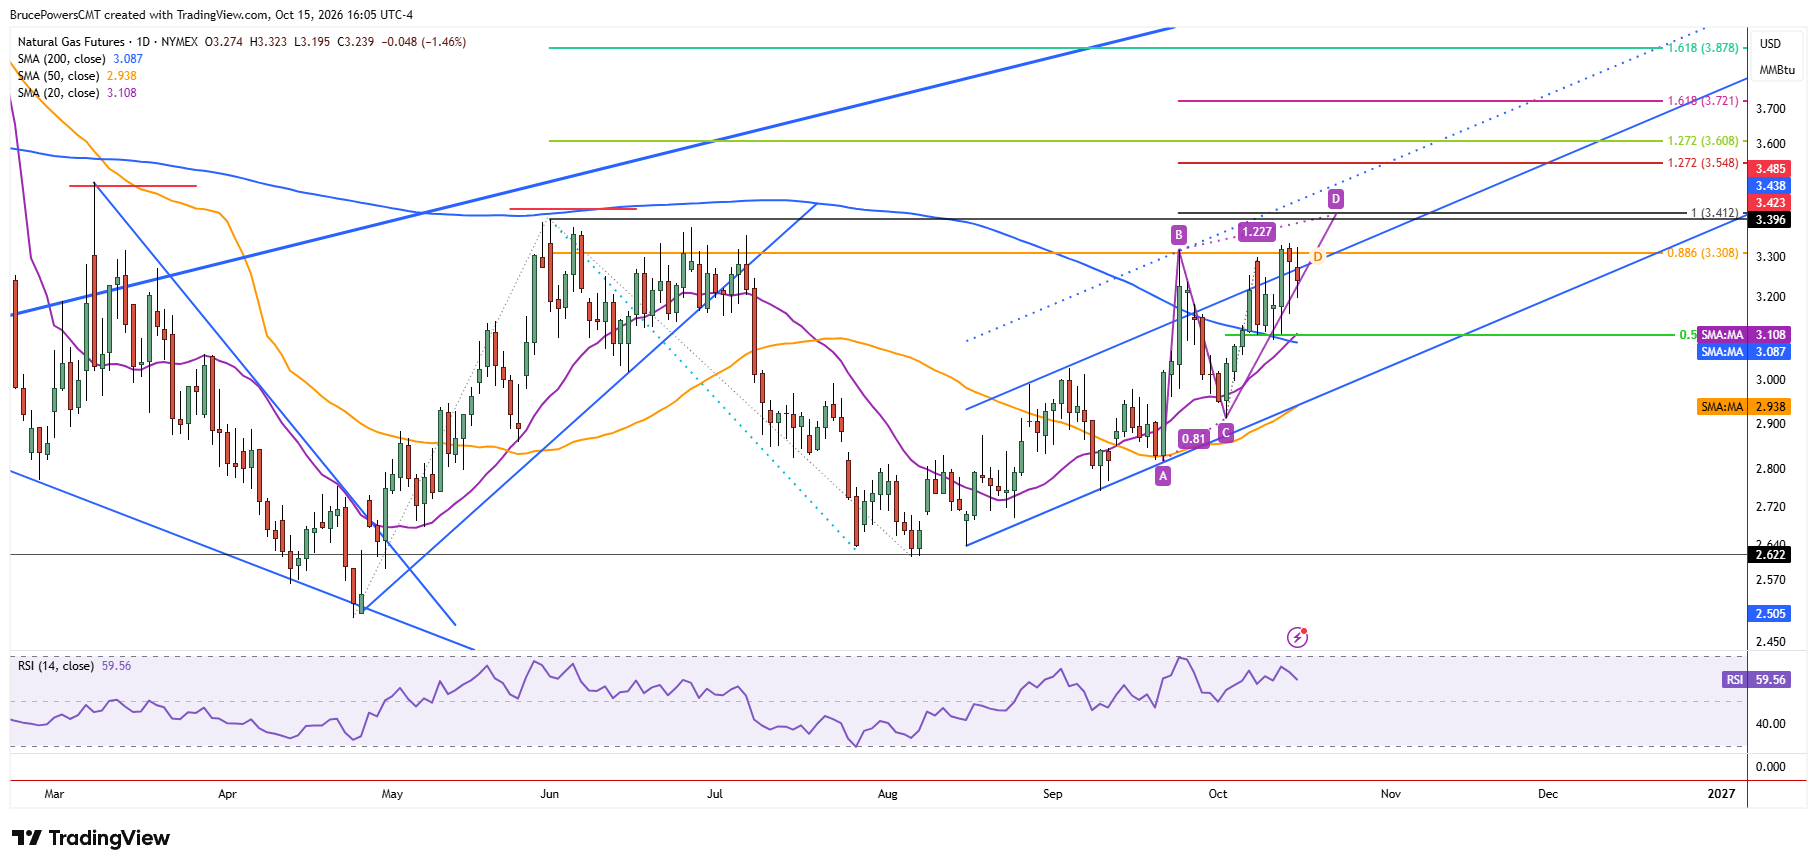
Natural gas consolidated for a second day on Thursday, remaining inside the range from Wednesday, while maintaining underlying bullish sentiment. Both days maintained the pattern of higher daily lows, and the high tested resistance for the third consecutive day. The high for the week at $3.334 marks the top of the resistance zone and high for the current advance begun from the August lows.

Moving-Average Crossover Reinforces Bullish Structure
Since strength followed a five-day test of support at the 200-day moving average, generating a higher swing low at $3.09 and signaling an extension of the trend. A breakout above the prior high of $3.317 (B), would retain a bullish outlook unless that support area fails to hold. Since the 20-day moving average just crossed above the 200-day moving average, short-term bullish momentum is continuing to improve and support a continuation of the trend.
ABCD Projection Points Toward $3.41
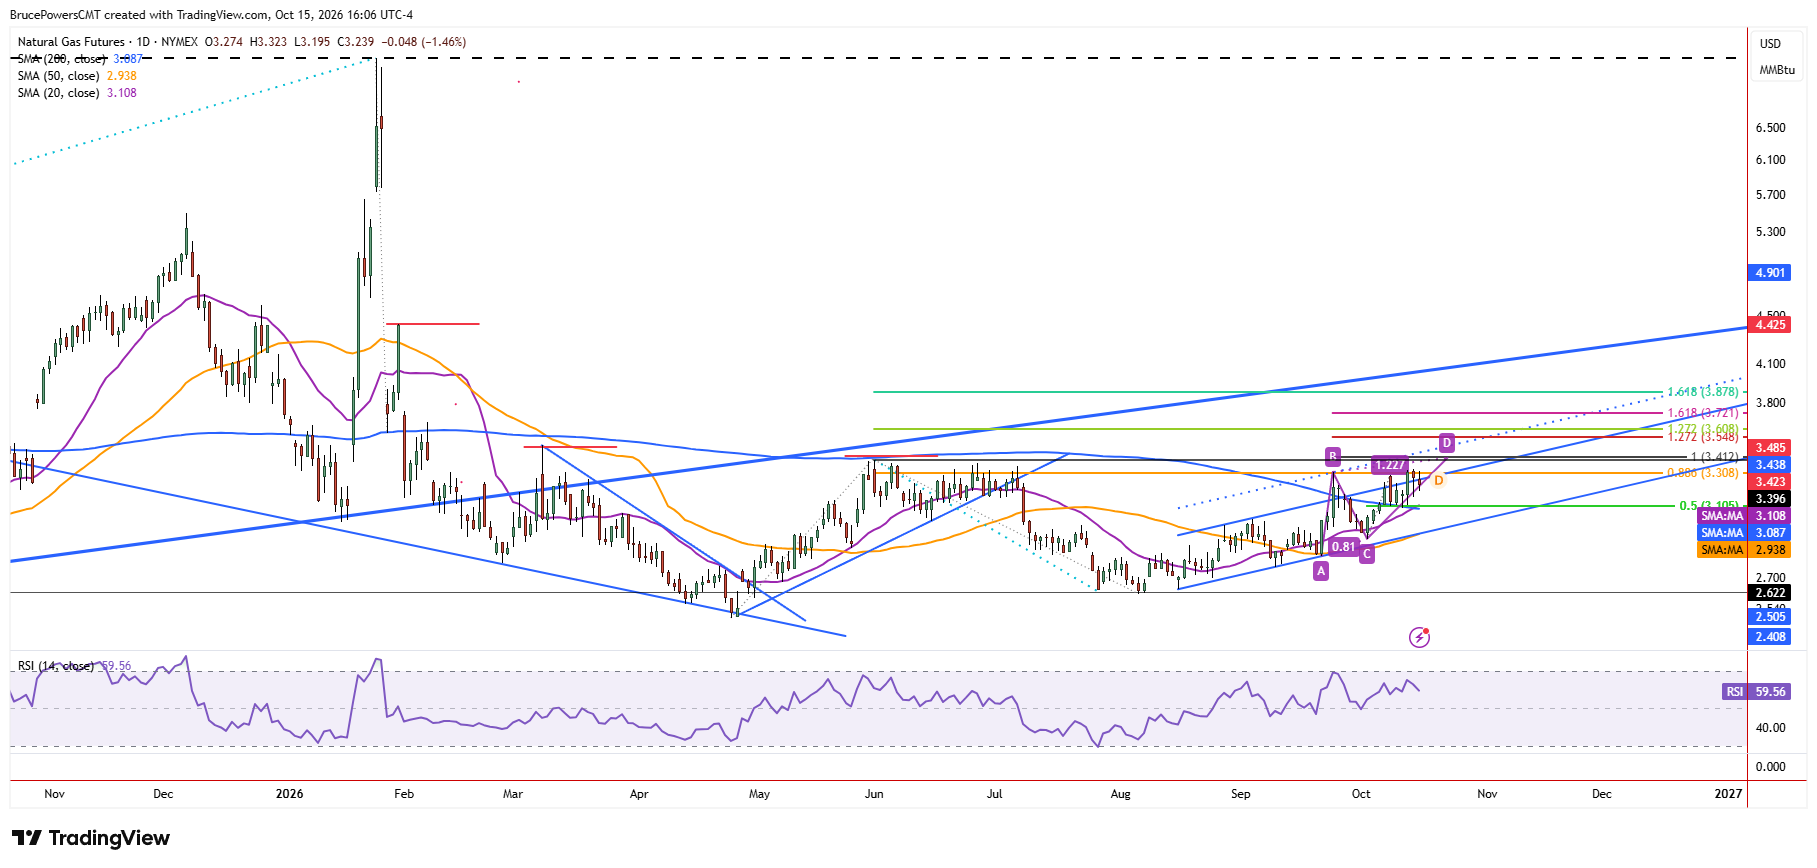
An extension above $3.323 would put natural gas on track to complete a 100% projection of a rising ABCD pattern at $3.41. That is a potential resistance area, along with the lower swing high of $3.396 from June. A daily close above the swing high would signal an extension of the bullish trend off the April low of $2.495, to follow the higher swing low of $2.616 in August. The sustained reclaim of the 200-day moving average, now near $3.09, would support that bullish scenario, opening higher potential targets.
Higher Targets Depend on Breakout Confirmation
For now, a confirmed breakout above $3.396 and then $3.41, could see the 127.2% Fibonacci ABCD projection reached at $3.548. But the first more significance level is defined by the 127.2% Fibonacci extension of the prior decline near $3.61. A key concern now will be the characteristics of further consolidation or weakness before a new high breakout signals, if that is what occurs.
If you’d like to know more about how to trade natural gas, please visit our educational area.