Long-Term Breakout Fuels Fresh Momentum
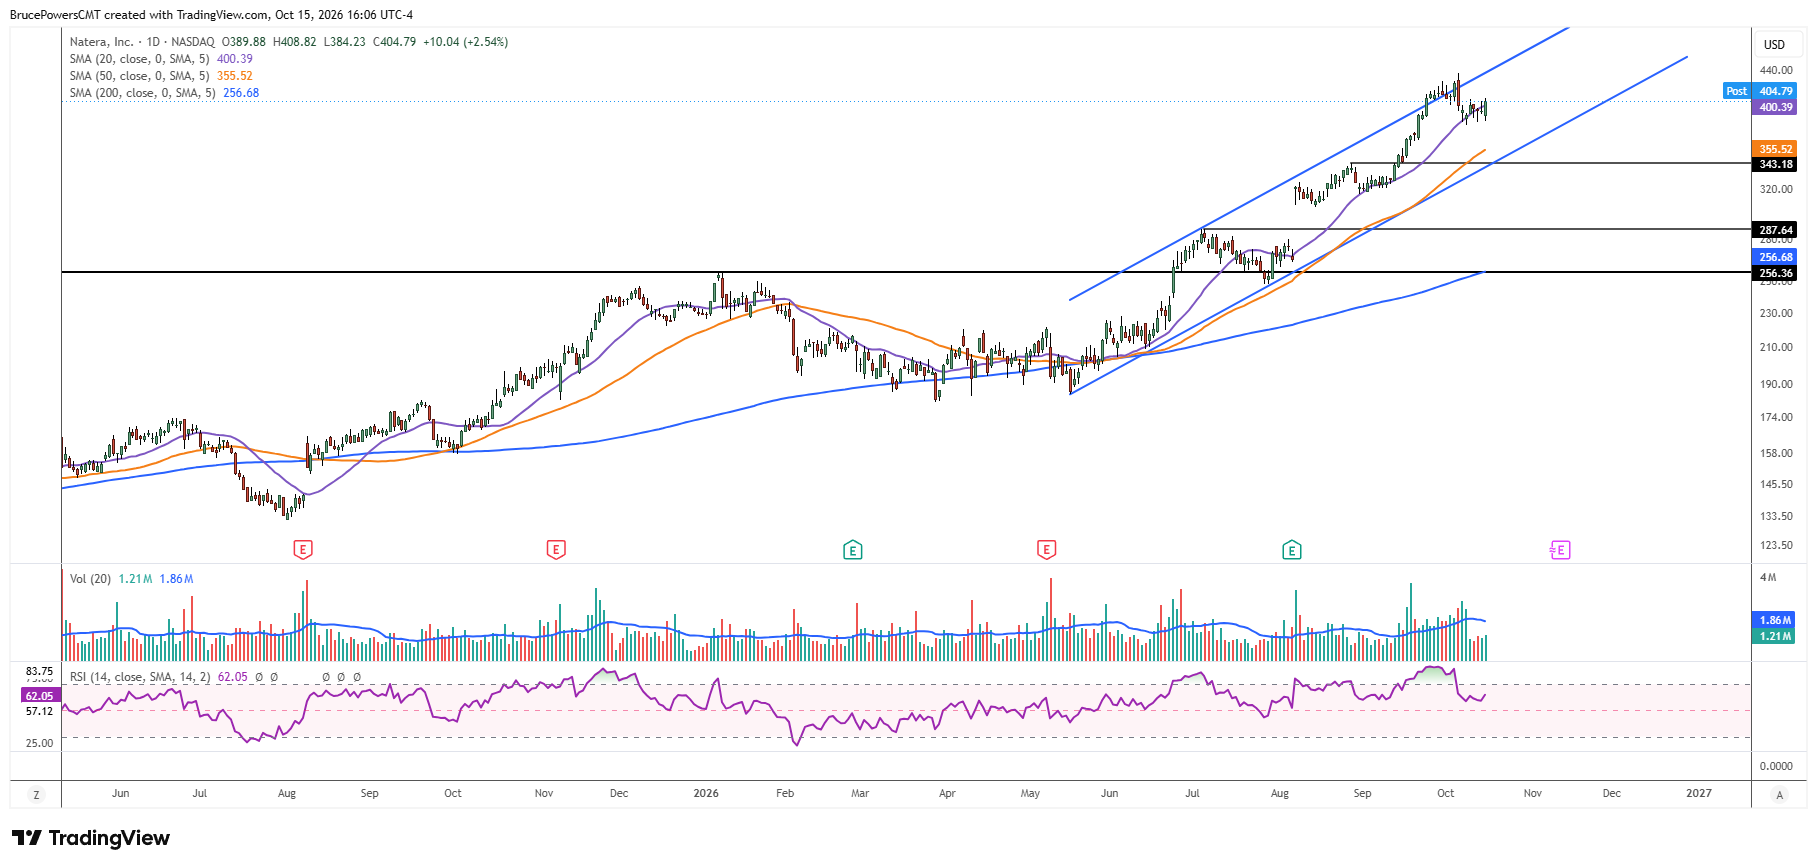
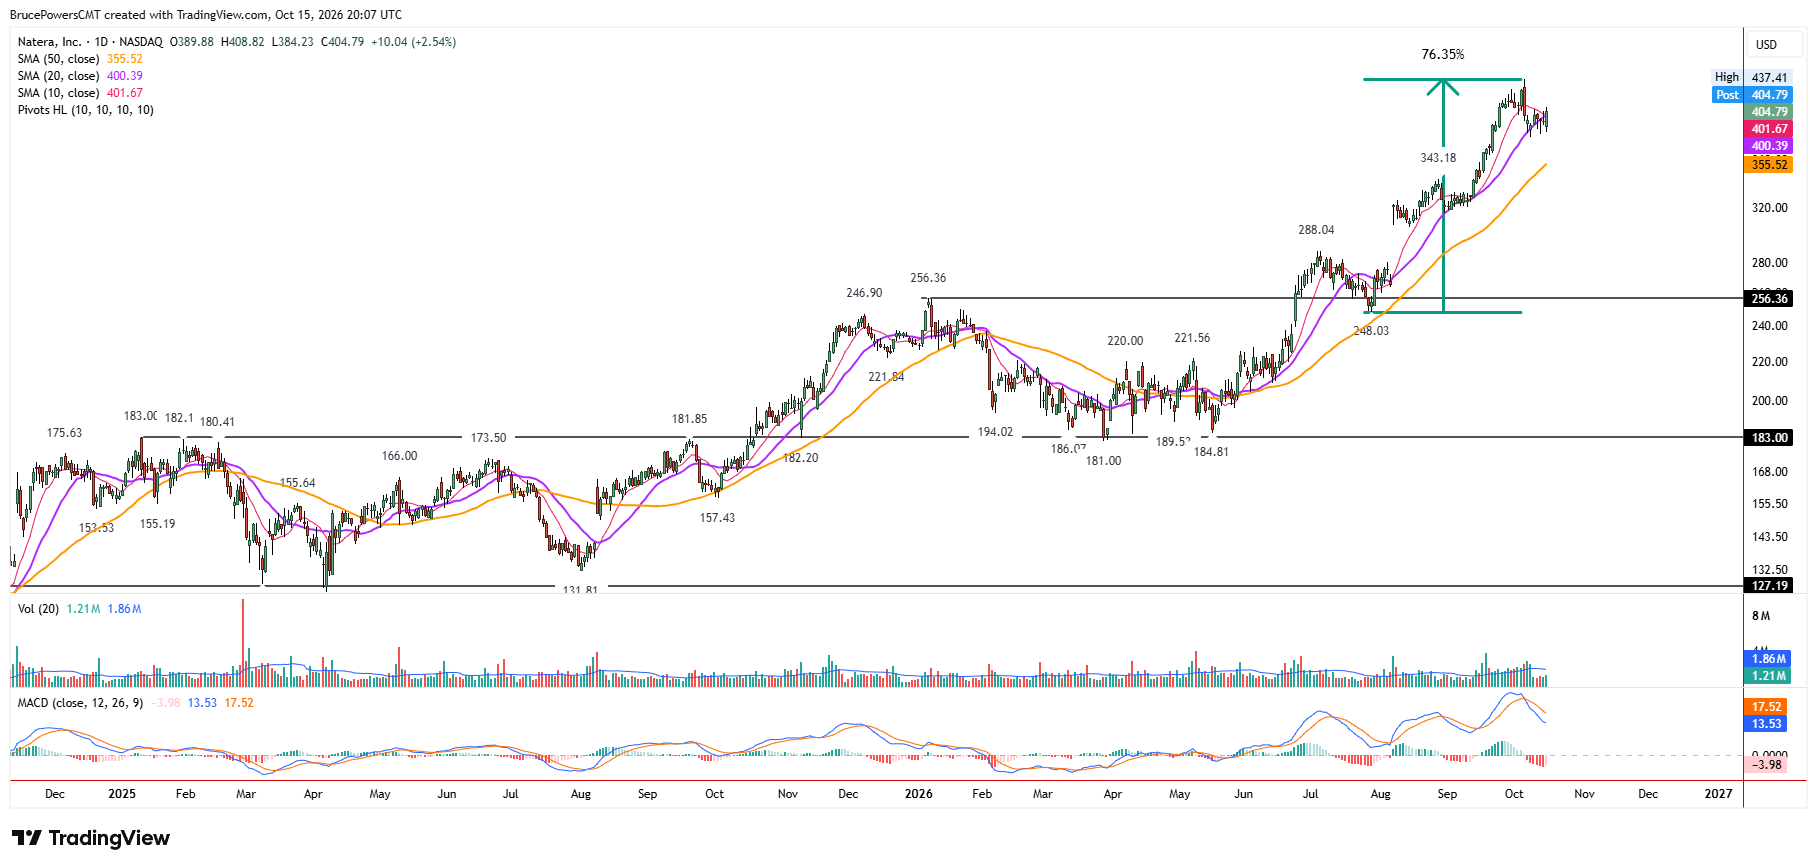
Natera, Inc. (NTRA), genetic testing and diagnostics company, broke out of a long-term base in November 2024, and it has been progressing in a constructive trend since. More recently, bullish momentum accelerated following the first pullback after the upside breakout of an approximately five-month sideways base that triggered above $256.36 in June. The stock subsequently gained more than 76% as of the new high of $437.41 reached last week.

Consolidation Tests Bullish Resilience
Despite the possibility that the stock is overextended and in need of a correction of some sort, it continues to show relative strength as the wider market increases pockets of weakness. Following last week’s high, NTRA retraced to a low of $380.39, completing a 38.2% Fibonacci retracement of the prior advance and a test of support at the 20-day moving average. Subsequently, five days of consolidation have followed with support at the low being maintained.
Moving-Average Support Defines Risk
Since support was found near the 20-day moving average during the prior minor pullback in August to a low of $316, it marks a key dynamic support area, with the potential of further downside if it is broken. In that scenario, key potential support is marked by the prior high and top of the more recent basing pattern at $343.18. But the next larger bullish trend is defined by dynamic support at the 50-day moving average, currently near $356 and rising.
If buyers can maintain control and underlying bullish momentum, a decisive breakout above the $437.41 high would be needed to signal an extension of the trend. However, as the short-term consolidation pattern further develops, it may produce other opportunities. Nonetheless, the upper boundary of a rising trend channel acted resistance near the recent high and may continue to constrain advances, even after a breakout.
Third Advance Could Be Developing
A decisive breakout above $437.41 would signal the potential start of a third leg higher in NTRA’s uptrend since its long-term base breakout in November 2024. Given the strength of the advance and the stock’s ability to consolidate while holding key support, the next leg higher could develop following a shorter consolidation period than the previous two advances.
If you’d like to know more about technical analysis and how traders use it, please visit our educational area.