Bullish Momentum Builds Toward $100
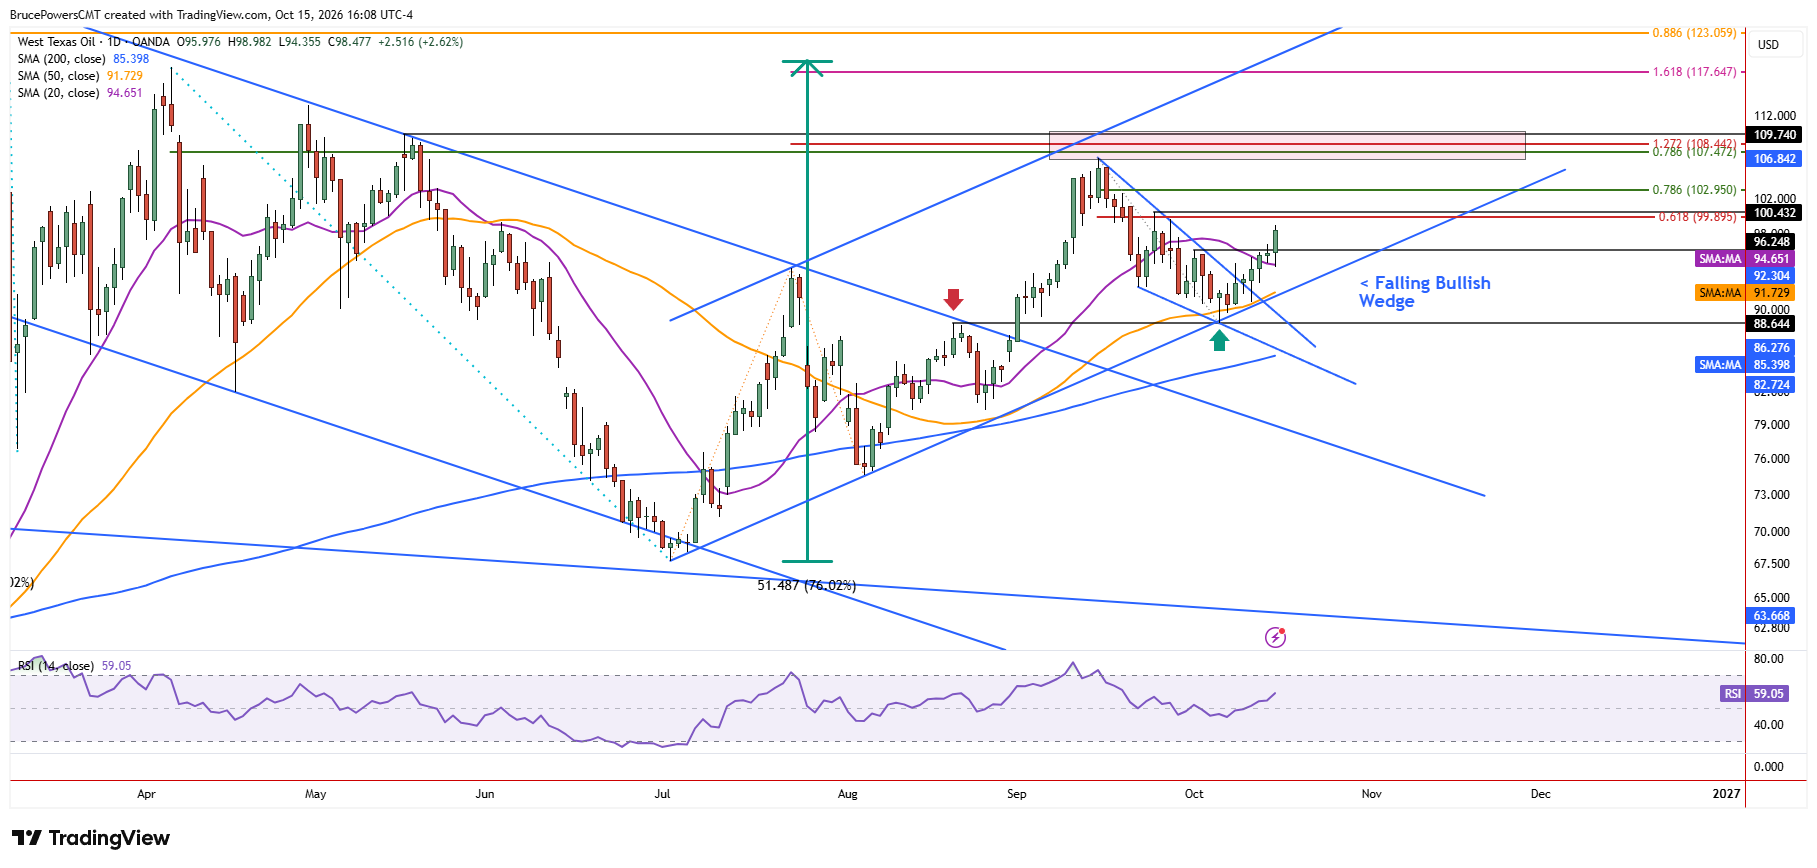
WTI crude oil continued to strengthen on Thursday, extending a rally triggered by a weekly bullish reversal signal on Monday to reach a high of $98.98. Strength was subsequently confirmed by a reclaim of the 20-day moving average, which held as support on Wednesday and Thursday, and a bullish reversal signal triggered by a break above the interim lower swing high at $96.25. With the advance extending into Thursday, crude oil is poised to finish the week in the upper third of its range, reinforcing the improving bullish outlook.

Moving Averages Define Critical Support
A new higher swing low of $88.66 was established last week at a key support zone defined by a rising trendline and the 50-day moving average. The 50-day moving average continues to mark key dynamic support for the rising trend channel, which also aligns with a July low near its lower boundary. Now that the 20-day moving average has been reclaimed, it defines dynamic support for the shorter-term rising trend. It is currently at $94.64, close to Thursday’s low of $94.36, reinforcing this area as important near-term support.
Fibonacci Resistance Sets Next Test
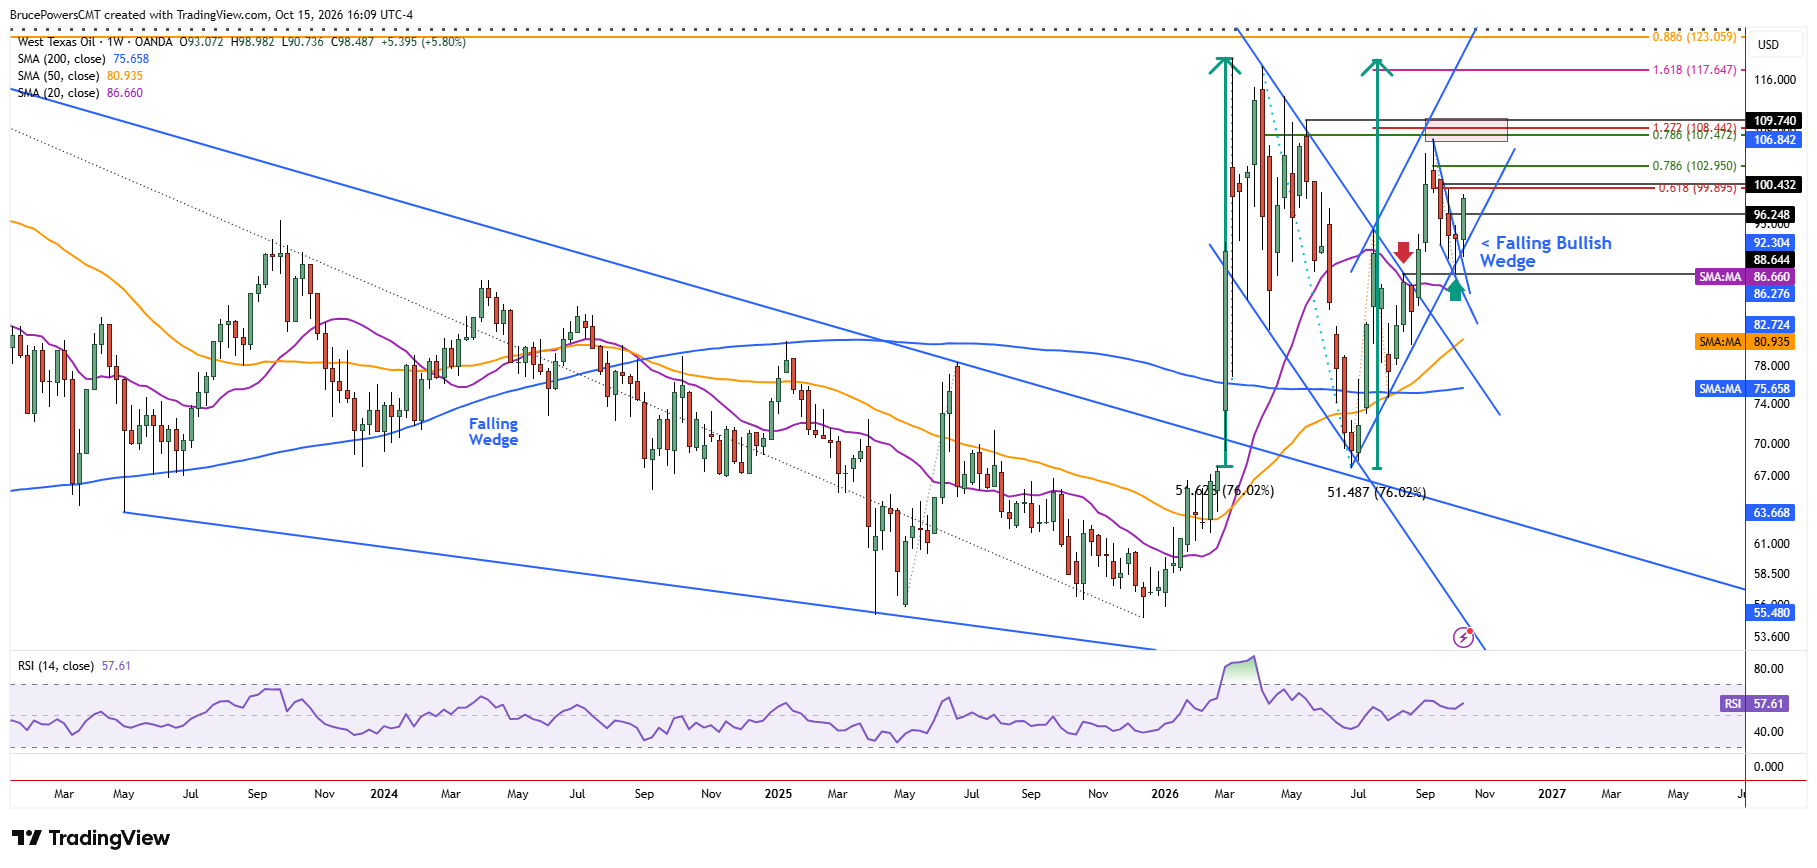
The next upside resistance zone is marked by the 61.8% Fibonacci retracement at $99.90 and the lower swing high of $100.43 from September. An advance above that zone would trigger a significant bullish reversal signal for the prior decline. The rally from a successful test of support near the 50-day moving average also triggered a breakout from a falling bullish wedge pattern, suggesting potential upside toward the formation’s starting point at the recent swing high of $106.84. However, multiple indicators create a confluence of resistance, extending the potential resistance zone to the lower swing high of $109.74.
Weekly Close Could Extend Gains
Key near-term support is now represented by the 20-day moving average, which may need further testing. Nonetheless, a strong weekly close following the bullish reversal signal would reinforce the view that buyers remain in control. Such strength could carry bullish momentum into next week, provided crude oil holds above near-term support and continues to advance toward the $99.90–$100.43 resistance zone.
If you’d like to know more about what drives oil prices, please visit our educational area.