Henry Hub’s fundamental assessment begins with an unresolved storage catalyst and a weather outlook that currently favors warmth across the important central and eastern regions of the United States. The next EIA storage report is scheduled for 10:30 a.m. Eastern today. So, of course, the market will be paying close attention to the new numbers.
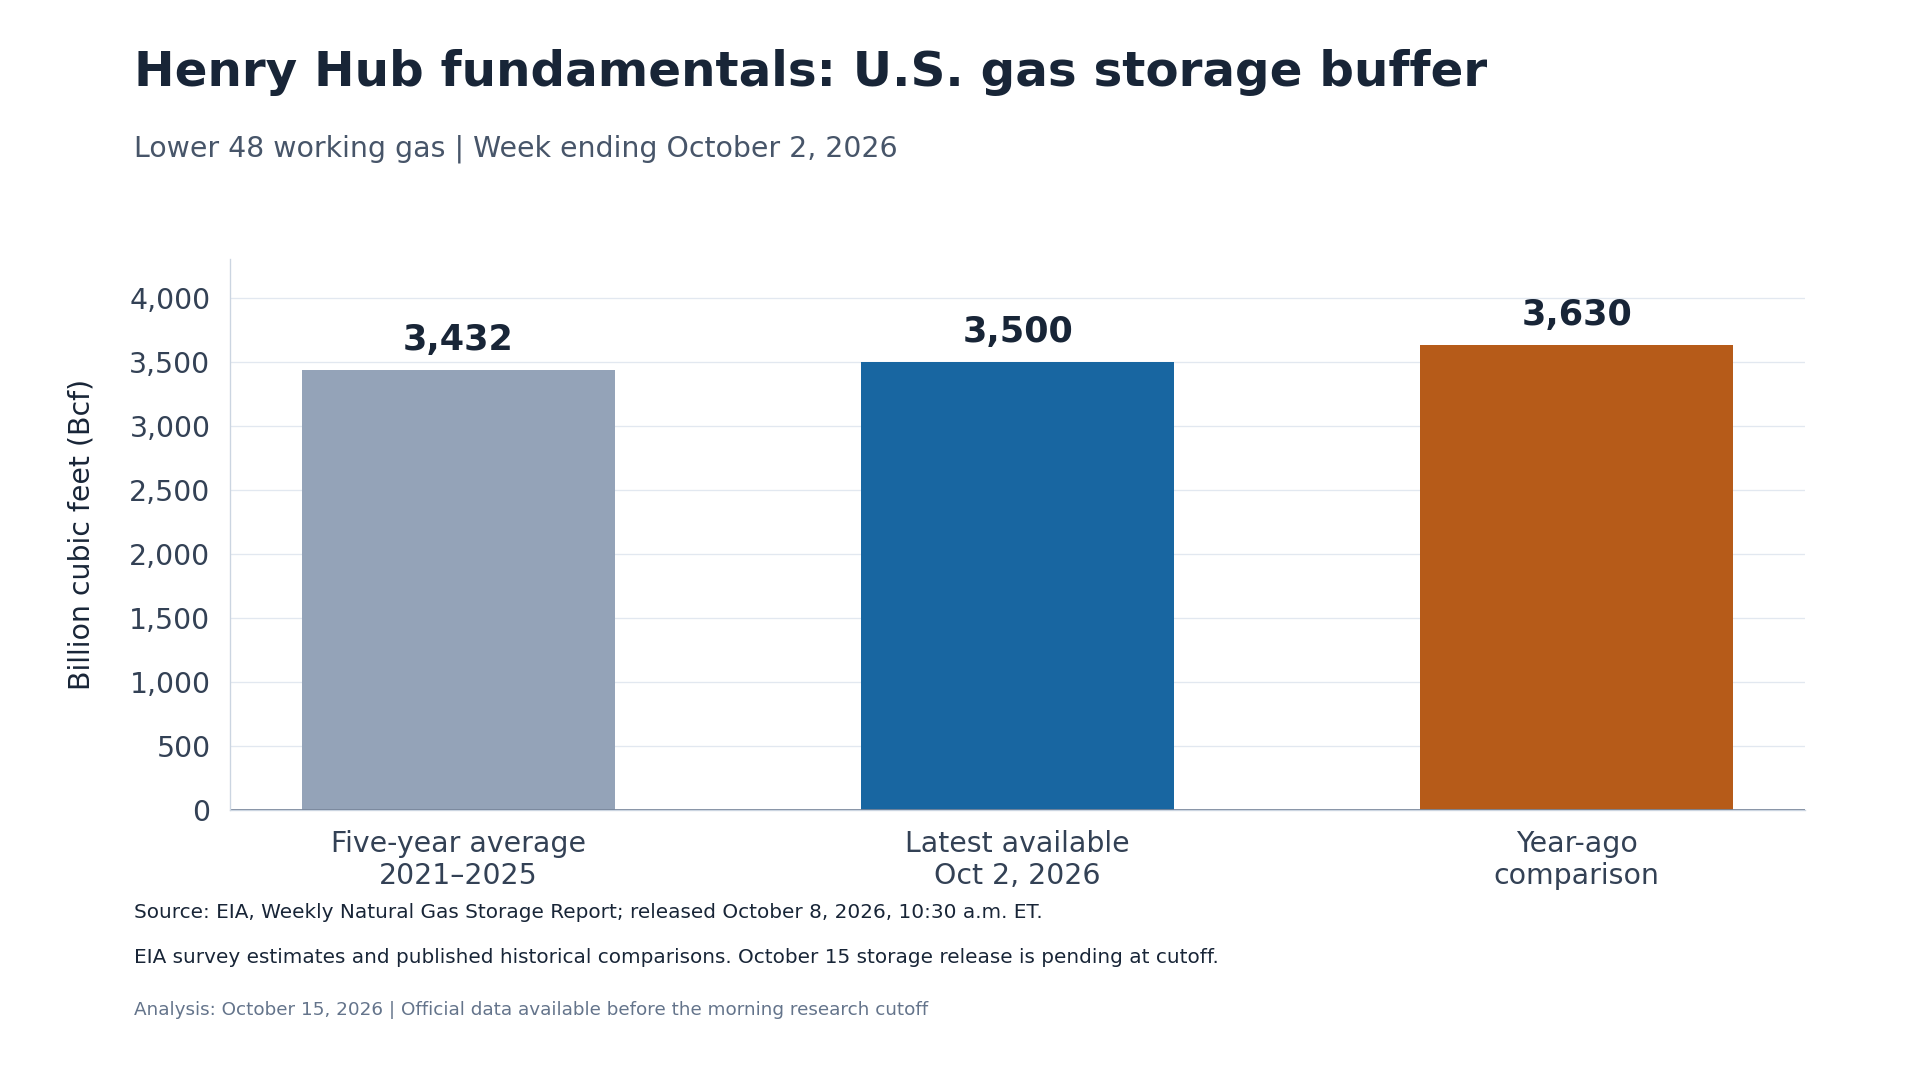
The latest weekly balance remains the October 8 release covering the week ending October 2. The report estimated Lower 48 working gas at 3,500 billion cubic feet after an 85 billion cubic feet weekly injection. Inventories were 130 billion cubic feet below the year-earlier comparison, but 68 billion cubic feet above the five-year average of 3,432 billion cubic feet.

The Two Comparisons Pull in Different Directions
The year-end weather could come into play, but the year-earlier shortfall limits an argument based on abundant supply relative to last autumn, where the surplus against the seasonal average offered a little bit of a buffer. Neither comparison establishes a shortage, though, and what matters next is whether successive injections preserve, widen, or erode the seasonal cushion before sustained heating withdrawals begin in winter.
A large injection would not automatically settle the demand question. Storage change reflects the combined influence of supply, domestic consumption, cross-border flows, and other balancing factors.
Weather Not Supportive at the Moment
Weather offers a more recent official input. NOAA’s Climate Prediction Center discussion issued October 14 favors above-normal temperatures across most of the central and eastern contiguous United States for October 20-24. It places the probability above 70% in parts of the upper and middle Mississippi Valley and western Great Lakes. Below-normal temperatures, however, are favored across much of the West.
Warmth in northern population centers could defer some seasonal heating demand and leave more gas available for injection. That is a conditional demand implication, not necessarily something measured. Southern warmth can also sustain cooling needs, and the net national effect depends on location, intensity, and duration.
Natural Gas Price Forecast
Every new Natural Gas analysis as it publishes, today's technical signal and key levels, live price — on one page.
See all Natural Gas forecastsThe second forecast window is a little less settled. For October 22-28, NOAA still favors above-normal temperatures across most of the East of the Rockies, but also notes increasing uncertainty about the atmospheric pattern. The reading is that an eventual shift toward colder conditions would matter more if it became persistent across major heating regions. As things stand right now, the current outlook does not establish that such a shift has occurred quite yet.
The EIA’s October 6 Short-Term Energy Outlook supply is a broader, explicitly conditional winter baseline. It forecasts end-October inventories of about 3,850 billion cubic feet, roughly 2% above the five-year average, and assumes national winter heating degree days near last year’s level. The inputs were finalized October 1, so subsequent weather or operational developments are outside that model.
Supply and Exports Matter
Supply and exports also need to be considered together. The same outlook projects average U.S. dry production of 112.2 billion cubic feet daily in 2026 and 116.13 billion cubic feet daily in 2027. It forecasts LNG exports averaging 17.6 and 18.6 billion cubic feet daily, respectively.
These annual projections describe competing pressures on the balance. They are not measured at the moment. Rising production would provide more room to satisfy exports and domestic demand, while sustained LNG growth would absorb part of that additional supply. The outcome depends on actual operations. A terminal authorization or capacity announcement cannot establish that a facility is taking its full potential volume of gas.
Regional Constraints
Regional constraints also deserve attention if verified operating notices appear. A national storage cushion cannot establish that every consuming region has equal access to supply during a local bottleneck.
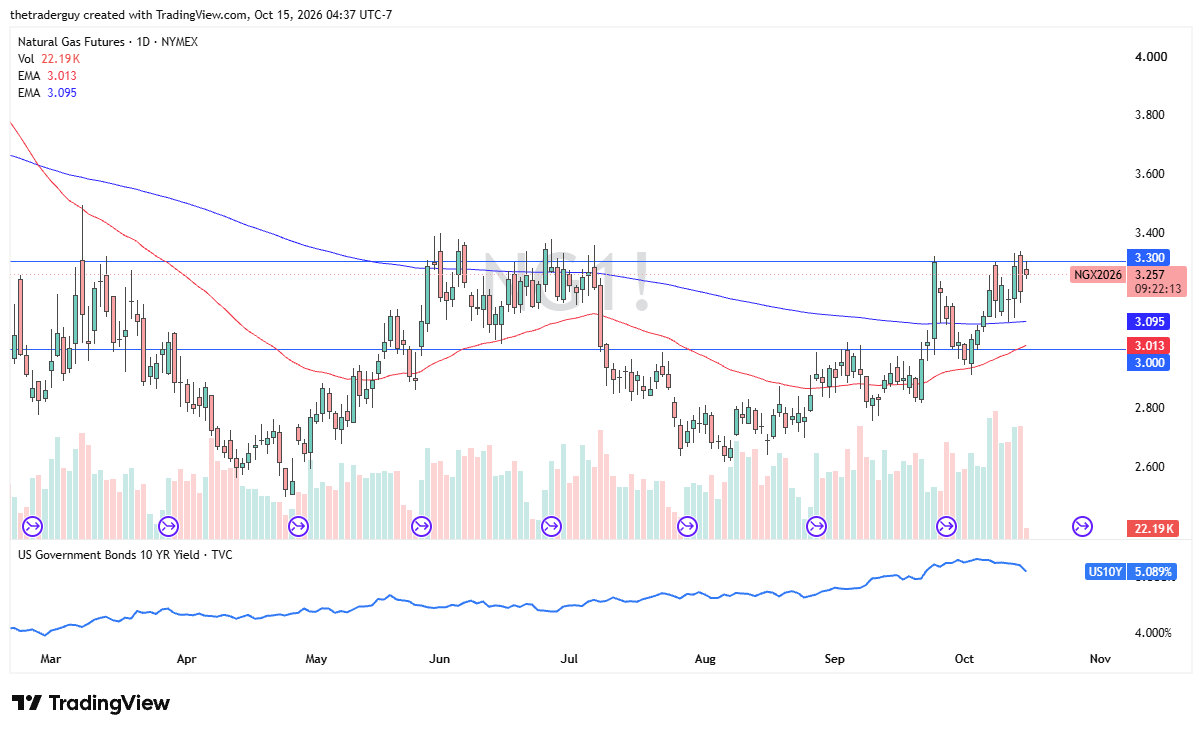
The natural gas market, from a technical analysis standpoint, is obviously seeing a lot of trouble near the $3.30 level. It’s my belief that, in the short term, this market will continue to struggle a bit, and I do think that pullbacks are essentially value plays that are just waiting to happen.
I see the 200-day EMA currently at the $3.095 level as support, right along with $3 underneath that. I will be looking at these pullbacks as short-term buying opportunities, but if the market were able to break above the $3.40 level, then it could be a little bit of a momentum trade to the upside, perhaps as high as $3.60.