Selling Pressure Puts $4,066 at Risk
Selling pressure in gold intensified on Wednesday, with prices falling to $4.073, the second-lowest level of the current bearish correction. The low of the decline stands at $4,066 and is at risk of breaking, potentially signaling a continuation of the bearish trend. Sellers remained in control at the time of writing, with trading in the lower third of the day’s range. Gold therefore appears on track to establish its lowest daily close of the current correction within the larger bearish structure. A close below $4,110 would add to the bearish evidence, while a break below $4,066 would provide further confirmation of downside continuation.

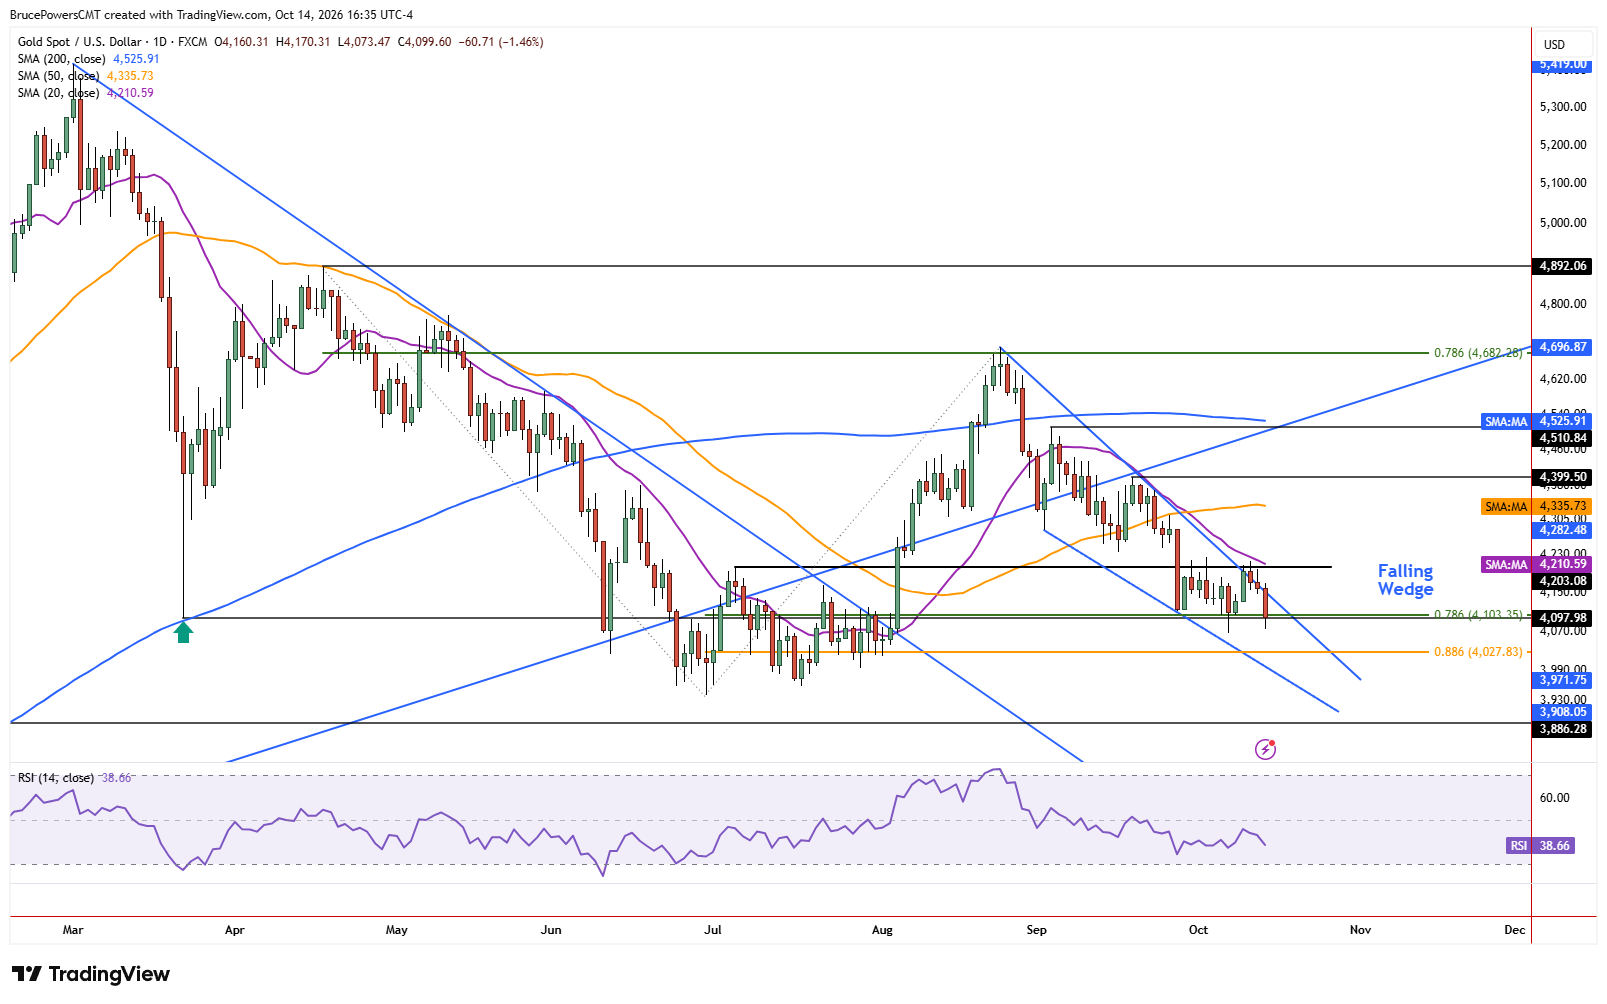
20-Day Average Confirms Overhead Resistance
Resistance was confirmed on Monday when an advance failed at the 20-day moving average, which continues to act as dynamic trend resistance. The implications became apparent during Wednesday’s session as bearish momentum intensified. Key near-term support at the 78.6% Fibonacci retracement level of $4,103 was broken again on Wednesday, adding to the bearish evidence. This further weakens the case for a sustained recovery and leaves gold vulnerable to another test of its correction low.
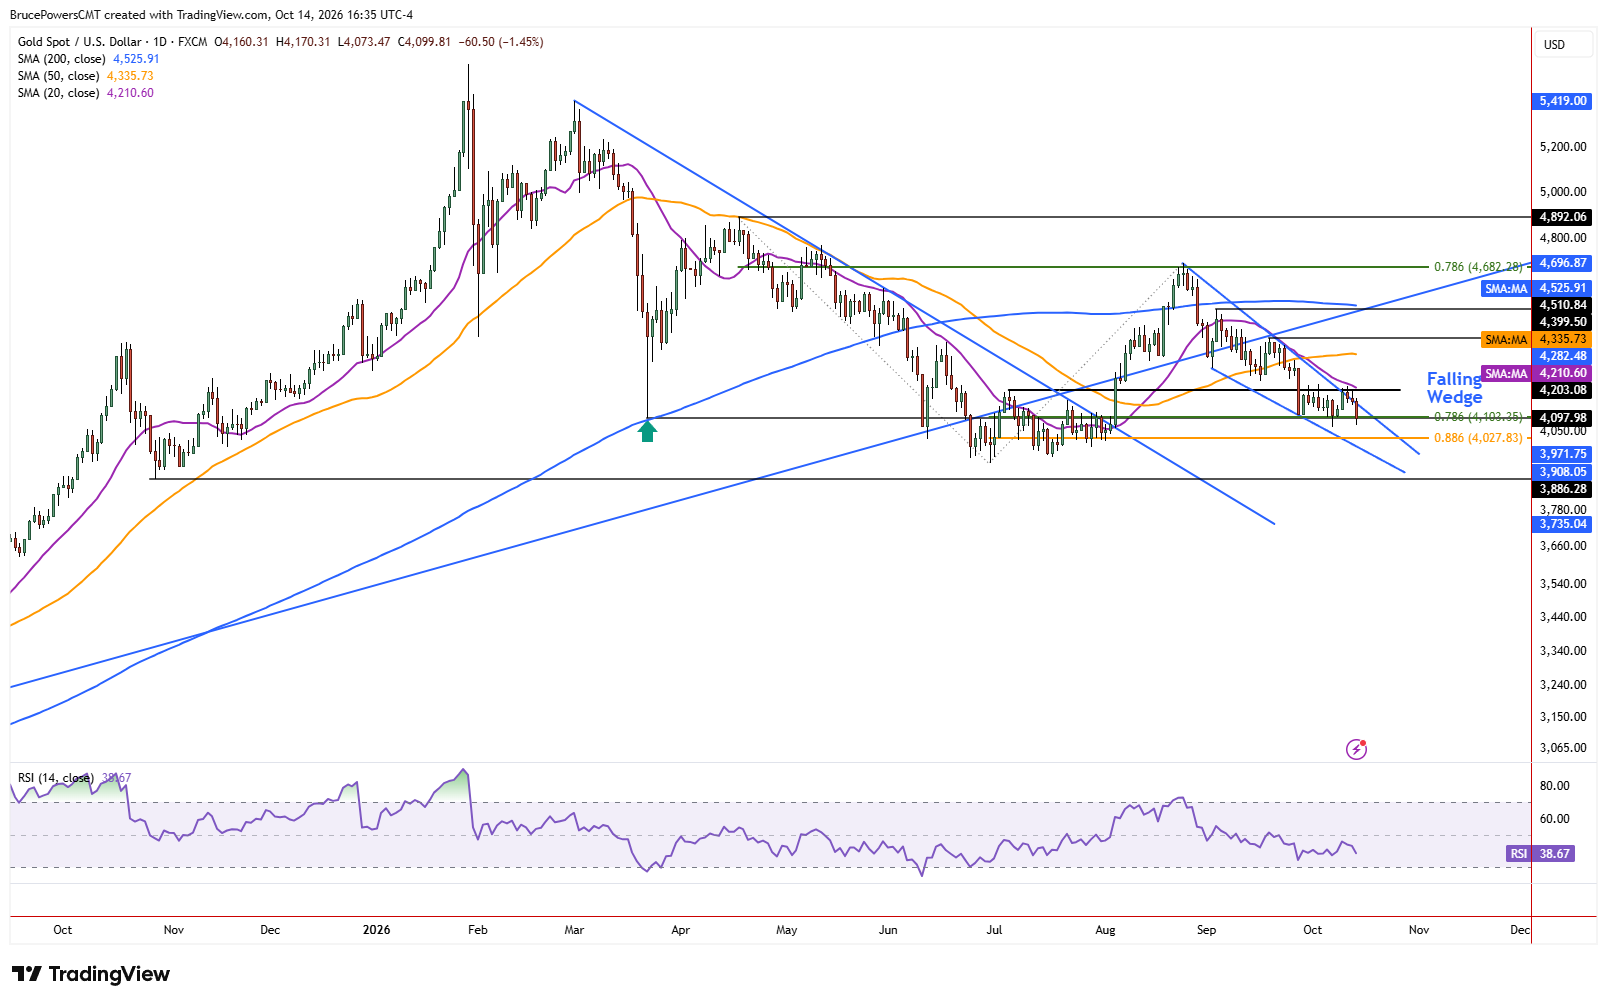
Broader Trend Favors Sellers
Wednesday’s weakness suggests that the downtrend from the January peak at $5,597 could continue. The recent lower swing high of $4,698 from August may become another defining point in the bearish structure of lower swing highs. Alternatively, the current decline could find support and reverse higher, provided prices hold above the higher swing low of $3,942 from June. The bias remains to the downside since gold remains below major moving averages and selling pressure is intensifying. The $4,066 low is therefore the immediate level to watch for signs of further weakness.
Fibonacci Support Defines Next Downside Zone
If gold breaks below $4,066, the next lower potential support area is defined by the 88.6% Fibonacci retracement of the prior advance at $4,028. Gold found support near both the 61.8% and 78.6% Fibonacci retracement levels during the correction, making the 88.6% level a potentially significant area for another reaction. It is reinforced by the summer trading range, which provides a broader support zone extending toward its low of $3,942. A break below $4,066 would expose this next retracement target, while a sustained recovery from the current levels would be needed to challenge the prevailing bearish pressure.