Sellers Regain Control Near Resistance
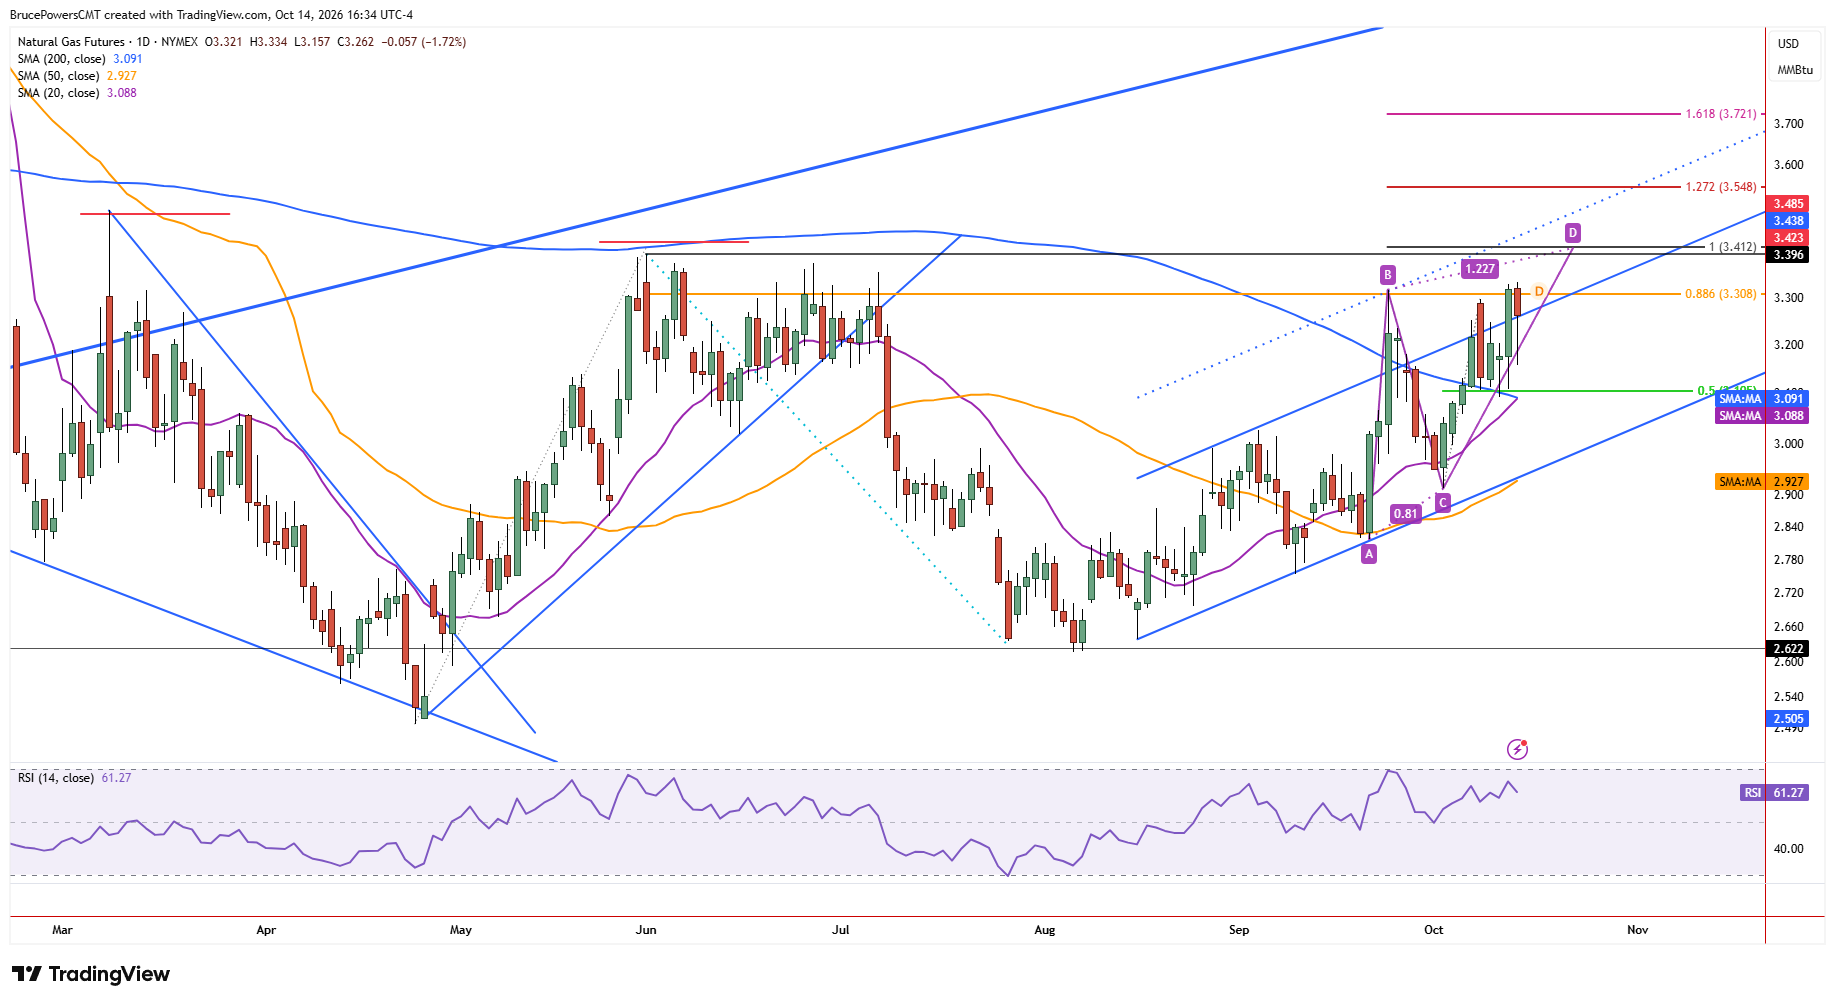
Natural gas rose to a marginal new high of $3.334 on Wednesday before sellers regained control and drove prices lower throughout the session. That high fell within a resistance zone defined by the September high of $3.317 and Tuesday’s high of $3.33. Despite Tuesday’s bullish extension of the short-term advance, Wednesday’s selling has been decisive, with natural gas continuing to trade near the session low of $3.157, at the time of writing. Natural gas therefore appears poised to close near its intraday low, signaling a loss of short-term momentum even as the broader trend remains bullish.

Broader Trend Holds Despite Reversal
Nonetheless, unless key support breaks, the trend remains bullish, suggesting that the resistance zone may again be challenged and possibly exceeded. Tuesday’s rally extended the advance from the August bottom, reinforcing bullish signals across the monthly, weekly, and daily timeframes. Last month’s high was $3.317 and October’s high so far is $3.334. Also potentially significant is quarterly resistance at $3.355. An advance above last quarter’s high would signal a quarterly reversal, adding to the potential for upside continuation.
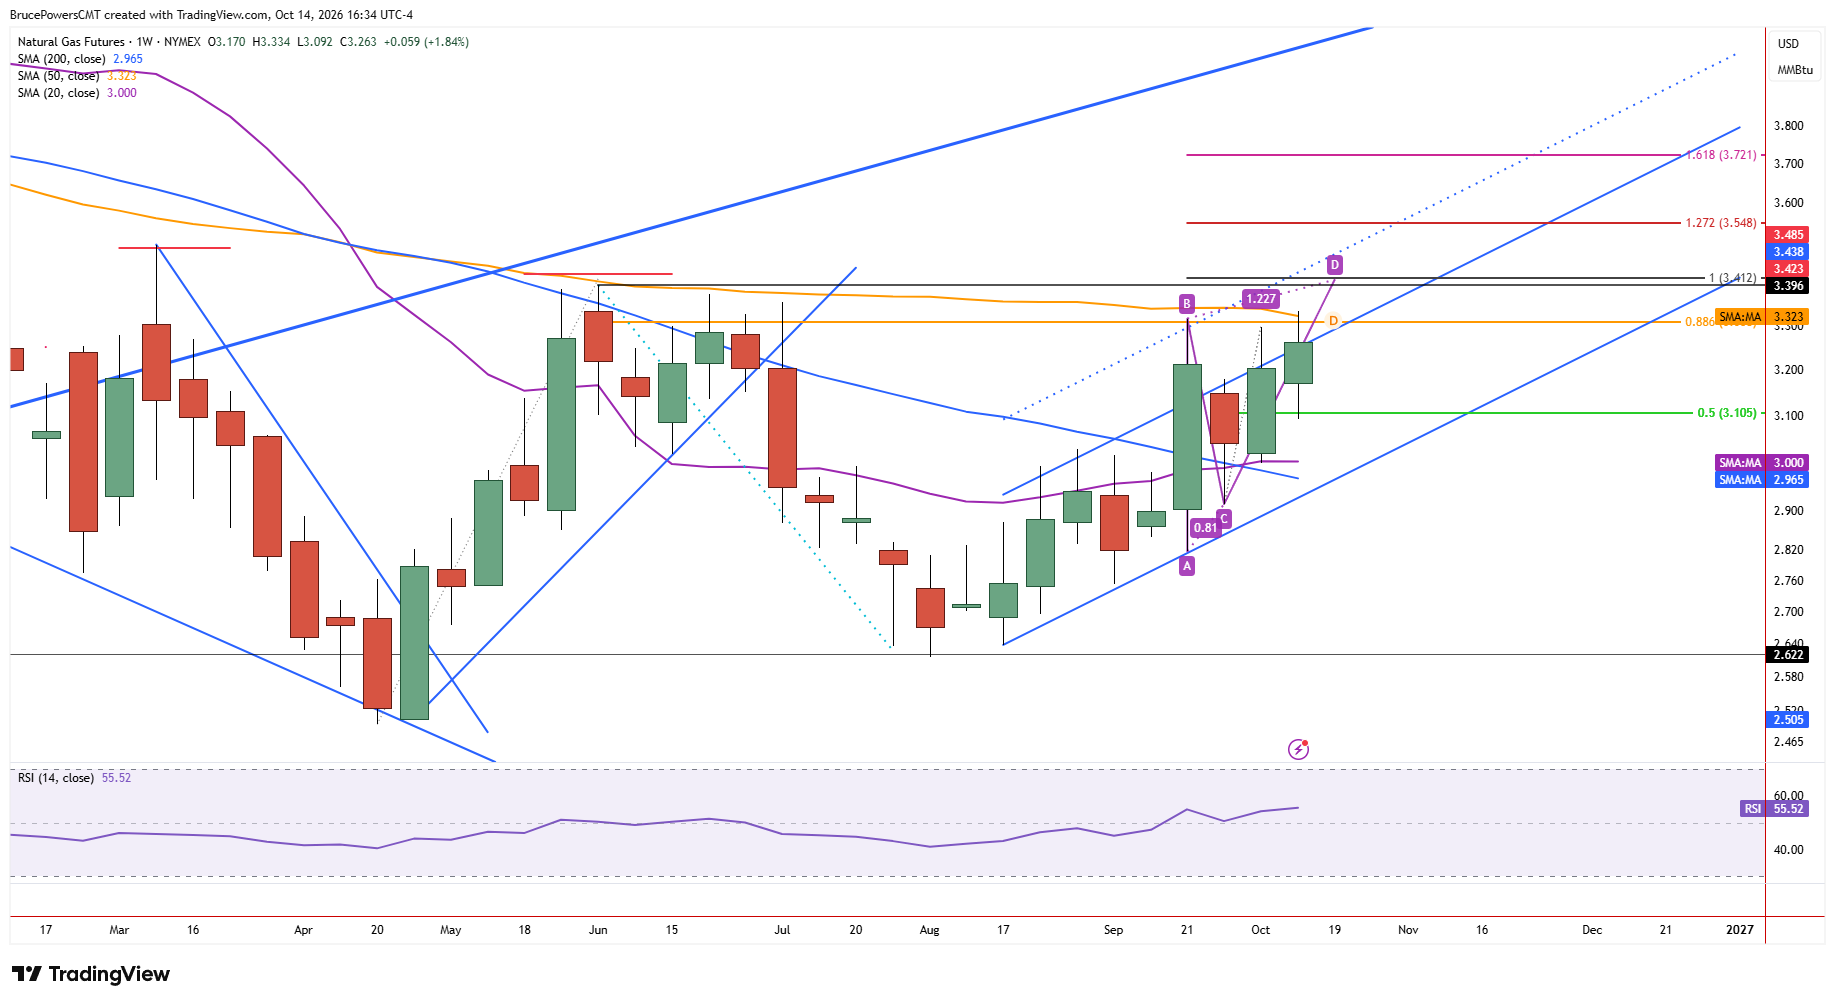
So far, this week has established a higher weekly high and a higher weekly low, currently at $3.092. Although the weekly candle remains incomplete, a decline below that level would expose the prior week’s low of $2.997 and the 20-week moving average near $3.00, as a potential downside target zone. However, the bullish weekly trend structure of higher weekly highs and higher weekly lows remains intact unless prices fall below last week’s low.
$3.09 Support Becomes Critical Test
On the daily chart, the recent swing low of $3.092 is a key support level since a drop below it would reverse the short-term bullish trend structure. The subsequent advance to a new high reflected improving demand, while Wednesday’s price action is on track to establish a higher daily high and higher low.
Short-term bullish momentum may soon receive additional confirmation if the 20-day moving average crosses above the 200-day moving average. The importance of the $3.092 swing low is reinforced by the nearby 200-day moving average, now near $3.09. A break below this confluence would weaken the bullish outlook, while continued support could allow natural gas to retest the $3.317-$3.334 resistance zone.