



Gold: CPI Holds the Key as Fed Keeps Another Hike in Play
Gold’s view is focused on the U.S. inflation report due out on Wednesday. It will give us a clearer picture on the Fed’s next move. Do expectations suggest the CPI report will show a slowdown in inflation? Probably not. Energy costs are up, and traders are looking for headline CPI to come in at around 3.6% year-over-year. Fed Funds Futures are pointing to a roughly 22%-23% chance of a rate hike in October, and an 88% chance of rate hike by December hike.
New York Fed President John Williams, and Boston Fed President Susan Collins have echoed similar thoughts, and are also looking for a possible further rate hike this year. The Fed Funds rate is currently in the target range of 3.75%-4.00%. Higher rates are a headwind for non-yielding bullion.
Investment demand is also exceptionally strong, and global gold ETFs added another 67 tonnes in September, bringing total holdings to a record 4,256 tonnes. Record third quarter inflows of $31 billion have been reported.

Silver: Tight Supply Meets Softer Industrial Demand
Gold and silver are expected to have similar price action, based on inflation and Fed risks. However, given the current fundamental supply and demand dynamics for the physical market, silver is in a tighter condition compared to gold.
The Silver Institute expects a sixth straight structural deficit in 2026. Estimates show the structural deficit would be 46.3 million ounces of silver, with a cumulative drawdown of 762 million ounces since 2021.
Given continued demand for silver in industrial applications, fabrication is expected to decline by 3% in 2026, to a four-year low. Solar manufacturers are expected to decrease the use of silver in fabrication, and substitute other materials.
However, demand is expected to rise for bars and coins by 18%, providing an offset for lower industrial demand.
Gold Price Forecast
Every new Gold analysis as it publishes, today's technical signal and key levels, live price — on one page.
See all Gold forecastsGold Technical Analysis: XAU/USD Holds $4,159 as Rising Trendline Keeps Recovery Alive
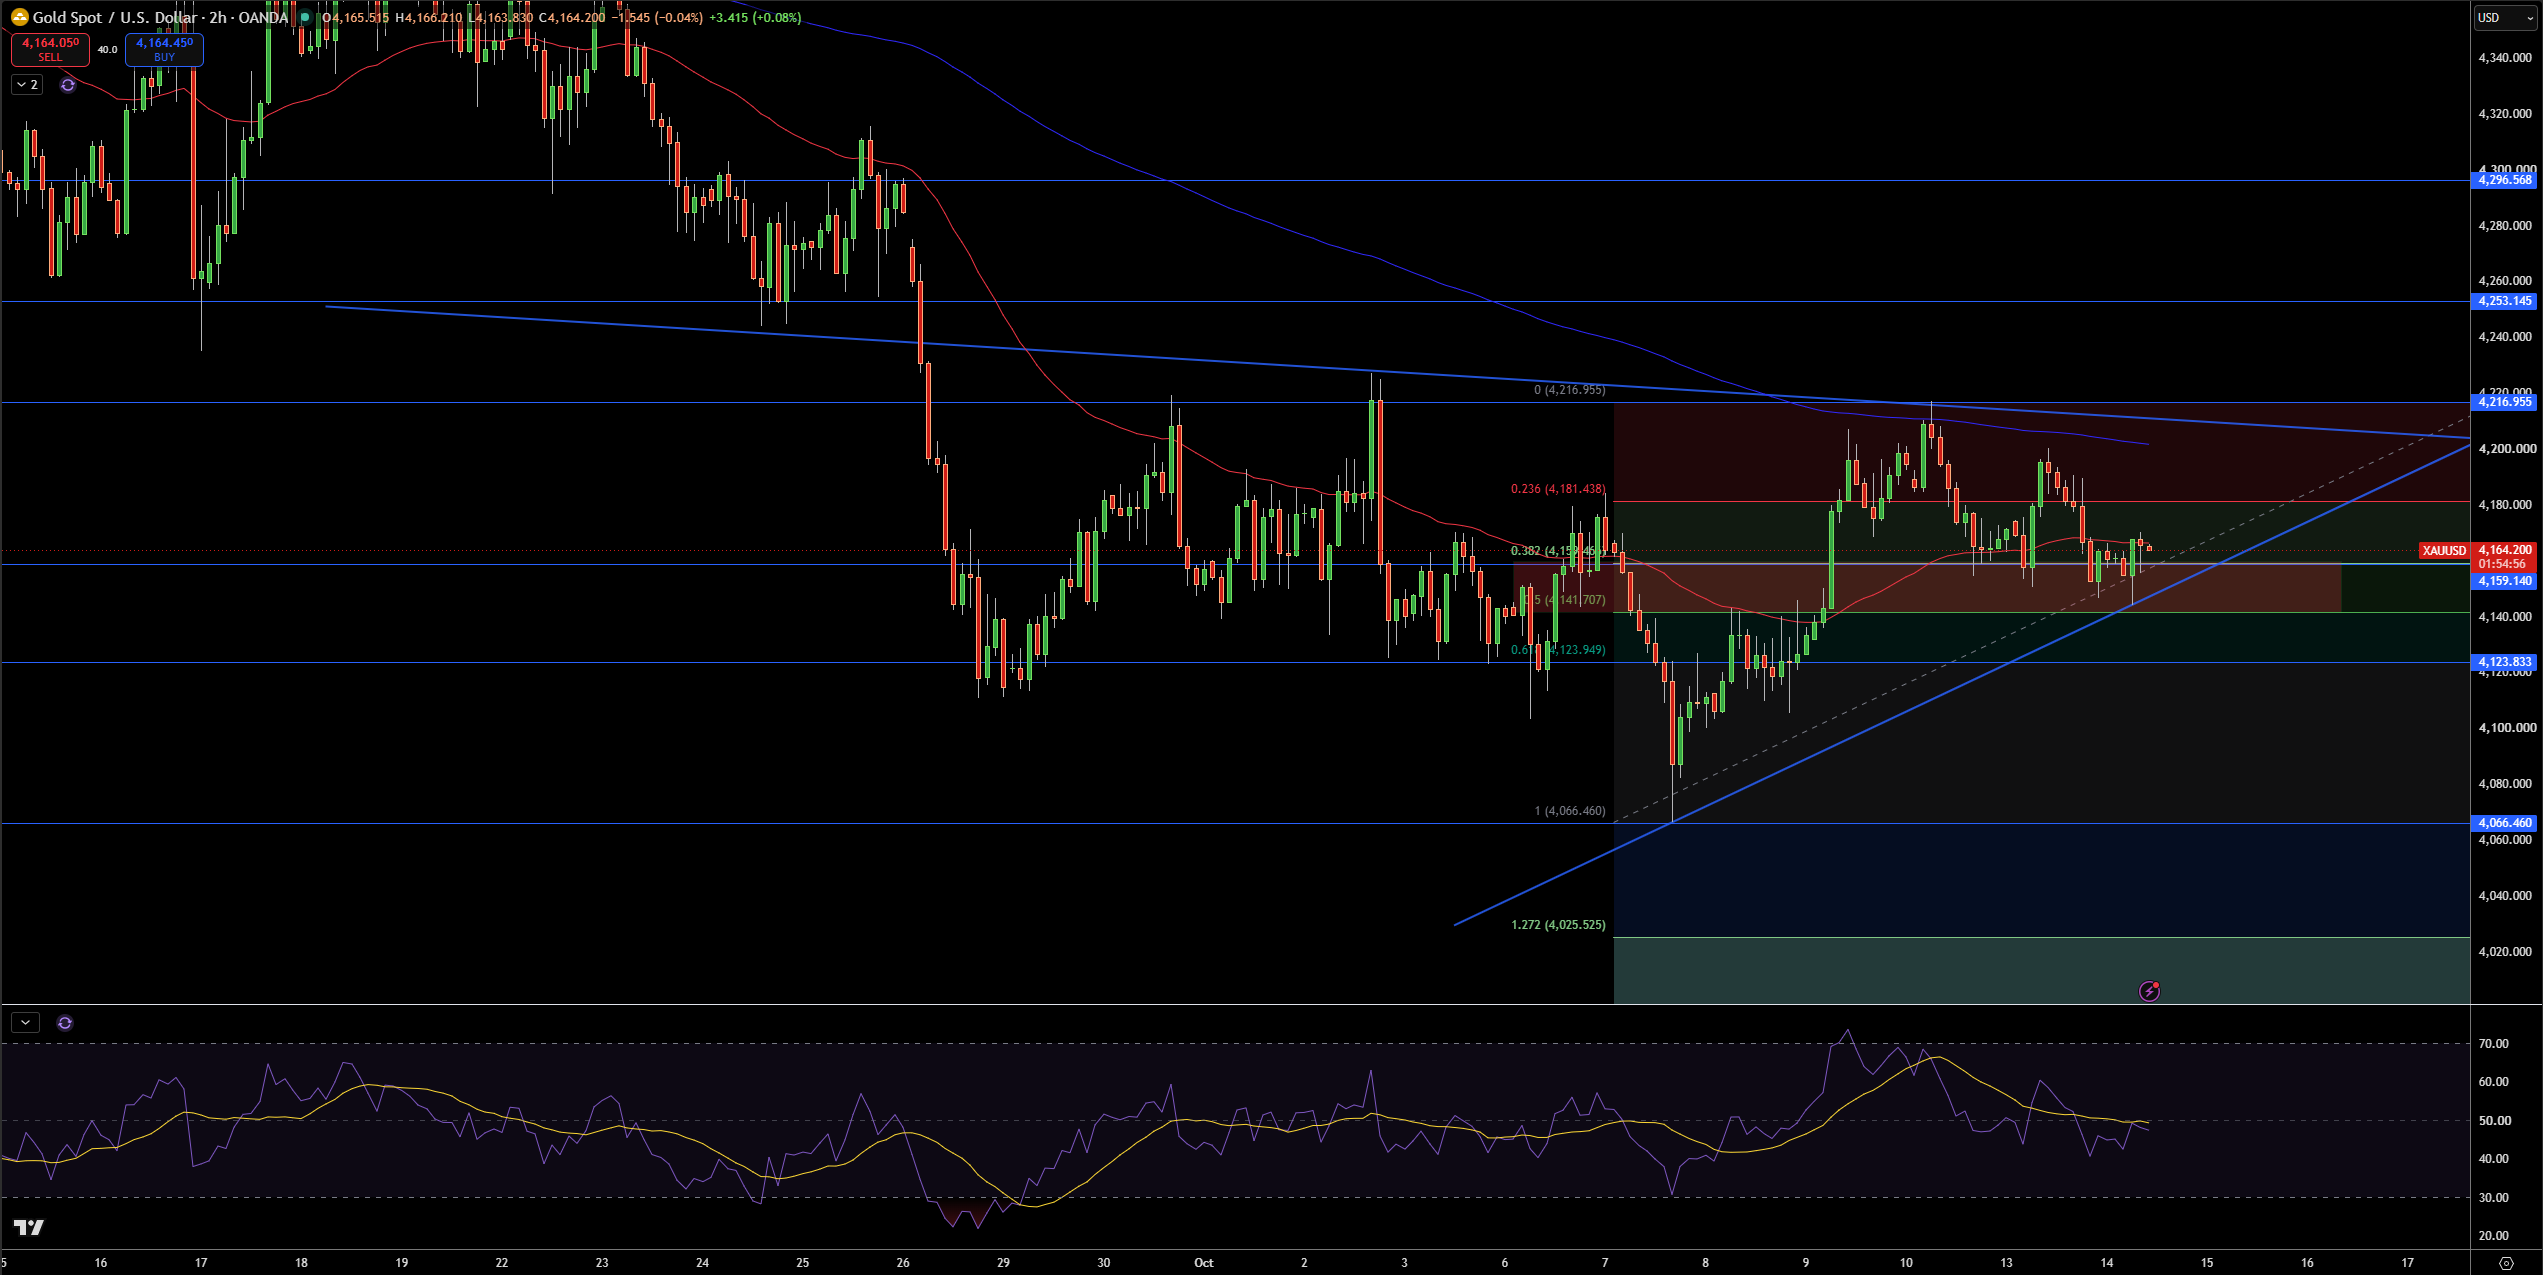
In the 2-hour chart, the current price of gold is at around $4,164. What is notable, at least for now, is price is still respecting the rising trendline from the recent lows at $4,066. In the short-term, the recovery is still valid. However, gold is still stuck below the overall bearish trendline as well as the $4,181 – $4,217 resistance zone. So, a full trend reversal has not occurred for gold bulls just yet.
$4,181.44 is the first resistance level, followed by $4,216.96. Above that zone, resistance comes in at $4,253.15 and $4,296.57. Support is initially expected at $4,159.14, with $4,123.83 and $4,066.46 becoming progressively more relevant with a break of the rising trendline.
The RSI is around the 50 level, indicating a neutral bias. However, a slightly bullish bias is still valid as long as gold is trading above $4,159 and the rising trendline. As long as $4,159 and the rising trendline hold, the bullish case remains valid. Conversely, a break below $4,123.83 would invalidate the bullish case for now.
Silver Technical Analysis: XAG/USD Slips Below $59.83 as $58.68 Support Comes Back Into Focus
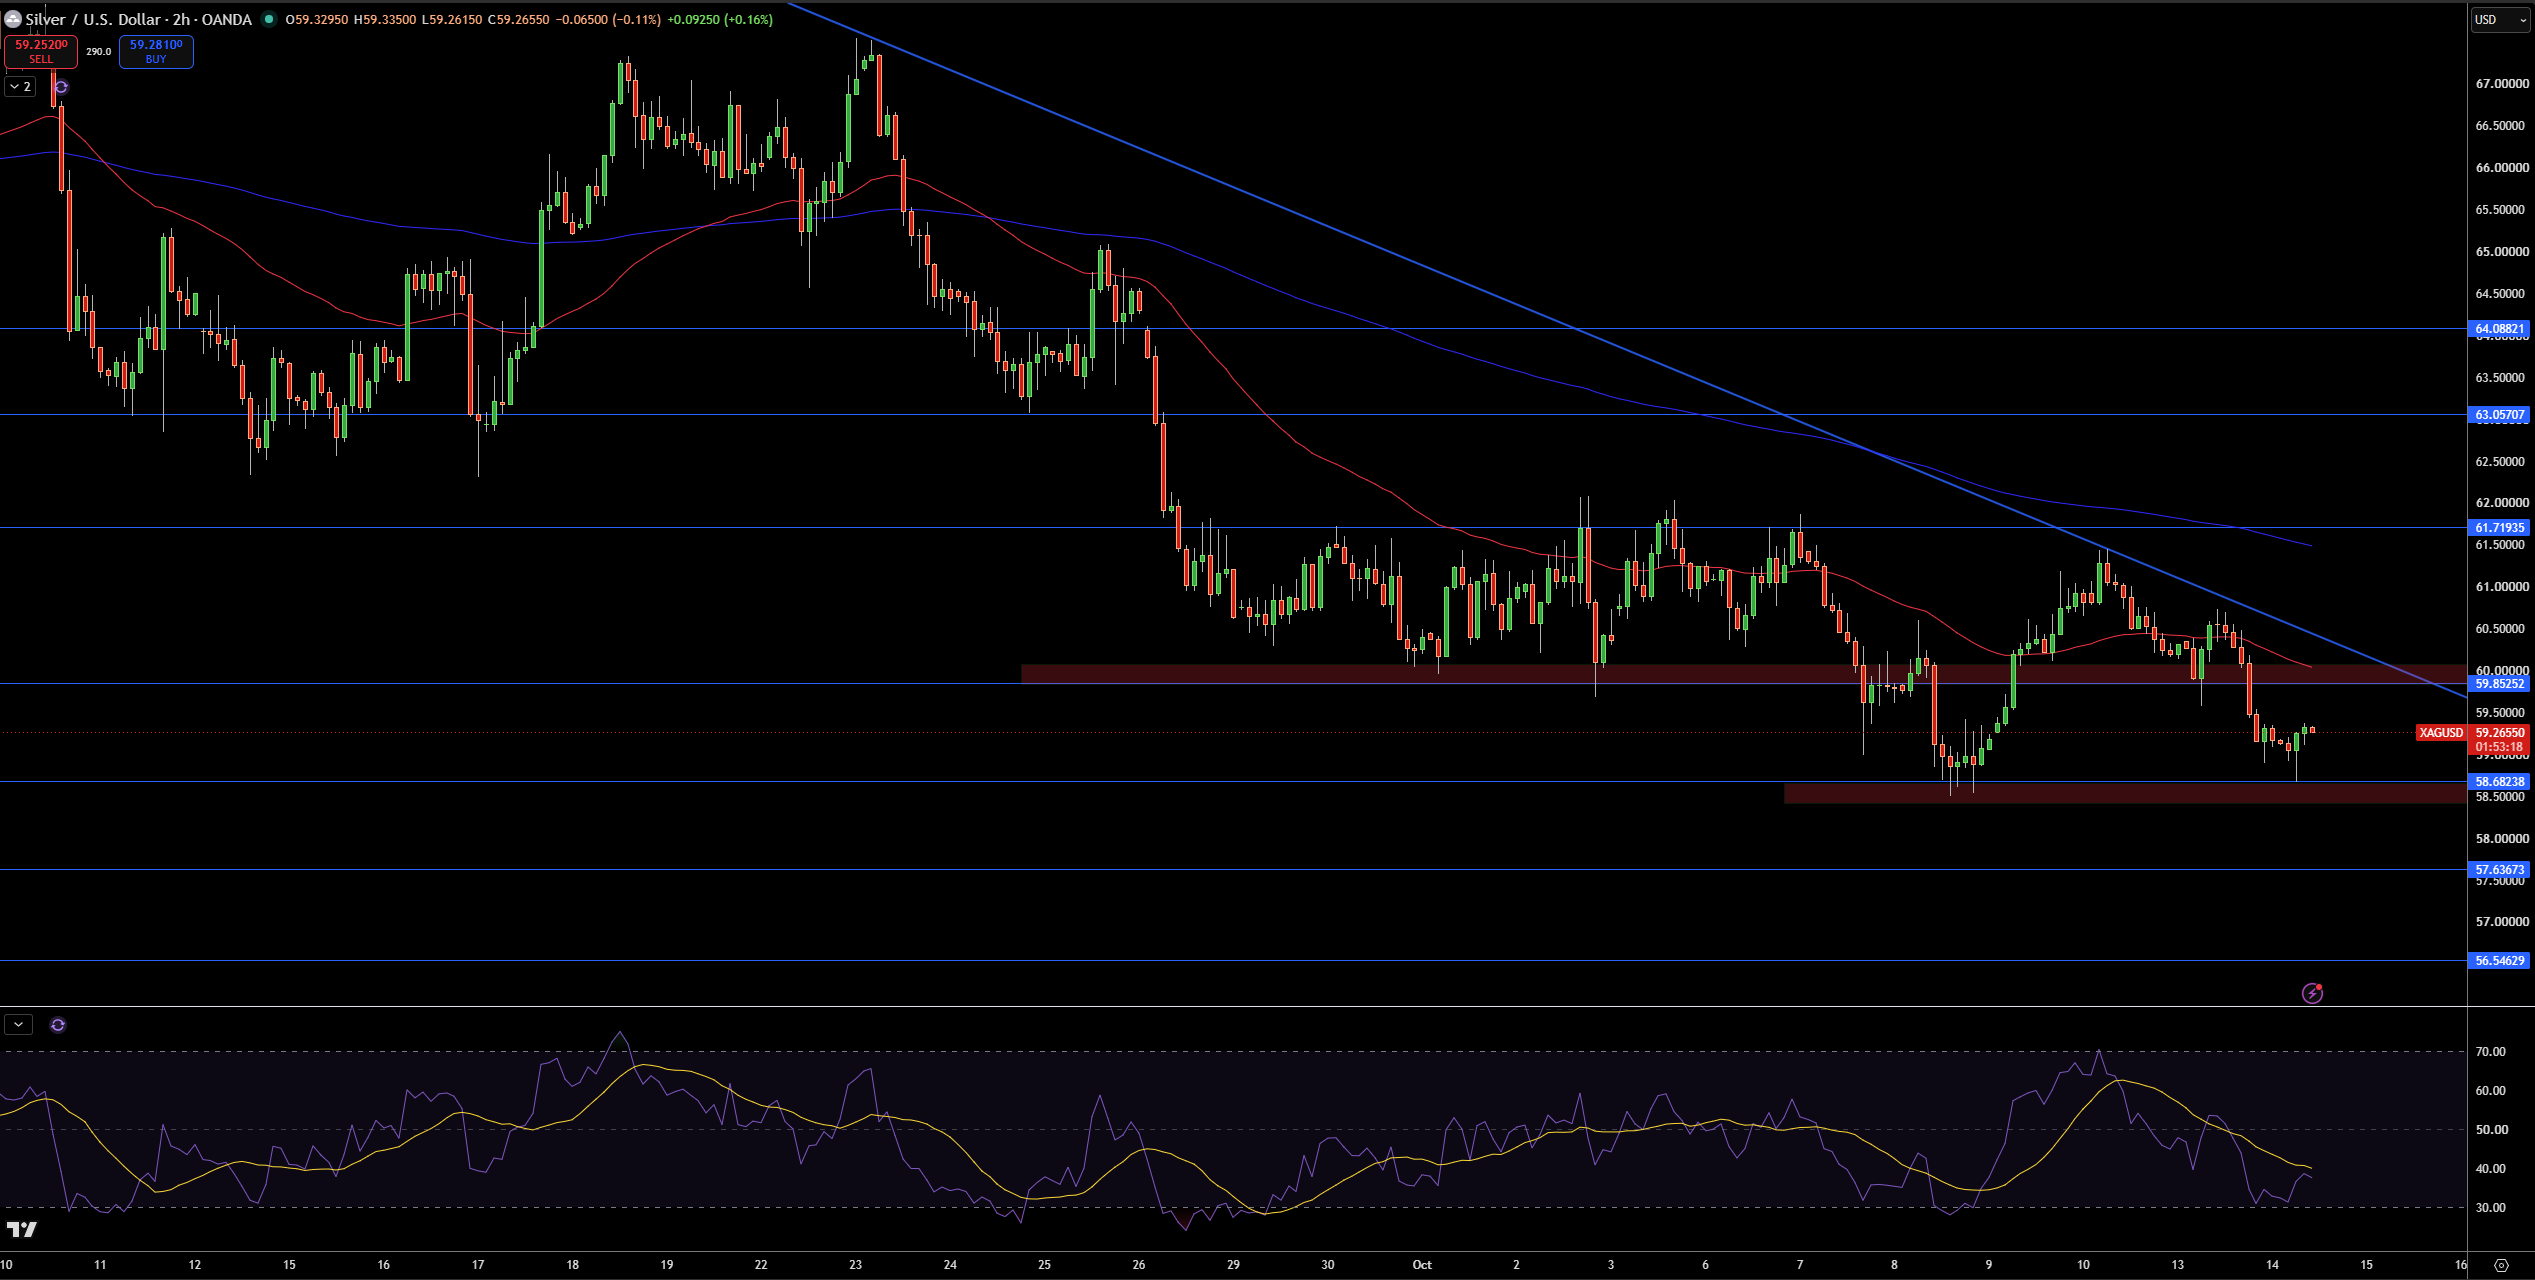
Silver is currently trading at $59.27. I like to draw trends on the 2-hour chart, so I will focus on the short term trend for now. Price is currently trading below both of the moving averages as well as the trendline. I am also looking at the longer term trend where price is still trading below the descending trendline and has recently failed to reclaim the $59.83- $61.72 resistance.
I will watch $58.68 for support. If that breaks we will look to $57.64 and $56.55 for support. Resistance is $59.83 and $61.72. If we take a further long term trend view, $63.06 and $64.09 will come into play if they are retested.
RSI is still in the lower half of its range. While in the shorter term, the market has been trading sideways, I will maintain a bearish bias while price is trading below the $59.83 resistance and the descending trendline. I will take a bullish bias if price moves above $61.72. If price breaks $58.68, I will take a bearish bias and look for further support at $57.64.


