


Bullish Breakout Builds Above $3.317
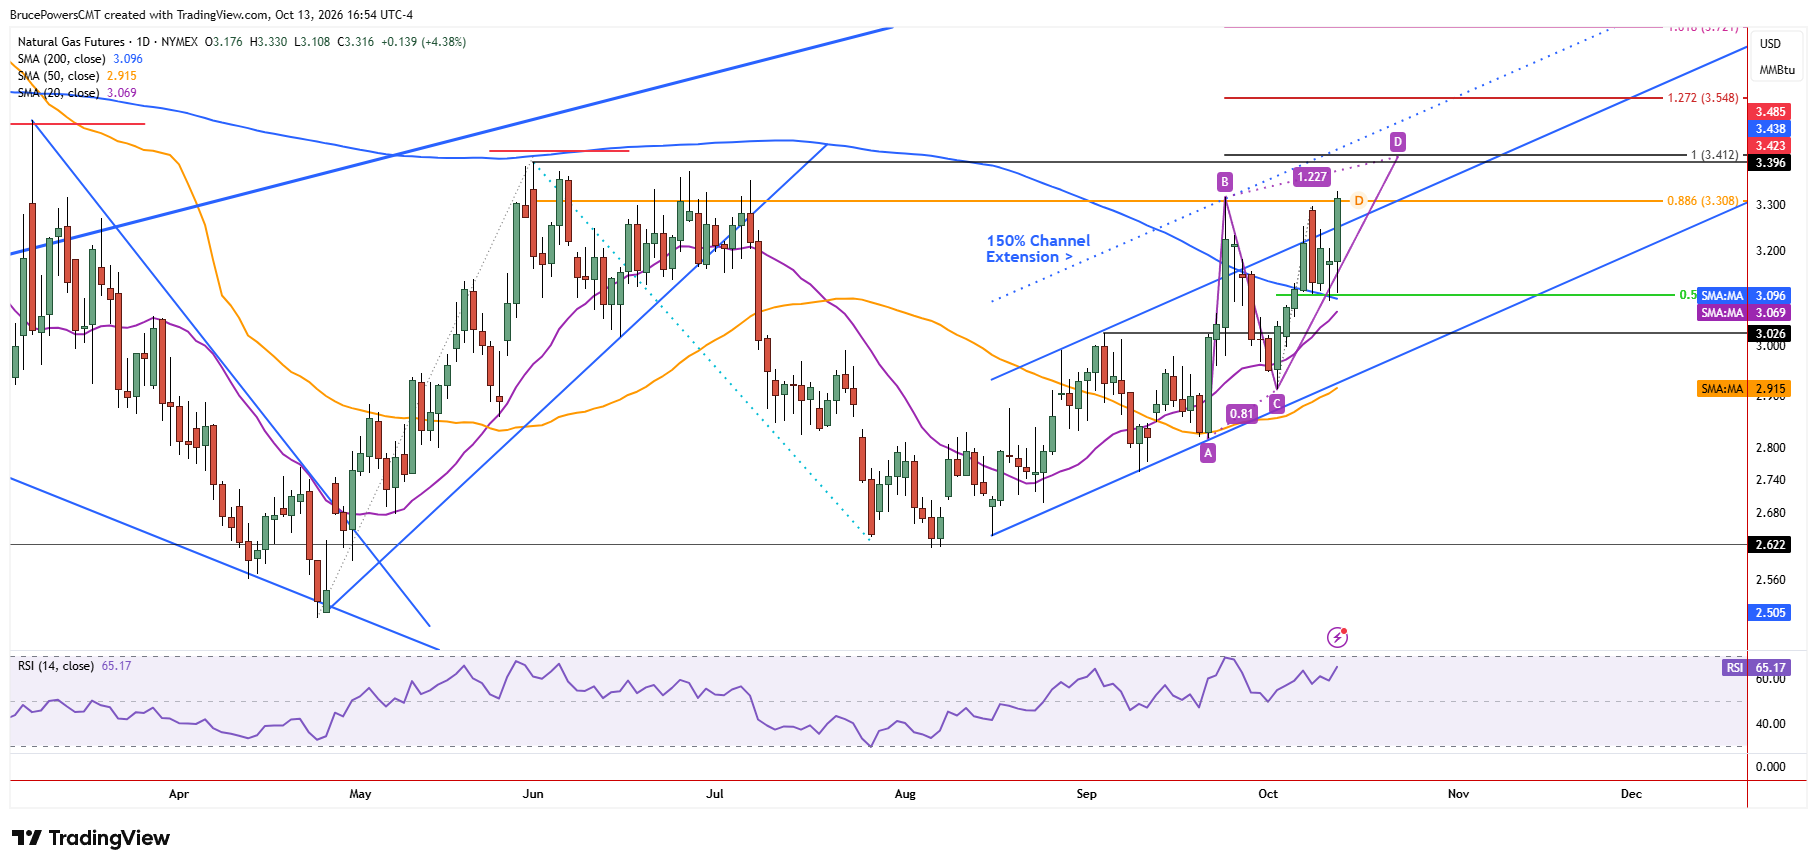
Natural gas signaled a continuation of its bullish trend on Tuesday, extending above $3.317 to a new trend high of $3.33. This suggests that the potential to extend the larger bullish trend to test higher potential targets starting with the lower swing high of $3.16 from June. The day’s low of $3.108 retested key support near the 200-day moving average near $3.10 for the fifth consecutive day before establishing a higher daily low and rallying. Strength is set to further confirm with Tuesday’s session likely ending at its highest daily closing price since the larger advance began after the August low of $2.616.

Reclaiming Key Resistance Opens Higher Targets
With a sustained reclaim of the 200-day moving average, the bullish outlook for natural gas improves overall. Since a lower swing high was generated at $2.616 in August, a rally above the June high of $3.396 would indicate a higher swing high, which is bullish and would signal the possible upside continuation of the larger structural advance. Given the power indicated by Tuesday’s strong bullish day, that possibility needs to be considered. If that occurs, the first two upside targets would be defined by a prior lower swing high at $3.49, followed by an earlier lower swing high near $3.66.
ABCD Pattern Reinforces Upside Potential
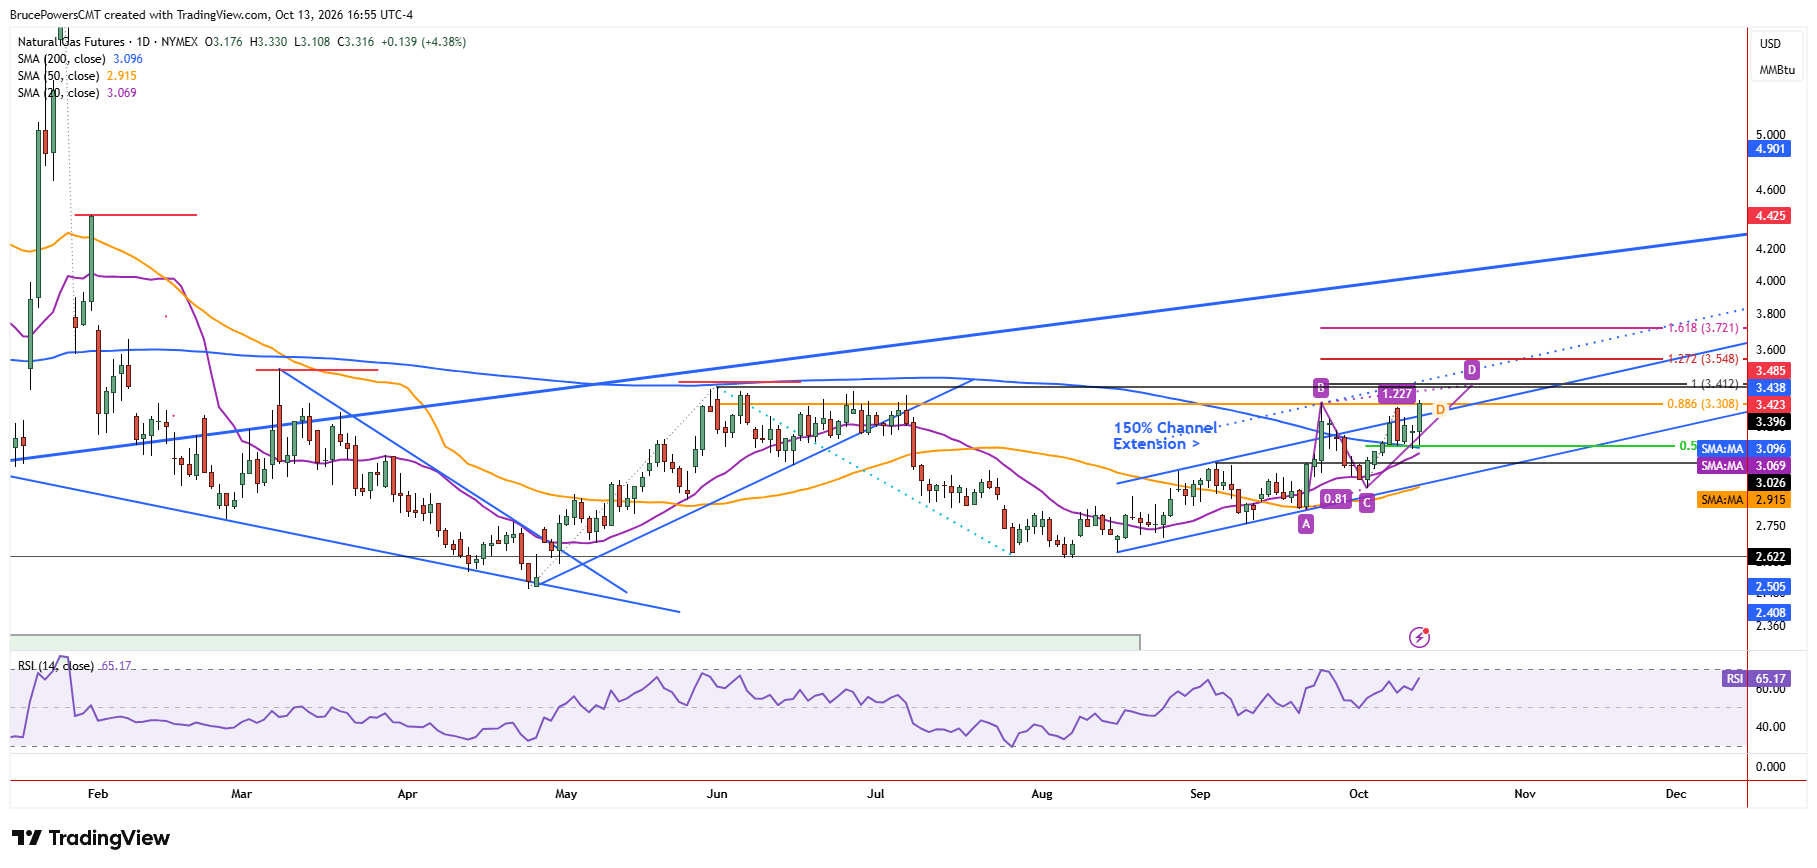
The June high target of $3.396 is supported by the completion of a rising ABCD pattern nearby at $3.41. That increases its potential as a target and the significance of an upside breakout. Projected upside targets from the ABCD pattern point to the $3.55 area, which completes a 127.2% Fibonacci projection, and the 161.8% Fibonacci projection at $3.72. The potential of a test of those higher targets is support by the long-term rising trendline that failed as support in February. It may yet be tested as resistance with the current advance.
Pullback Support Levels to Watch
Given the above bullish indications, short-term weakness is likely to see increasing demand in anticipation of eventual upside follow-through. Are to watch for possible support on pullbacks include Friday’s high of $3.25 and Monday’s high of $3.20.


