Gold: Inflation Test Looms as Bond Yields Ease
The gold outlook improved slightly on Tuesday, as the U.S. dollar and Treasury yields fell. The benchmark U.S. 10-year Treasury yield fell to 5.19% as tech stocks in Asia sold off. Investors were once again taking safe-haven bets.
Precious metals are sensitive to U.S. inflation, and tomorrow’s Consumer Price Index report will be the main driver for the asset class. Currently, markets assign a 19% probability of an interest rate hike at the Fed’s next meeting in October, but an 85% probability of a hike by December. Cleveland Fed President Beth Hammack believes the Fed funds rate should reach a restrictive level relatively quickly, and noted in a speech on Monday that underlying inflation is still in the mid-to-high 2% range.
Global ETF holdings of gold recorded 4,256 tonnes in September after inflows of $10 billion that month and third-quarter inflows of $31 billion.

Silver: Investment Demand Offsets Slightly Declining Industrial Demand
Like gold, silver is also benefiting from falling Treasury yields and a softer dollar, but the stronger upside in silver has been attributed to rising geopolitical uncertainties. Like gold, the biggest driver for silver is expected to be tomorrow’s CPI report.
The Silver Institute expects 2026 will mark the sixth consecutive year of a silver market deficit. Industrial fabrication of silver is expected to fall 2% to 650 million ounces in 2026. A reduction in silver loadings in the solar industry and substitution away from silver are expected to reduce silver demand from solar cells.
Investment demand is expected to help counter falling industrial demand. Indian silver ETFs saw inflows of 19.74 billion rupees in September as investors sought exposure to the precious metal.
Gold Technical Analysis: XAU/USD Holds Rising Trendline as $4,217 Remains the Key Breakout Test
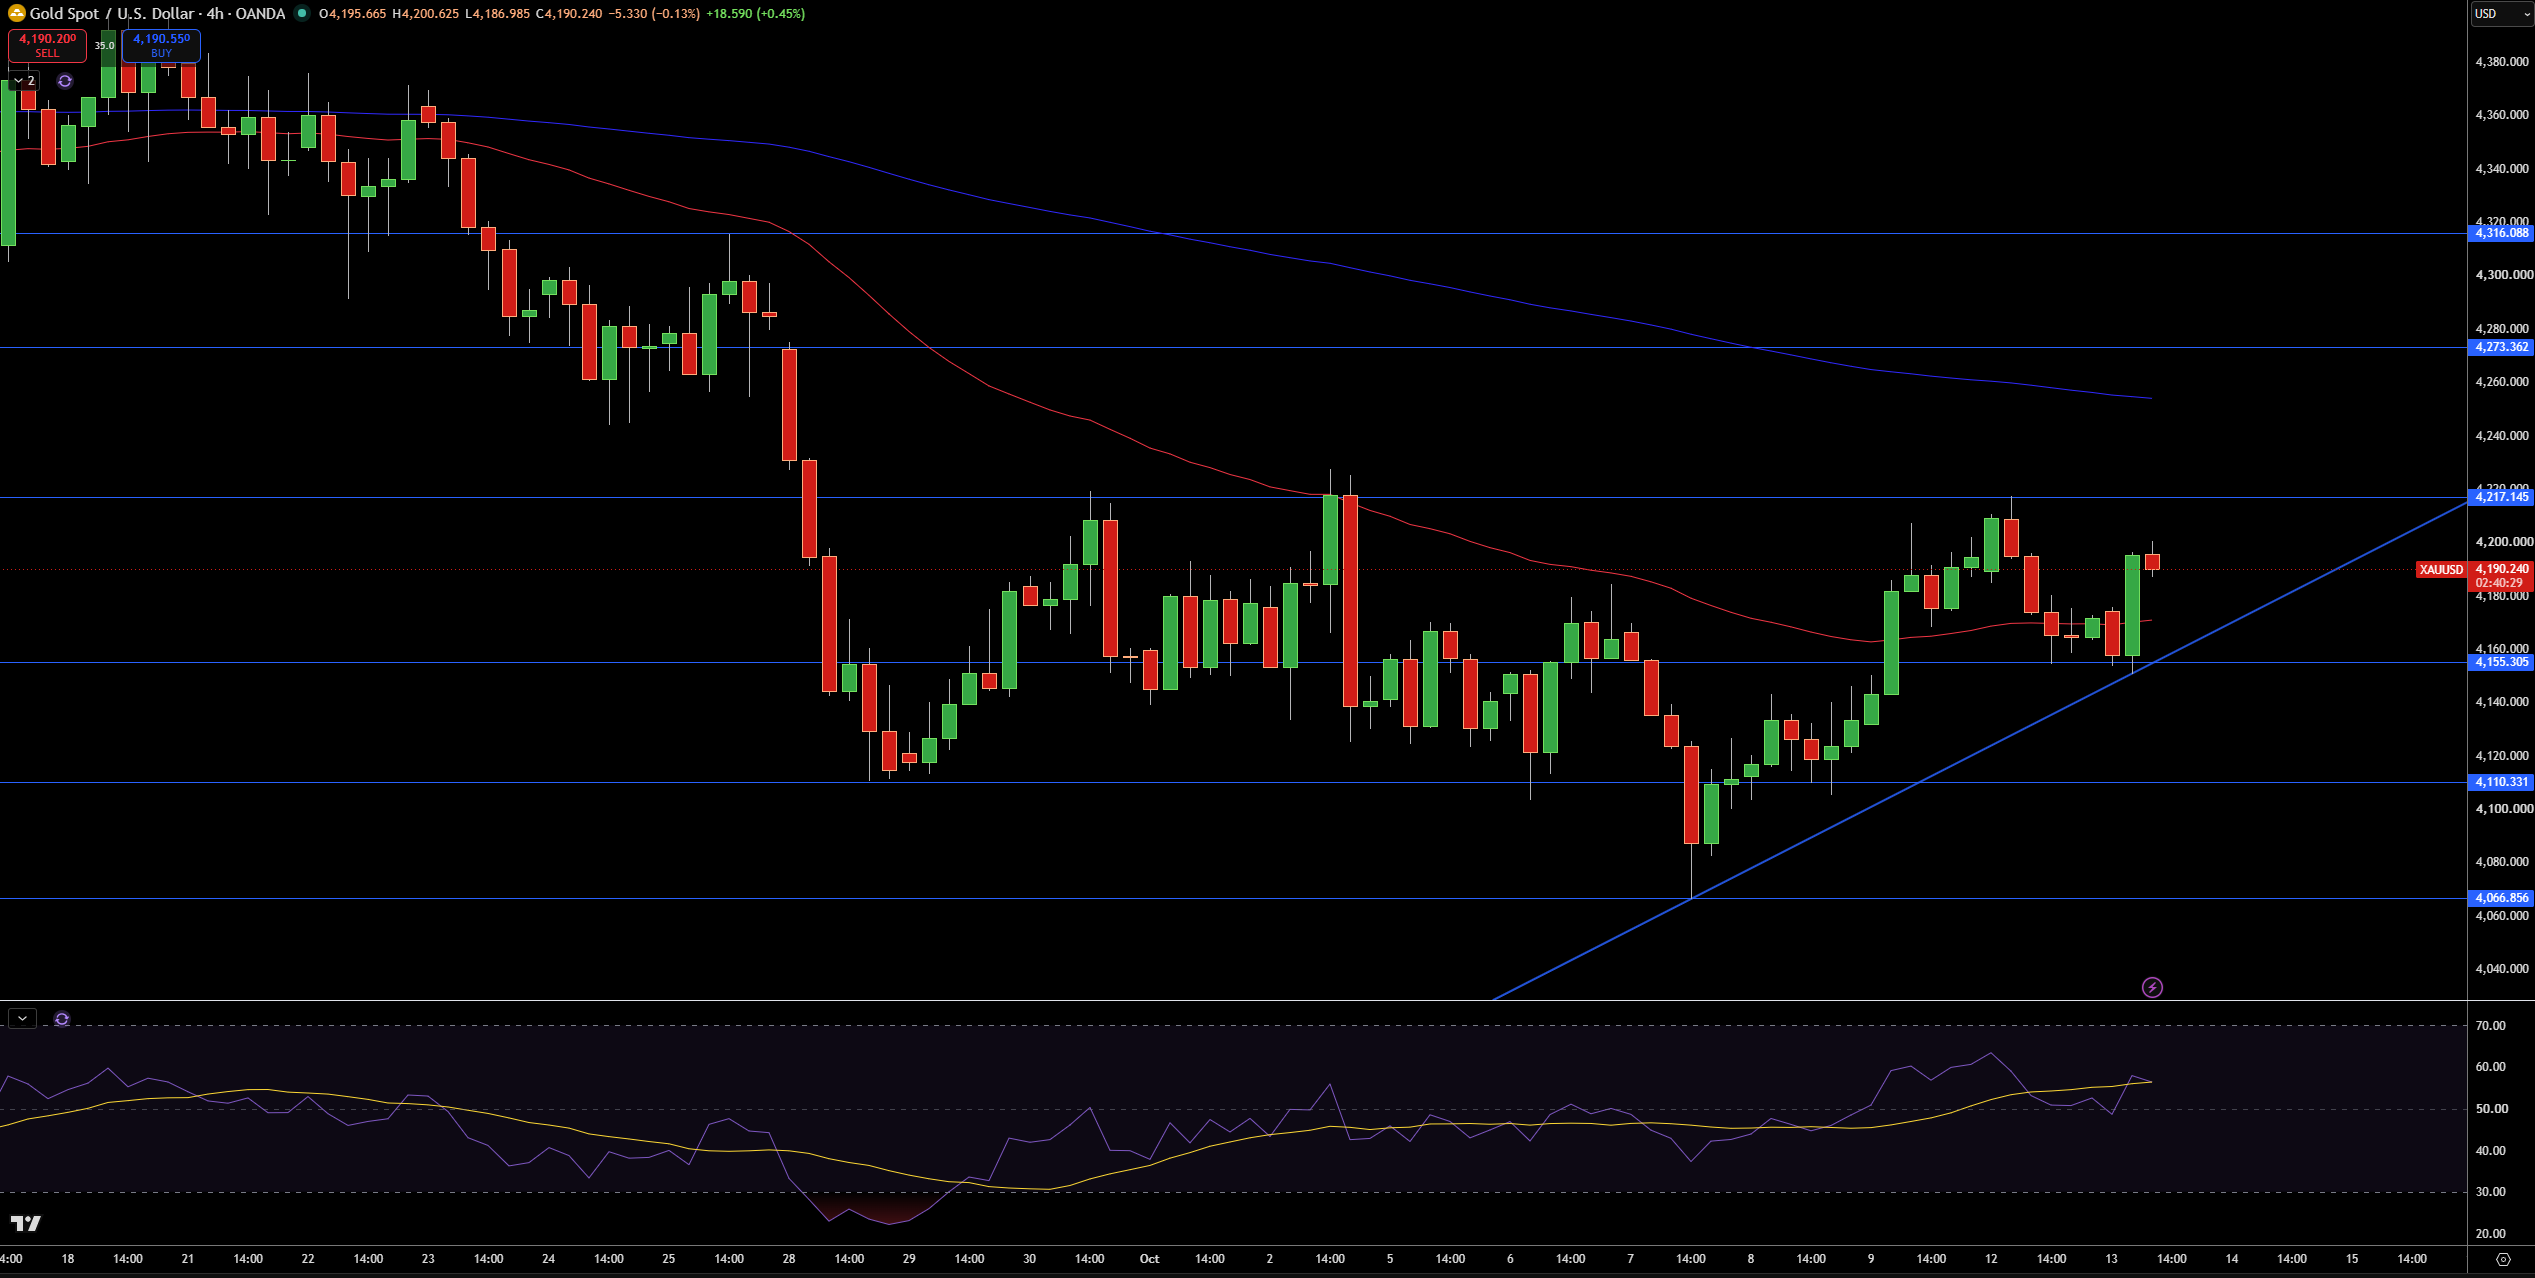
Gold is currently around $4,190.24 on the 4-hour chart, and what is interesting is that price is still touching the rising trendline from the recent low at $4,067. For the time being, the short-term recovery structure is still in place. However, price is still below the longer-term moving average and the resistance zone at $4,217 – $4,227.
Gold Price Forecast
Every new Gold analysis as it publishes, today's technical signal and key levels, live price — on one page.
See all Gold forecastsThe first resistance is at $4,217.15. A clear break above that would open $4,273.36 and $4,316.09. The support for the current recovery is first at $4,155.31, then $4,110.33, and $4,066.86.
RSI is currently very slightly above 50, and therefore in a positive zone, but not in an overbought zone. As long as price is above $4,155 and the rising trendline, I will be bullish. A break and close above $4,217 would give more weight to the $4,273 target, and a break and close below $4,155 would boost the bearish case.
Silver Technical Analysis: XAG/USD Tests Descending Trendline as $61.72 Remains the Main Barrier
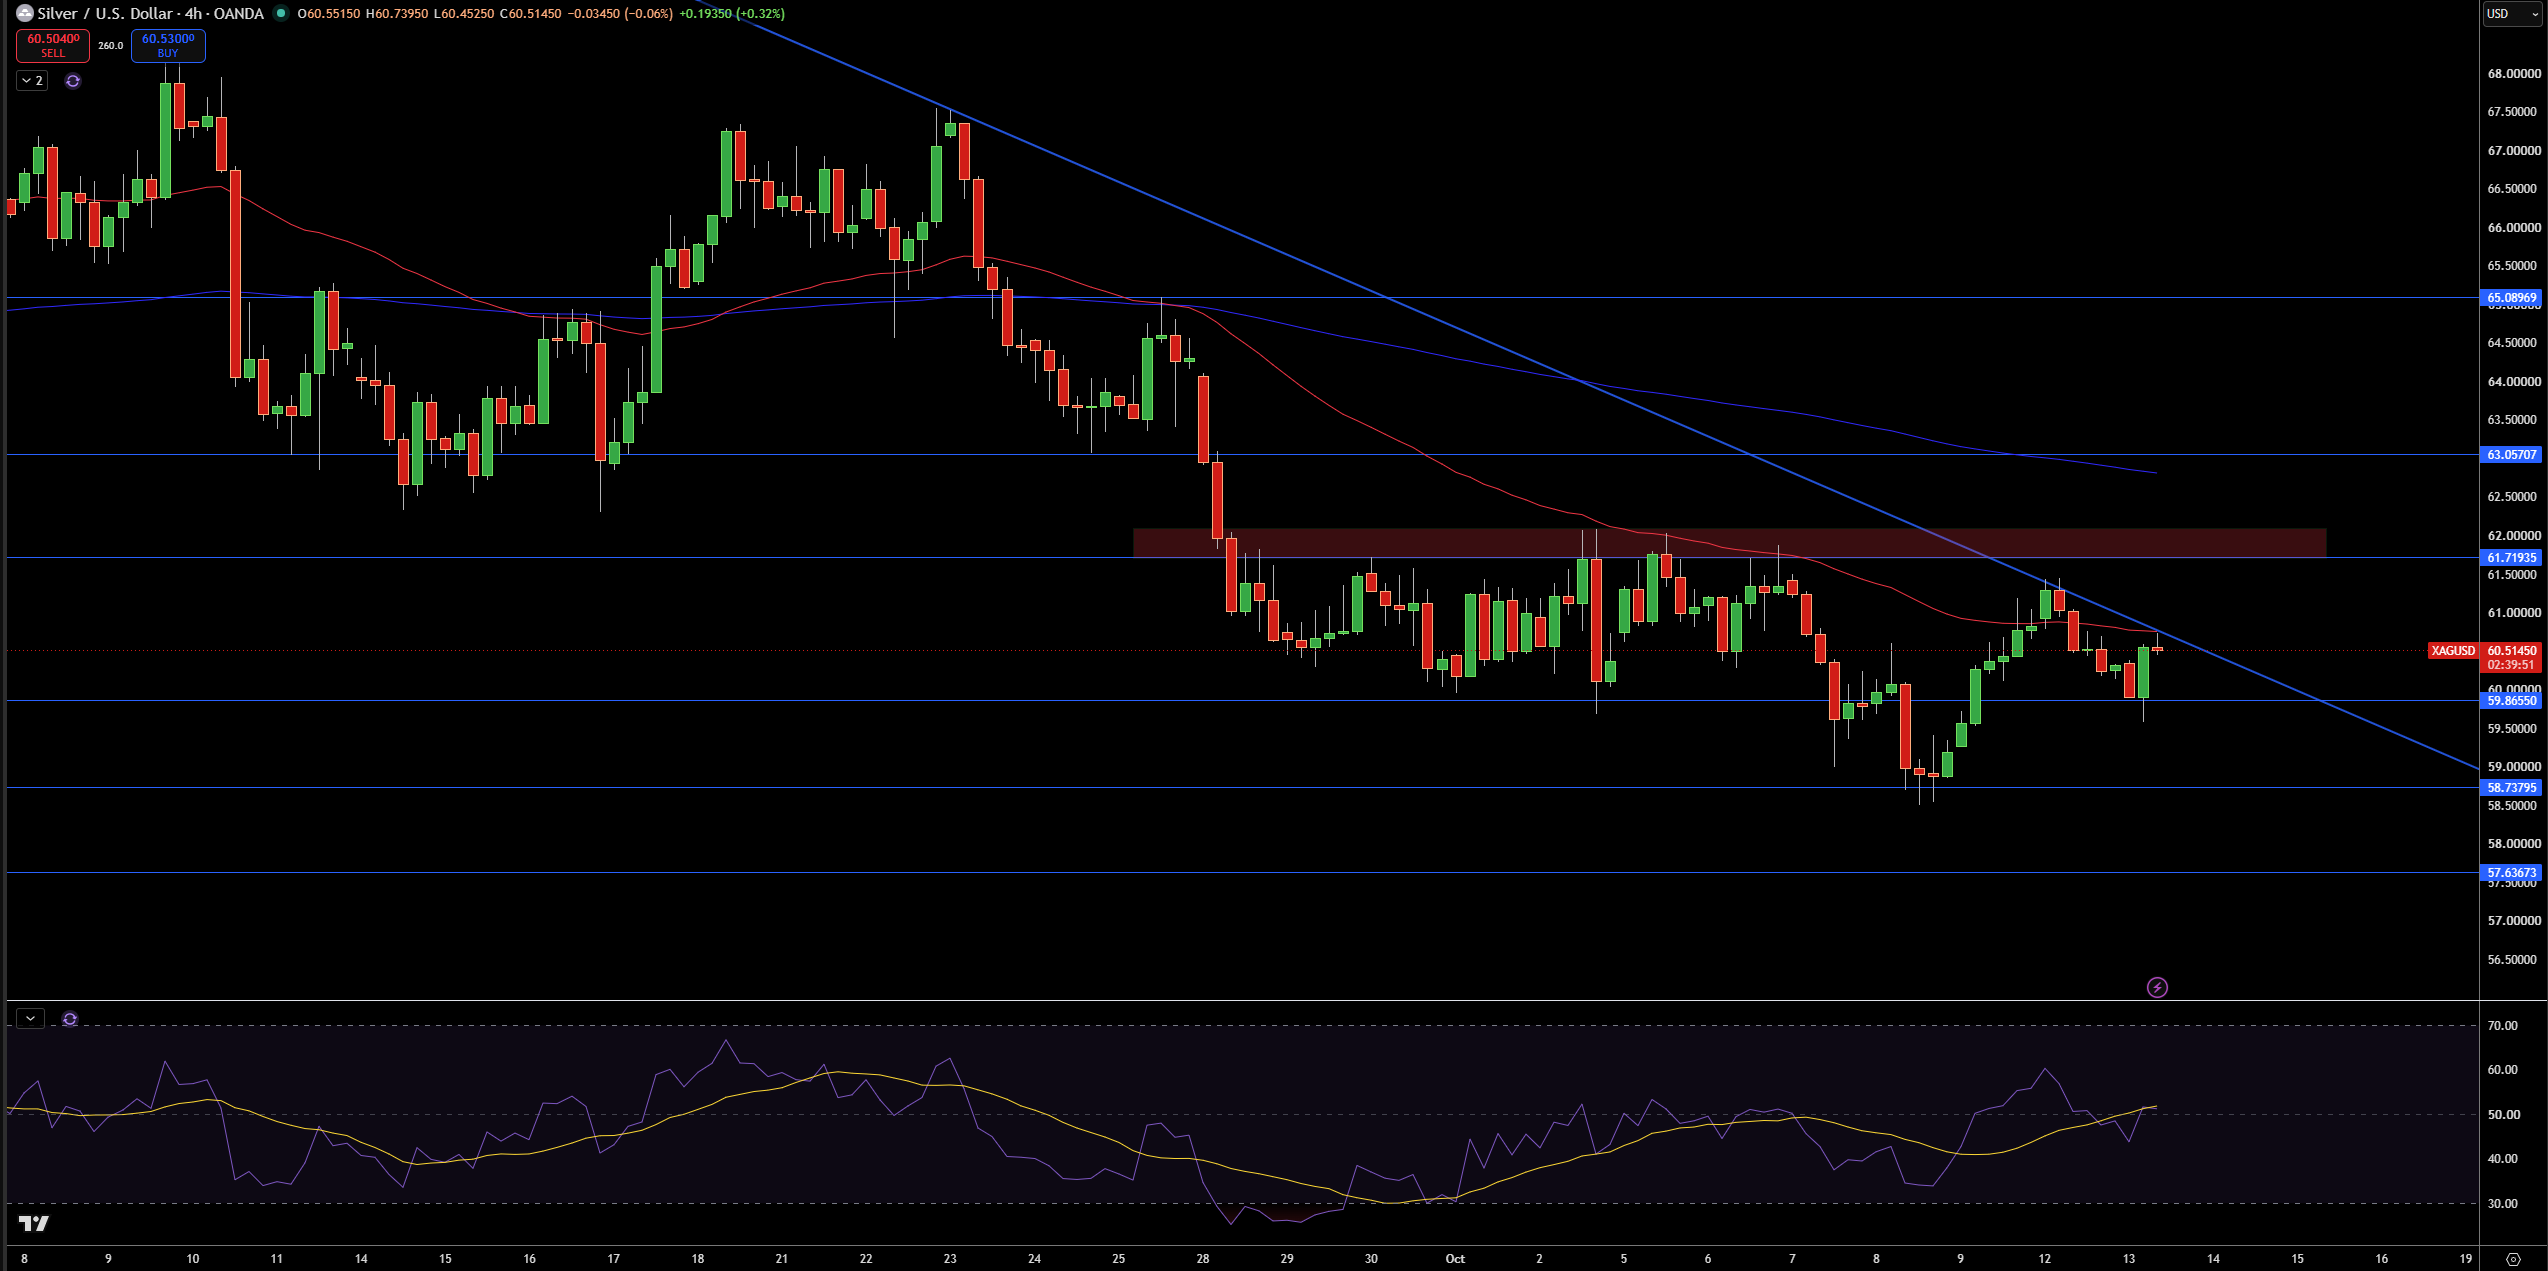
Silver is currently at $60.51 on the 4-hour chart, rebounding from $58.74. Price is currently testing the descending trendline, and is also below both the 100 and 200 SMAs. With the overall trend still down, I will watch price action above the $59.97 support area.
I will watch the $61.72 resistance for a potential second level of resistance, with $63.06 and $65.09 also possible if price action continues to the upside. If price does break down and test the $59.97 level, I would watch the $58.74 level and $57.64 level as possible supports.
RSI is currently sitting at the 50 line, which signals that price may consolidate at the current levels. I believe price may continue to consolidate between the $59.97 and $61.72 levels, with a slight bias toward the downside. A clean break above $61.72 would improve the outlook, while a break below $59.97 would put focus on $58.74.