


Key Moving-Average Support Keeps Bullish Potential Alive
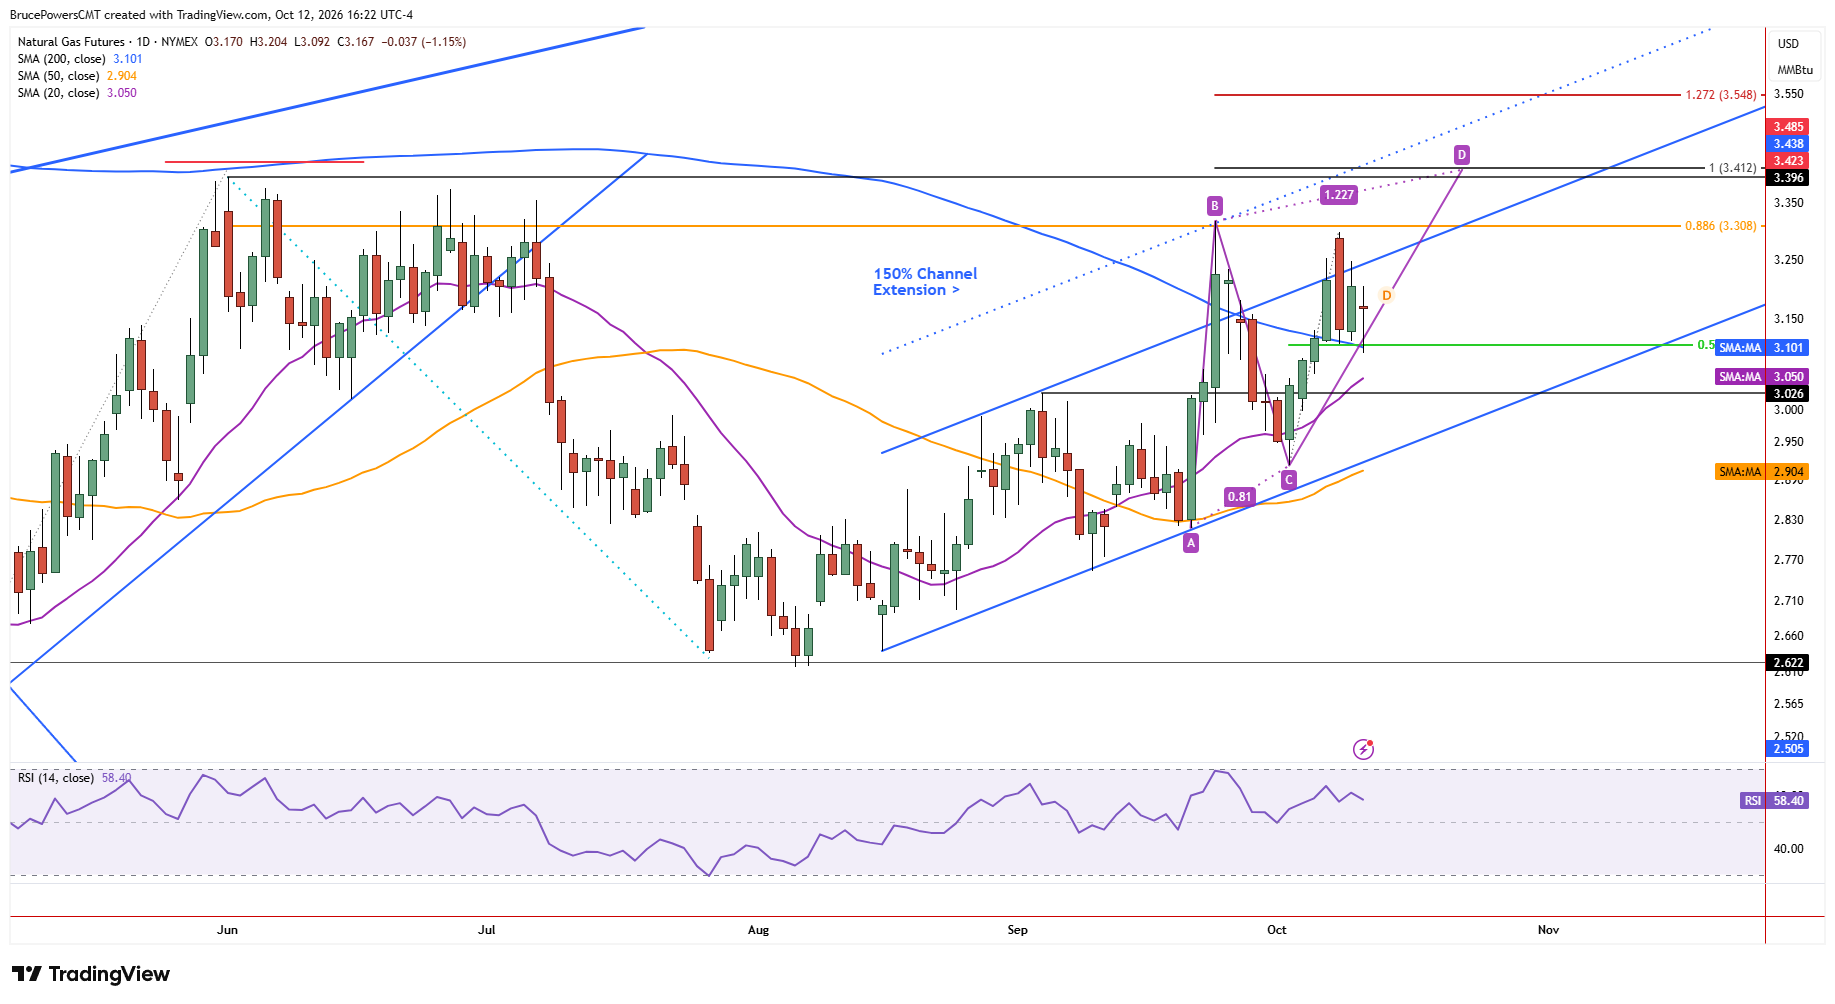
Natural gas held support near the 200-day moving average for the fourth consecutive day on Monday, suggesting that underlying strength remains intact despite continued consolidation. However, a four-day low of $3.092 was established, along with a lower daily high of $3.204. That low, along with the 200-day moving average near $3.10, defines a near-term support zone, which is reinforced by the 50% retracement of the prior advance at $3.105.

Break Above $3.204 Could Renew Upside Momentum
If natural gas remains above the 200-day moving average, it retains the potential for further strengthening. Given Monday’s lower daily high and lower low, a decisive breakout above Monday’s high of $3.204 could signal that the short-term advance is resuming, with the potential to test resistance near the recent high of $3.298. If that level is broken, higher targets become possible. Otherwise, further testing of support is likely.
Rising 20-Day Average Offers a Potential Timing Signal
Consequently, the rising 20-day moving average near $3.05 could play an important role in defining near-term dynamic support, having been tested two weeks ago. It could also serve as a timing indicator. As the moving average rises toward price, currently near Monday’s low of $3.092, momentum could return to natural gas. Moreover, if that shorter-term moving average crosses above the longer-term 200-day average, it will signal improving short-term momentum.
Weekly Structure Points Toward Higher Resistance
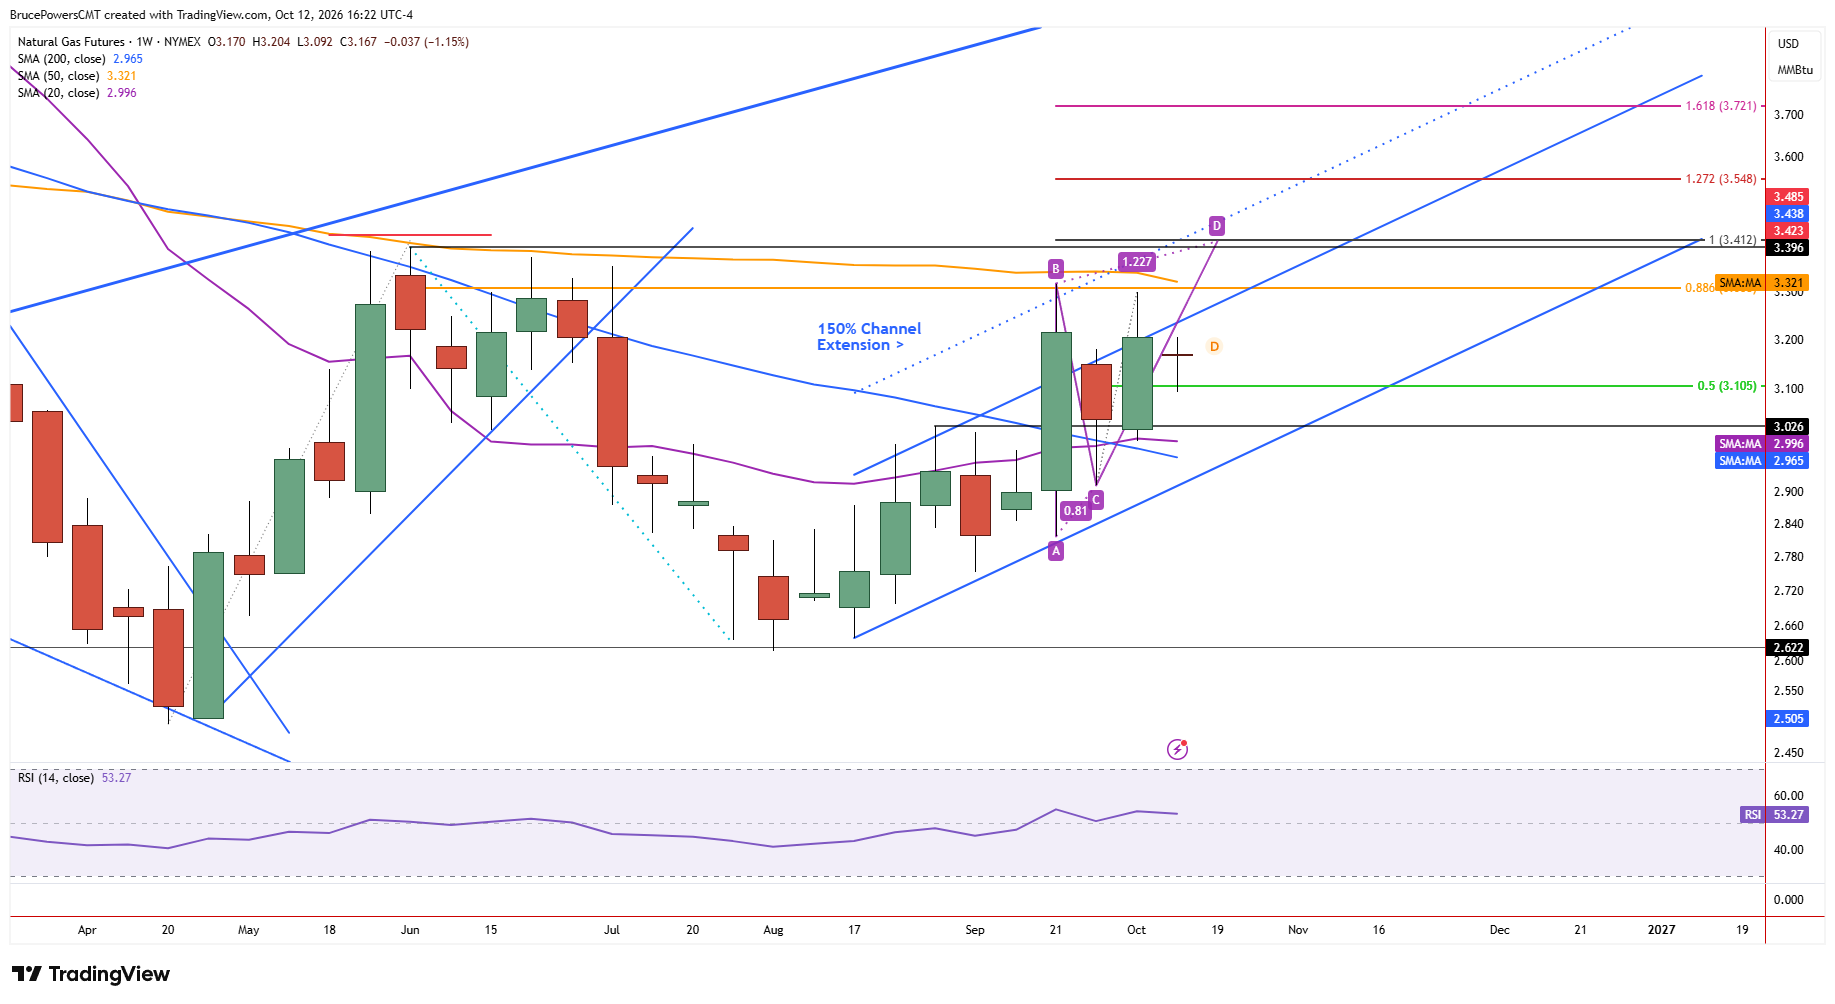
The weekly chart also supports the potential for an eventual resolution to the upside above $3.298. Last week, a bullish continuation signal was confirmed by a weekly close above the prior week’s high of $3.18. This resulted in a higher weekly low and higher high, suggesting that the weekly bullish trend was continuing after a higher swing low formed at $2.817 (A) last month.
If the bullish advance resumes after the current short-term consolidation, the September high of $3.317 and June high of $3.396 define a range of potential resistance. In addition, a measured move points to $3.41 as a potential upside target. Because this target is relatively close to the July high of $3.396, the two levels form a potential resistance zone between $3.396 and $3.41. A test of that zone could therefore mark the next significant challenge for buyers if natural gas breaks above the nearer resistance levels. For now, the ability to hold support near $3.10 and break above $3.204 remains important to the bullish outlook.
Natural Gas Price Forecast
Every new Natural Gas analysis as it publishes, today's technical signal and key levels, live price — on one page.
See all Natural Gas forecastsIf you’d like to know more about how to trade natural gas, please visit our educational area.


