Monthly Bullish Reversal
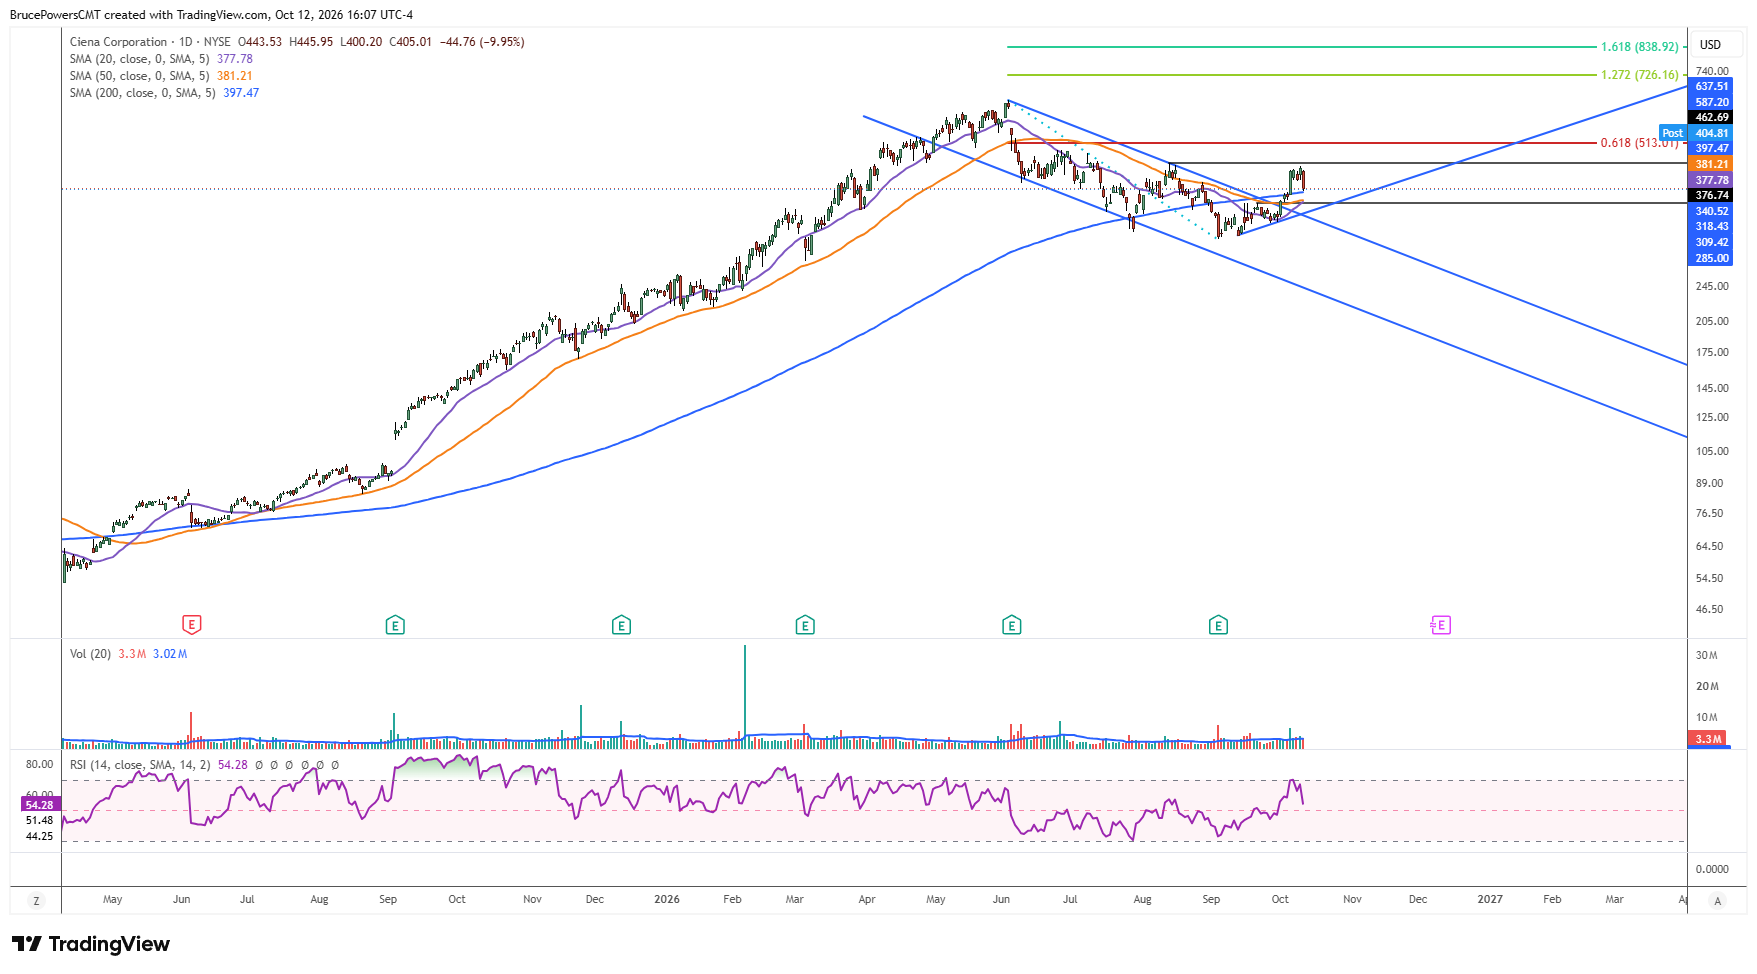
Shares of Ciena Corporation (CIEN), a network technology company benefiting from AI infrastructure demand, recently triggered a monthly bullish reversal signal after rallying above September’s high of $381.50. The advance also reclaimed the 200-day moving average, resulting in a high of $454.73 on Friday, followed by a bearish reversal signal on Monday with a decline below the three-day low of $421.11. However, Monday’s pullback to test prior resistance as support is healthy for the advance and provides traders another opportunity to consider the stock at lower levels.

Support Levels to Watch
The initial expectation is for support to be seen at the 200-day moving average and followed by signs of strength. That average is now near $397.50, and it can be reinforced by the daily low of $392 from last Tuesday. However, if that level fails to hold and leads to strength, the next lower support zone is from around $376.74 to last month’s high of $381.50. The 50-day moving average near $381.20 can be included within the support zone as well. Also, the rising 20-day moving average near $377.69 will soon cross above the 50-day moving average, providing a sign for improving momentum.
Upside Targets
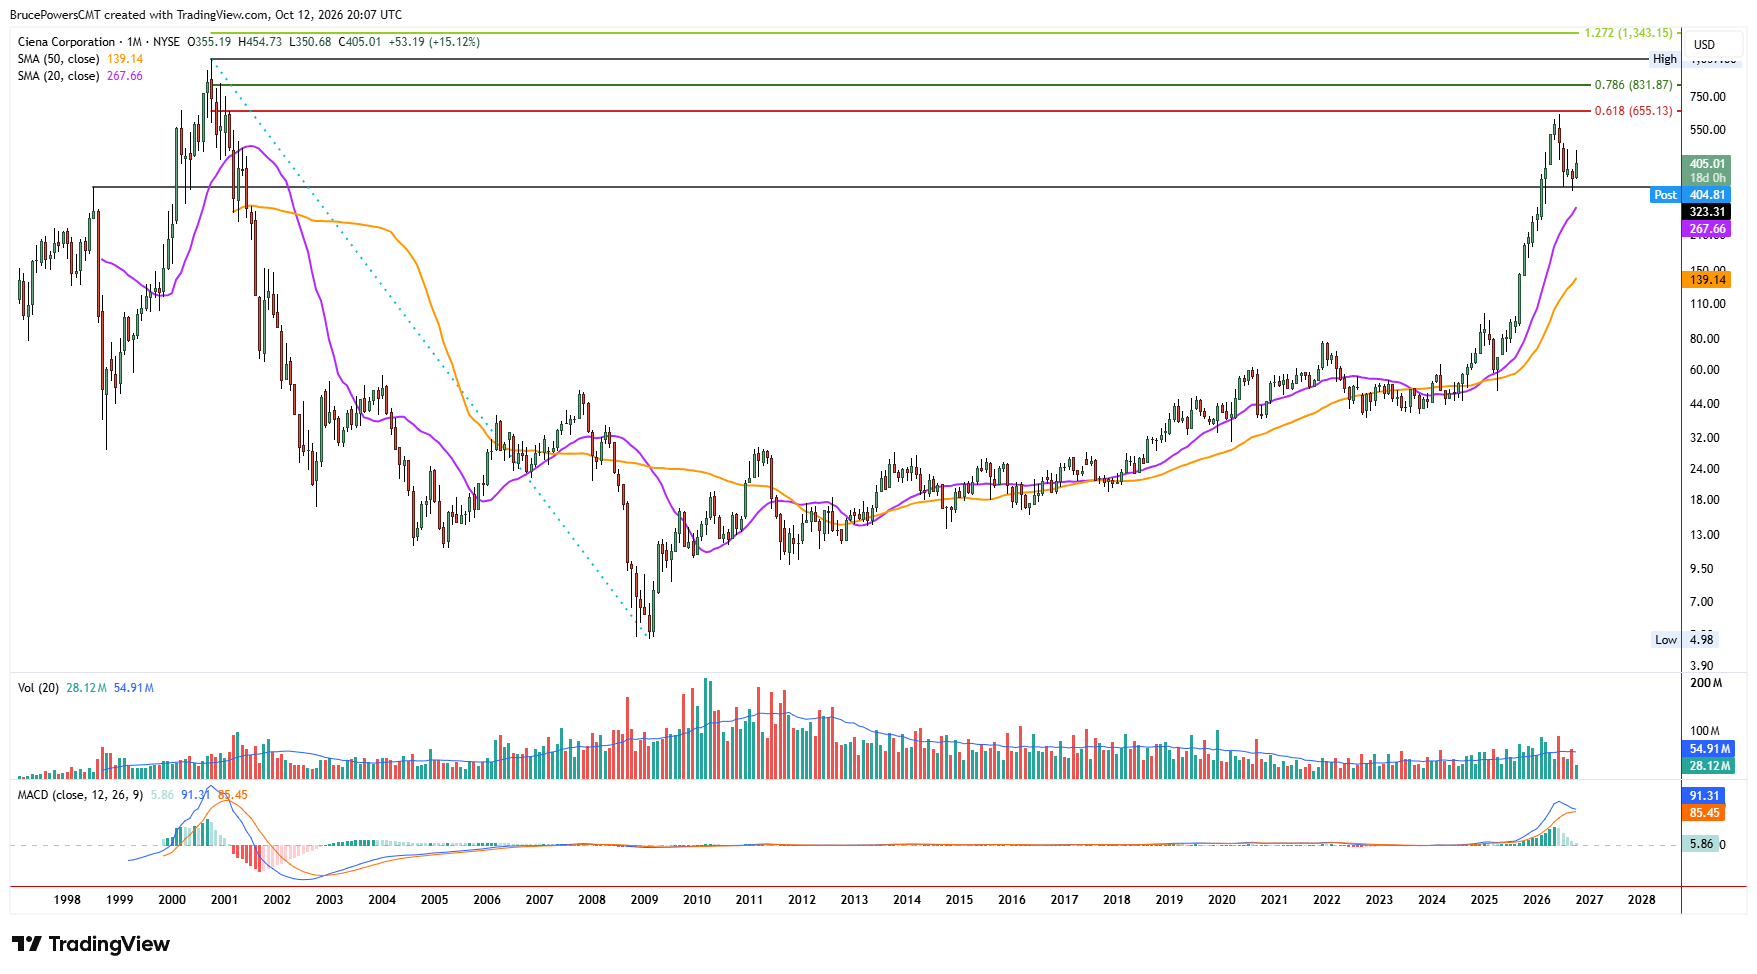
During the recent advance, resistance was seen below the lower swing high of $462.69, which keeps that level as an initial upside target if the $454.73 high is exceeded. Subsequently, an extension of the current advance above $462.69 will signal a bullish reversal of the prior decline and add to the bullish evidence for an eventual continuation to the upside. If the $462.69 level is successfully exceeded and buyers can retain control, the peak of $637.51 becomes a potential upside target, along with higher levels.
Pullback Before Continuation
First, the first pullback after a significant upside breakout needs to complete. Once that occurs, the developing uptrend should be ready to continue higher. Since a monthly breakout has triggered, this month’s higher low of $350.68 is key structural support. As long as that level holds, the current pullback should be viewed as a constructive pause within the broader advance – not a reversal of it.
If you’d like to know more about technical analysis and how traders use it, please visit our educational area.