Support Zone Keeps Reversal Potential Alive
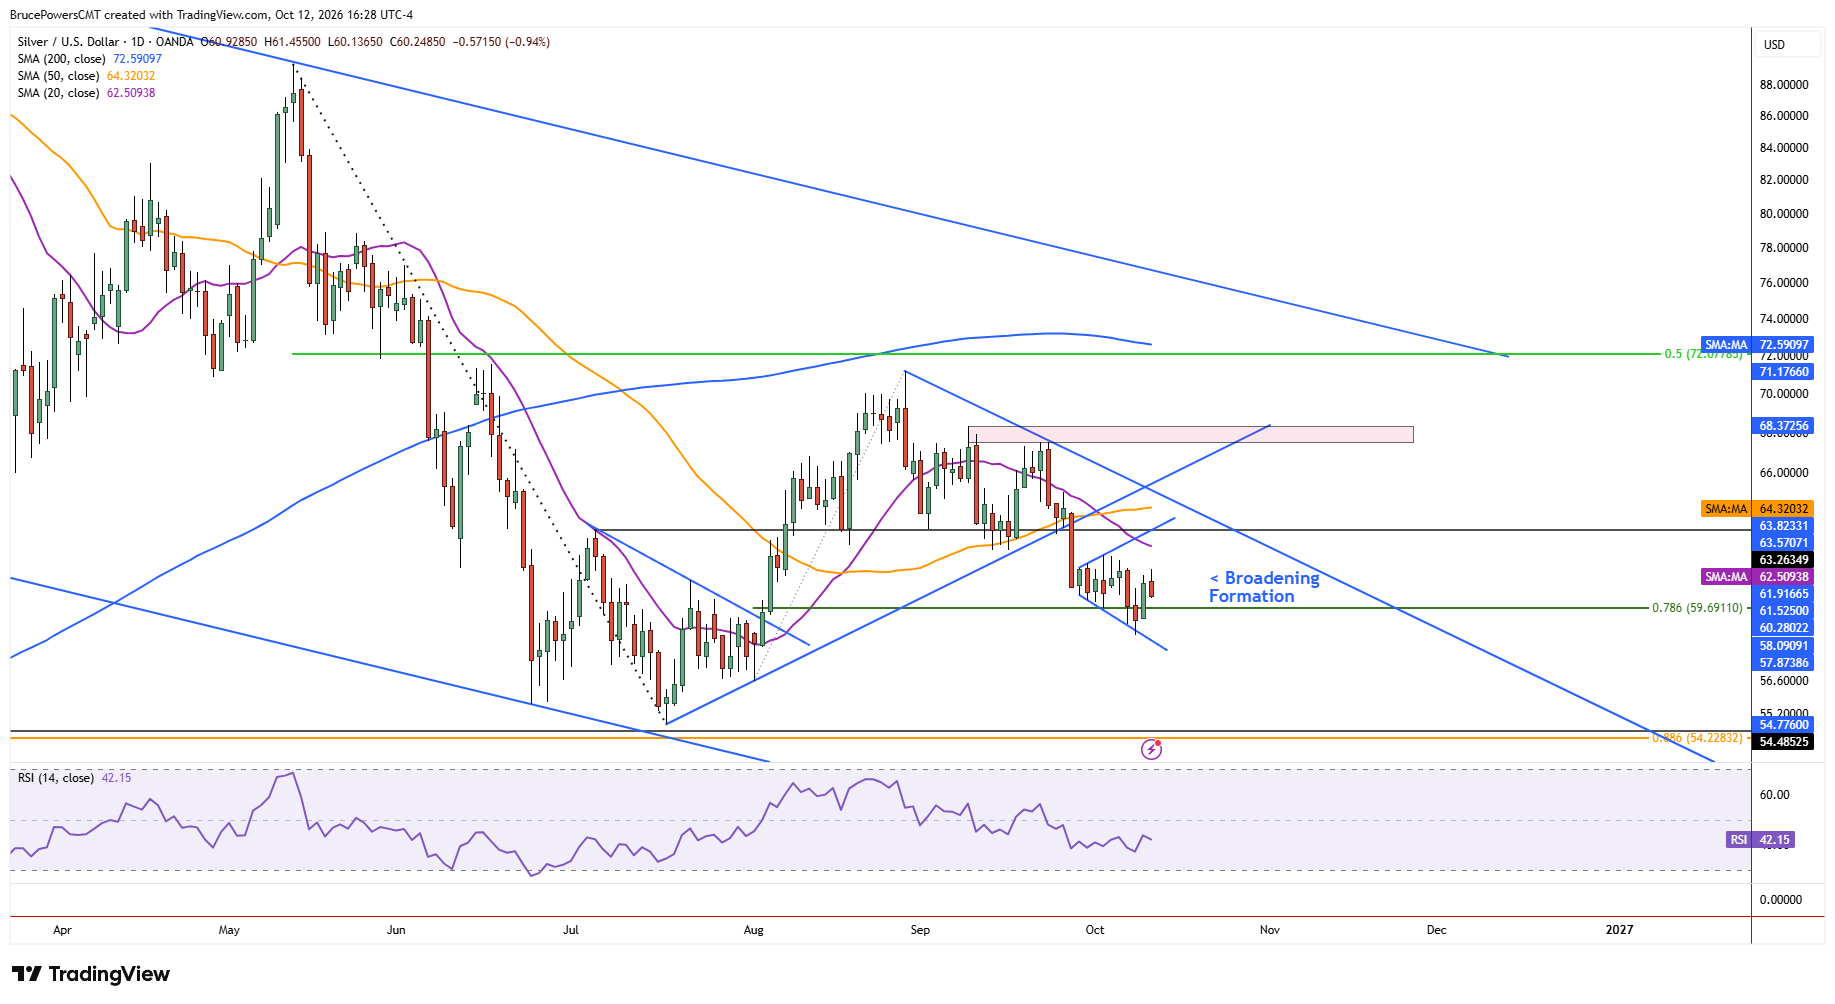
Silver remained in a bearish trend on Monday, although it continued to hold a key support zone that has been tested for approximately 10 days. The 78.6% Fibonacci retracement of the prior advance at $59.69, together with the retracement low of $58.50 from last week, currently defines the zone. If support continues to hold, the possibility of an eventual bullish reversal remains. However, the dominant trend is bearish, so initial rallies are likely to encounter overhead selling pressure.

Broadening Formation Complicates Short-Term Signals
Adding to the short-term technical uncertainty, a small broadening formation has developed near the support zone. The consolidation range expanded last Thursday and Friday, as two additional retracement lows formed, further defining the pattern’s lower boundary. This resulted in false bearish trend-extension signals, followed by a one-day bullish reversal signal on Friday when silver rallied above Thursday’s high.
Upper Boundary Offers a Potential Recovery Target
On Monday, the rebound extended to a three-day high of $61.45 before sellers took back control intraday. A higher daily low of $60.17 also established a potential near-term support level. This is where the broadening formation may offer useful guidance. If the pattern continues to evolve, a test of resistance near its upper boundary becomes possible following a reversal from the lower boundary.
Be aware that the boundary lines of the formation provide only a rough estimate of potential resistance because price movements within the pattern can be irregular. Given the current rising upper boundary, silver could test that boundary near the falling trendline that has defined dynamic resistance during the decline of more than two months. The 50-day moving average near $64.32 can be used as a rough proxy for that trendline.
Weekly Breakout Above $62.04 Would Strengthen Reversal Case
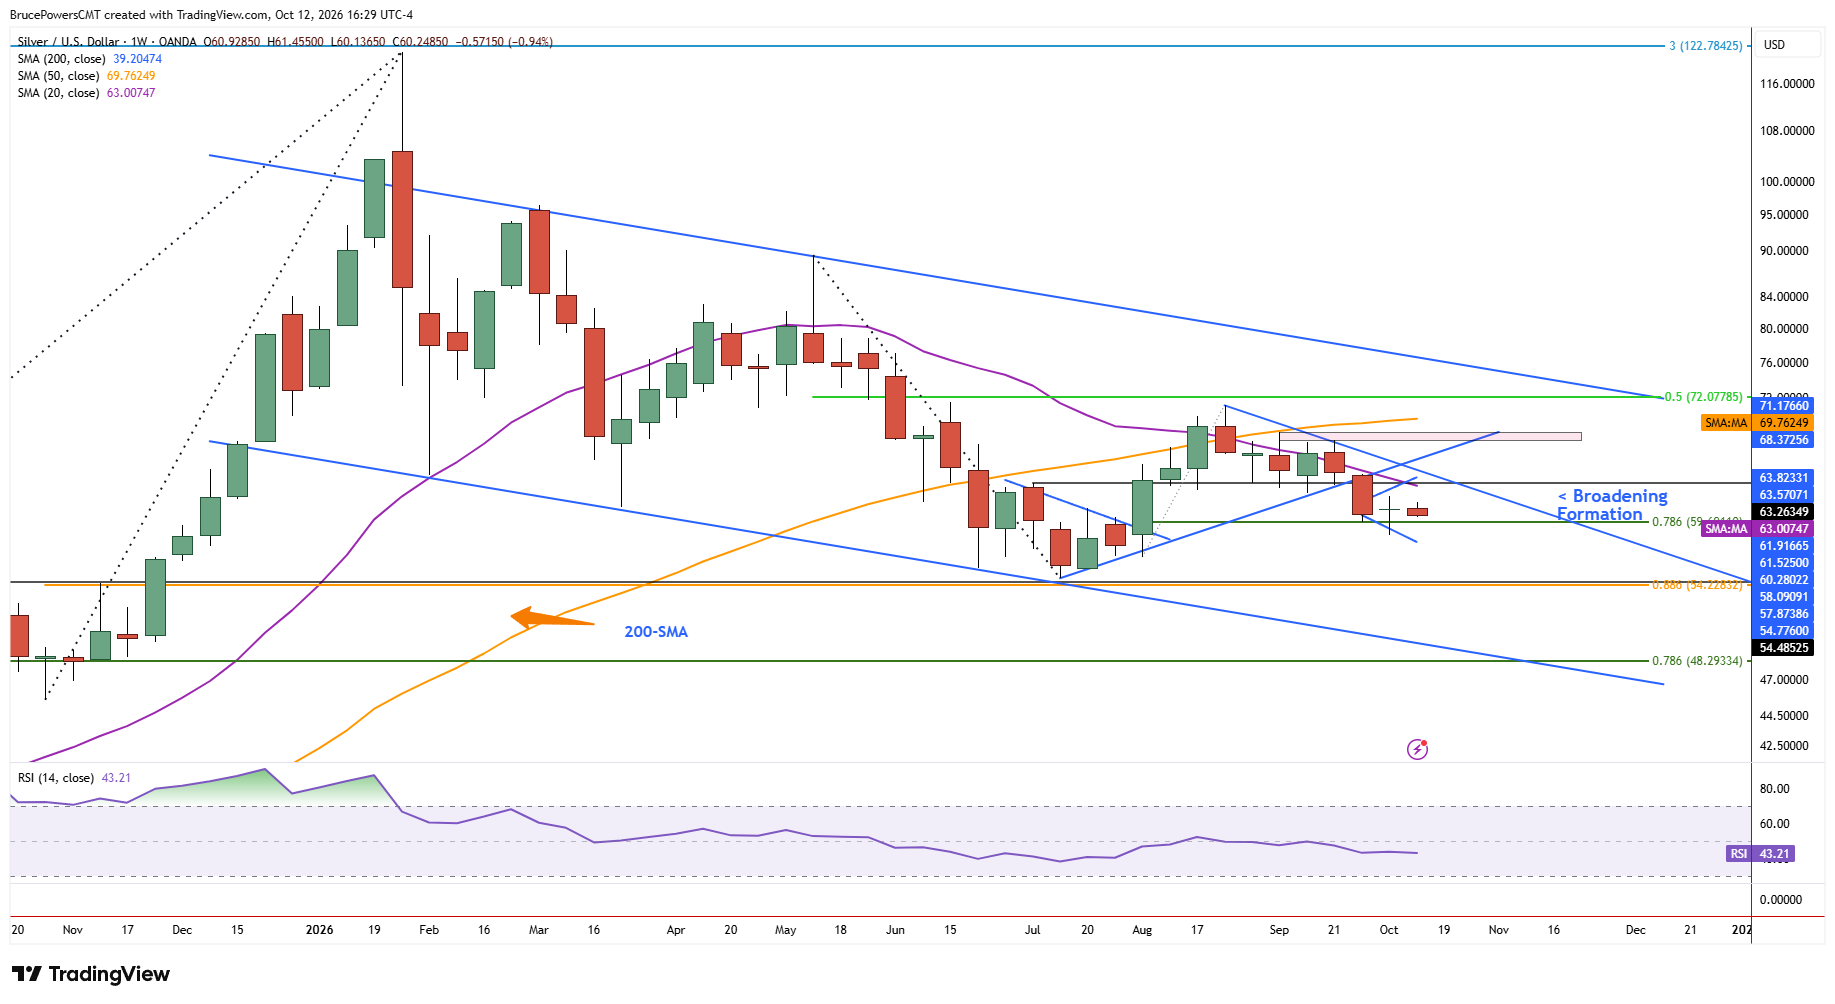
The weekly chart offers another perspective on the potential for a reversal. Last week, a doji hammer candlestick pattern formed, with a bullish reversal signal requiring an upside breakout above $62.04. That would signal a bullish reversal on the larger weekly timeframe.
Silver Price Forecast
Every new Silver analysis as it publishes, today's technical signal and key levels, live price — on one page.
See all Silver forecastsIf the breakout is sustained, the lower weekly high at $64.11 marks the first upside target zone and a potential test of overhead resistance. Until that breakout occurs, however, the bearish trend remains dominant, and the support zone between $58.50 and $59.69 remains critical. Holding that zone would preserve the possibility of a reversal, while a decisive breakdown would weaken the bullish case.