Storm Short-Covering Fades as Warm Weather Caps the Rally
November natural gas futures are back under pressure after Hurricane Isaias gave shorts a reason to cover going into the weekend. Gulf output is already coming back online. The weather models are not helping. The market is sitting right on top of the retracement zone that has been defining the range. The minor trend is down and the storm did not change that.
At 06:55 GMT, November natural gas futures were trading at $3.171, down $0.033 or 1.03%.

Weekly November Natural Gas Futures Technical Analysis
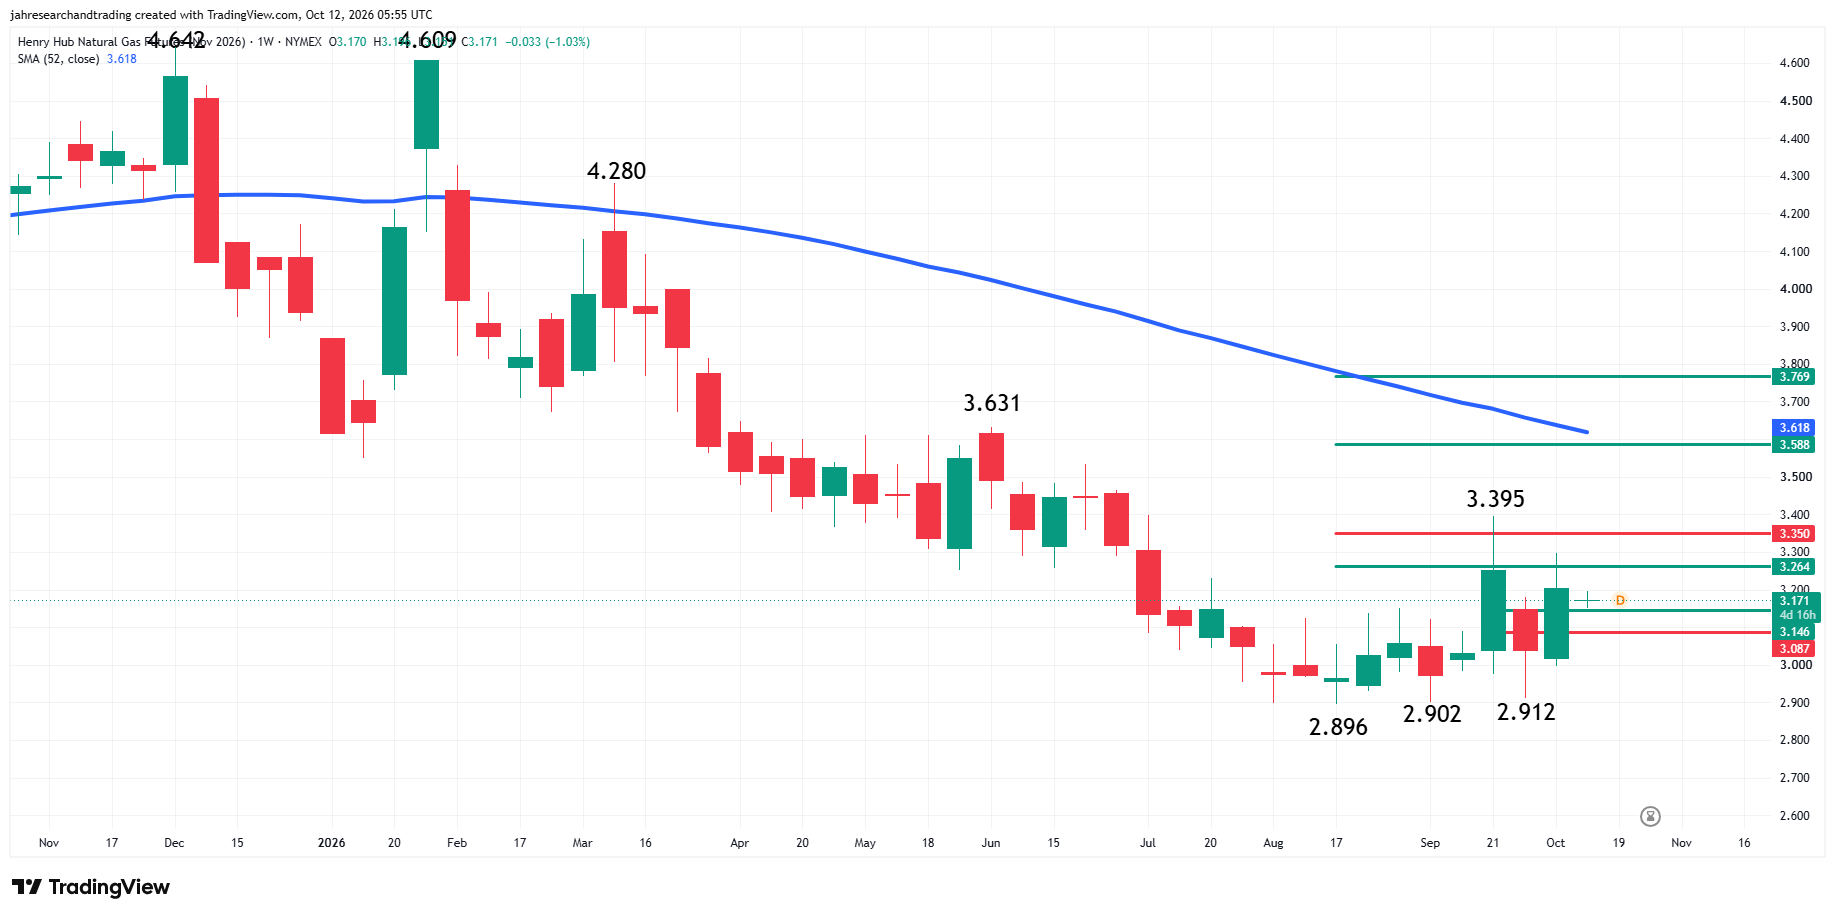
November natural gas futures are trading lower at the start of the week. The main trend is up according to the weekly swing chart, but the minor trend is down. This is helping to create volatility and two-sided trading.
A trade through $3.395 will signal a resumption of the main uptrend. A move through $2.896 will change the main trend to down.
The minor trend will change to up on a move through $3.395. A trade through $2.912 will signal a resumption of the minor downtrend.
The key area to watch this week is the retracement zone at $3.146 to $3.087. Last week, the market straddled this area before moving higher. Early Monday, November natural gas is trading on the strong side of this zone.
A sustained move over $3.146 will signal the presence of buyers. If this creates enough upside momentum, we could see a test of another retracement zone at $3.264 to $3.350. The latter is a potential trigger point for an acceleration to the upside with a 50% level at $3.588, the 52-week moving average at $3.618 and a 50% level at $3.769 possible targets.
A sustained move under $3.087 will indicate the presence of sellers. This could create the downside momentum to challenge the three bottoms at $2.912, $2.902 and $2.896.
Trader reaction to $3.146 to $3.087 is likely to set the tone this week. The mixed trends on the main and minor swing charts, however, are not providing a clear direction. The position of the retracement zone at $3.264 to $3.350 indicates any rally will be labored and possibly limited by the 52-week moving average. Sellers could also face challenges at the three bottoms.
Natural Gas Price Forecast
Every new Natural Gas analysis as it publishes, today's technical signal and key levels, live price — on one page.
See all Natural Gas forecastsThe Storm Cleared Shorts, Not the Supply Problem
Gulf producers shut in 59% of output Friday and Lower-48 production dropped to 109.3 Bcf per day, the lowest since January. November natural gas settled at $3.220, up $0.052 or 1.64%. That was shorts stepping aside after Thursday’s storage report knocked the market off its highs. The restart timeline is what matters now. Production was already coming back over the weekend.
The weather models are not giving buyers anything to work with. High pressure has kept most of the country in the 60s, 70s and 80s with 90s and 100-degree readings still possible in California and the Southwest. The Great Lakes and Northeast have seen some early heating demand but that is regional. NatGasWeather sees low demand near term and only moderate demand later in the forecast. Commodity Weather Group has called for above-average temperatures through mid-October. The Lower 48 is stuck in shoulder season and the storm did not change that.
Storage and Production Still Favor the Sellers
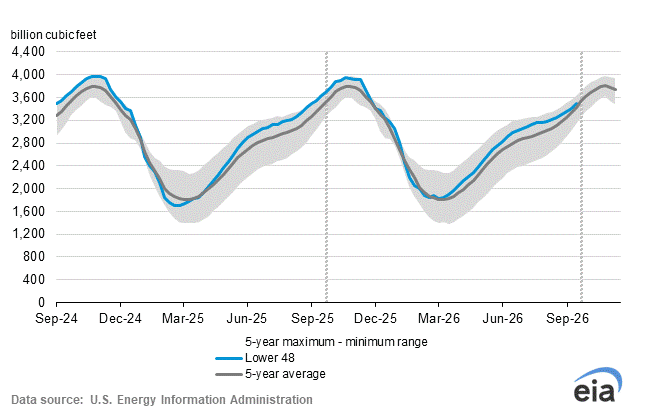
Last week’s injection came in lighter than the five-year average. That made shorts more careful heading into the storm. It did not change where inventories sit. Storage is still above the seasonal norm, and the EIA sees it finishing October at the highest level in a decade. Then the agency raised its production forecast for next year. That is not a number buyers can work with.
Baker Hughes had rigs down one last week. Nobody flinched. LNG exports were firm Friday. Good number. Not good enough. Exports are absorbing gas. They are not absorbing enough of it.
What to Watch
Gulf production is coming back online after Isaias and the warm forecast through mid-October keeps national demand in shoulder-season range. Storage above the five-year average with end-of-October projections at 3,985 Bcf gives sellers the bigger number. The short-covering rally did not produce a new buyer. It produced a pause.
November natural gas is trading on the strong side of the retracement zone early Monday, and the reaction at that level sets the tone for the week. The mixed trends on the main and minor swing charts mean the range could hold in either direction. The resistance above is labored with the 52-week moving average waiting at $3.618. The three bottoms below are still down there if sellers take control back. The storm gave the market a breath. The supply picture took it right back.
More Information in our Economic Calendar.