Gold (XAU) trades near $4,210 an ounce in early Asian trading on Monday, while silver (XAG) increased to $61. The market now waits for the US CPI report for September on October 14. The market expects nearly 85% chance of a rate hike by the Fed by December. This leaves both metals sensitive to the fresh inflation data.
The US dollar also remained near an 18-month high and added pressure to the recovery in gold and silver prices. A hot CPI reading could strengthen the expectations for a rate hike and push the dollar and Treasury yields higher. But the soft data could ease those pressures and give both metals more room to recover.
The developments in energy markets also shape the outlook for precious metals. President Trump announced a Russia-Ukraine energy ceasefire, which helped Brent oil drop to $105.45 a barrel on Monday.
However, Ukraine was still waiting for details and Russia had not confirmed the agreement. The fresh tanker attacks near Oman and in the Strait of Hormuz also kept the risk of supply in focus.
In my view, these tensions could support gold as investors seek safety. But another increase in oil prices could keep inflation elevated and reinforce the case for further tightening by the Fed. This creates competing pressures for precious metals. A sustained decline in energy prices and the softer US inflation would provide strong support for gold and silver.

Gold Price Forecast: $4,250 Breakout Could Target $4,330
The daily chart for spot gold shows that the price has been trading within the triangle pattern since 2025. The rebound in the gold market last week was supported by this triangle pattern. The price is now moving towards the initial resistance at $4,225.
A break above $4,225 will likely push the gold price towards the 50-day SMA in the $4,330 area. The key resistance in the gold market remains at the resistance of the triangle at $4,530. A break above $4,530 will likely push the gold price towards the $5,000 area.
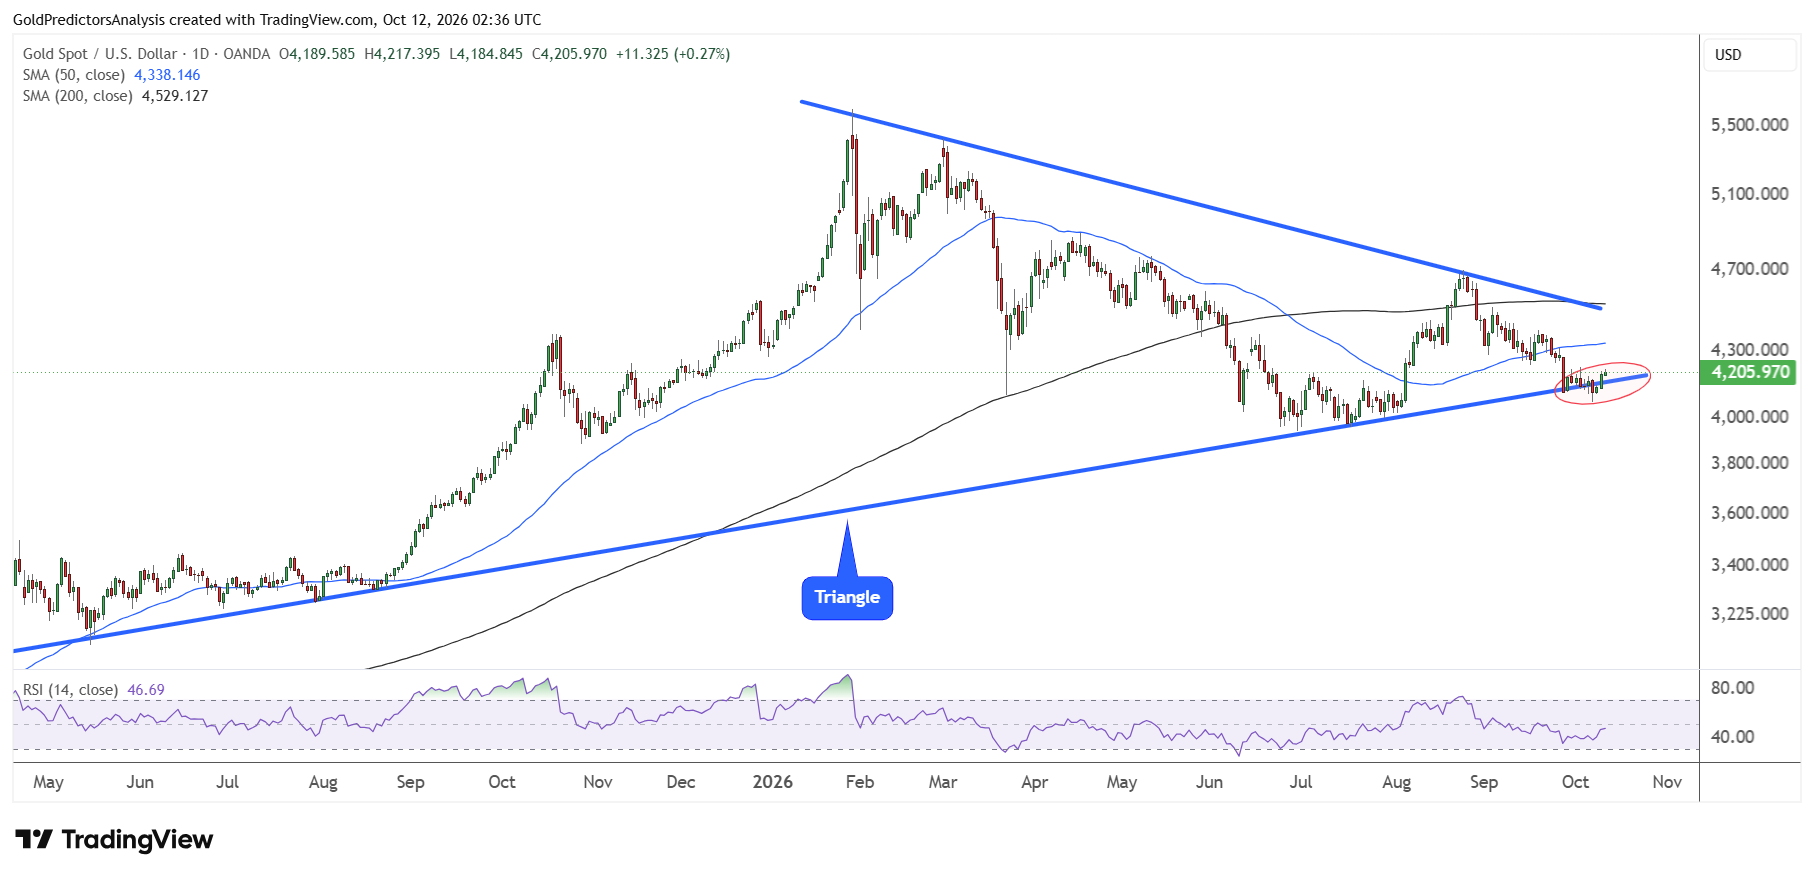
The current range in the gold market remains between $4,000 and $4,530. The market is looking for a confirmed breakout from these levels to define the next move.
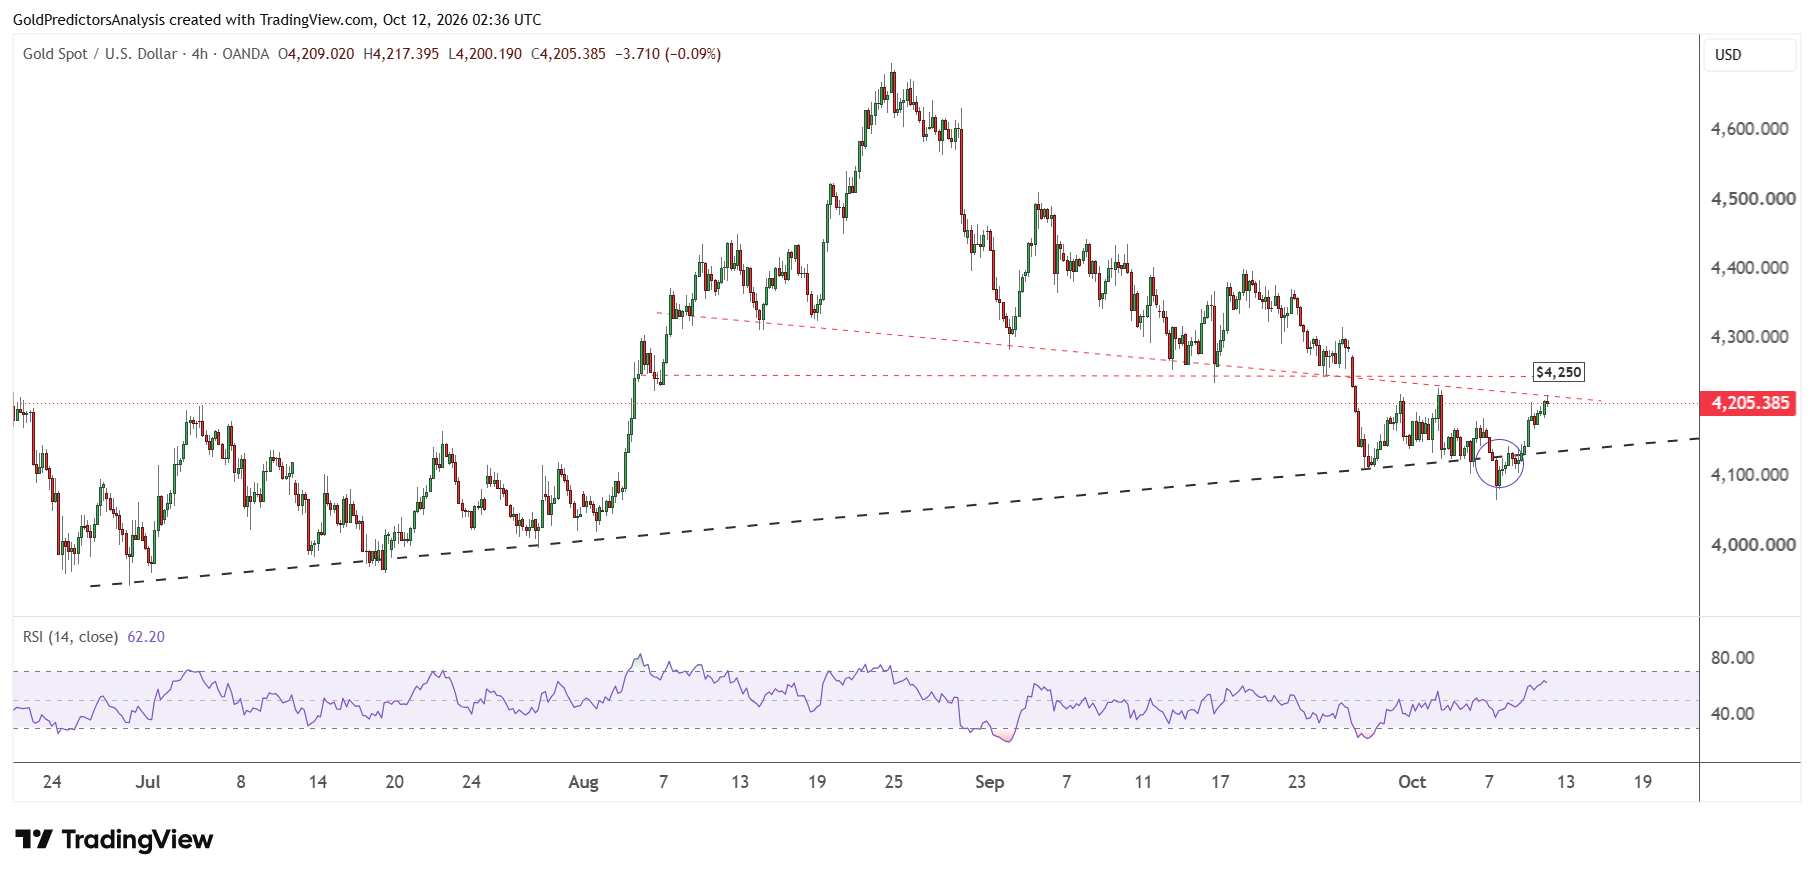
The 4-hour chart for the gold price shows that the rebound in gold developed from the ascending trend line that stretches from the June 2026 lows. The price has hit the first resistance in the $4,215 area. The next important resistance is $4,250.
A confirmed break above $4,250 will likely open the way for a rally towards the 50-day SMA in the $4,330 region. On the other hand, a break below $4,100 will likely push the gold price towards the $4,000 area.
Gold Price Forecast
Every new Gold analysis as it publishes, today's technical signal and key levels, live price — on one page.
See all Gold forecastsSilver Price Forecast: $65 Breakout Could Target $72
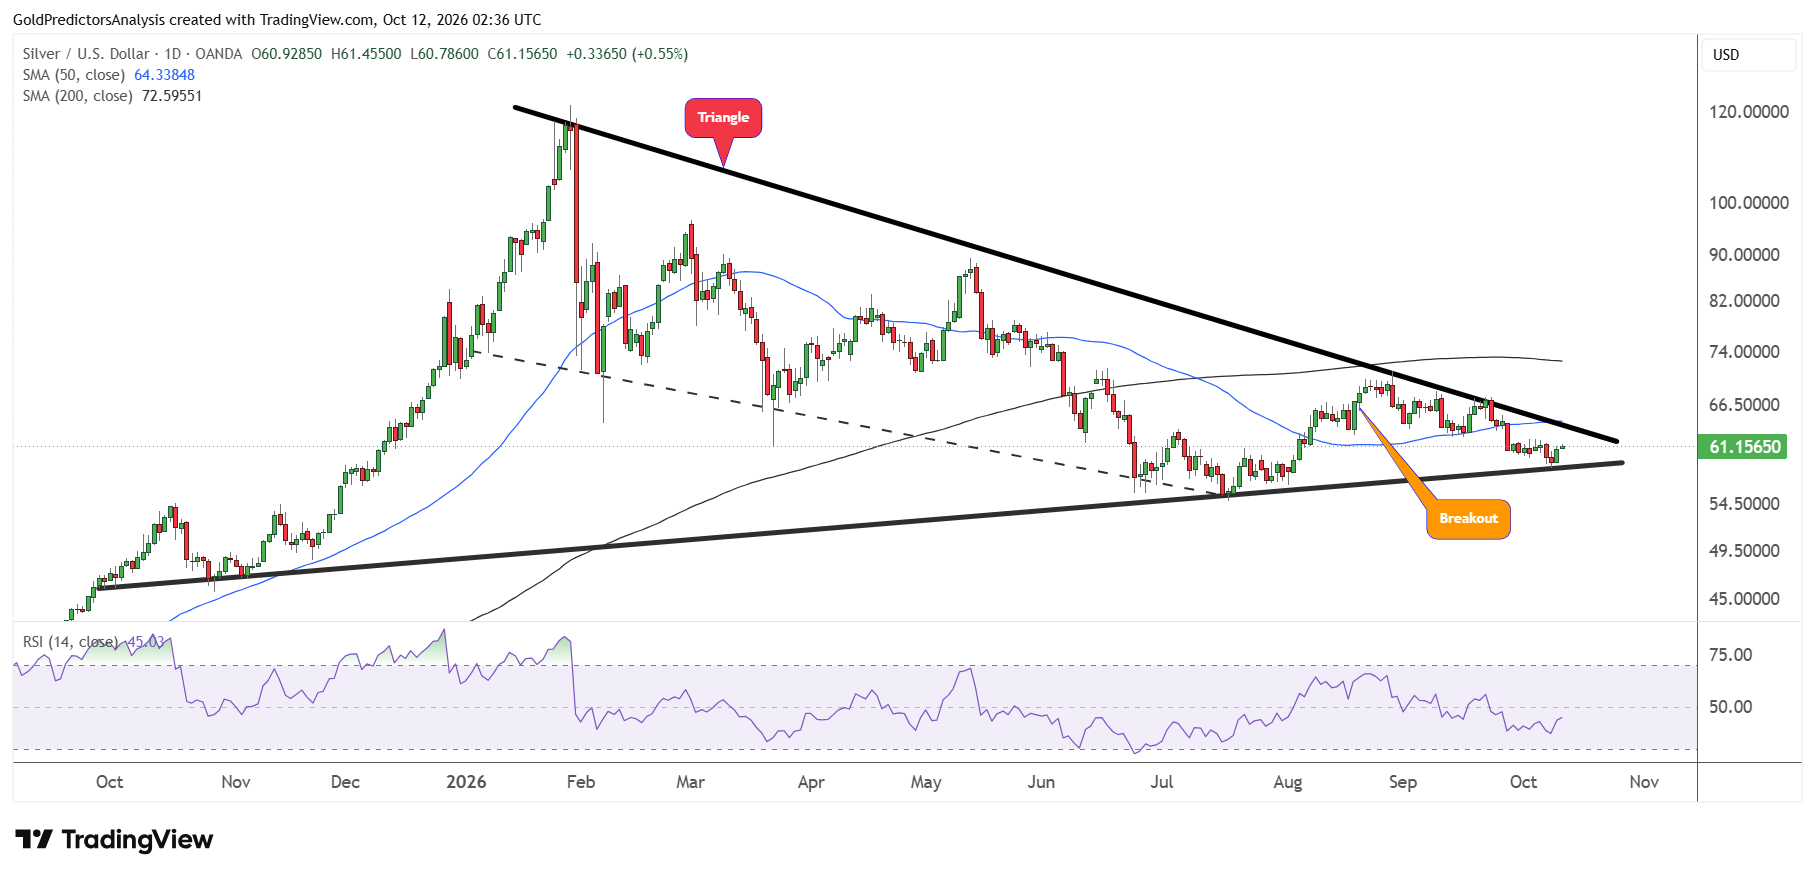
The daily chart for spot silver shows that the price has been trading within the triangle pattern. The latest rebound in the silver market developed from the support of the triangle. The price is now moving towards the 50-day SMA in the $64 area.
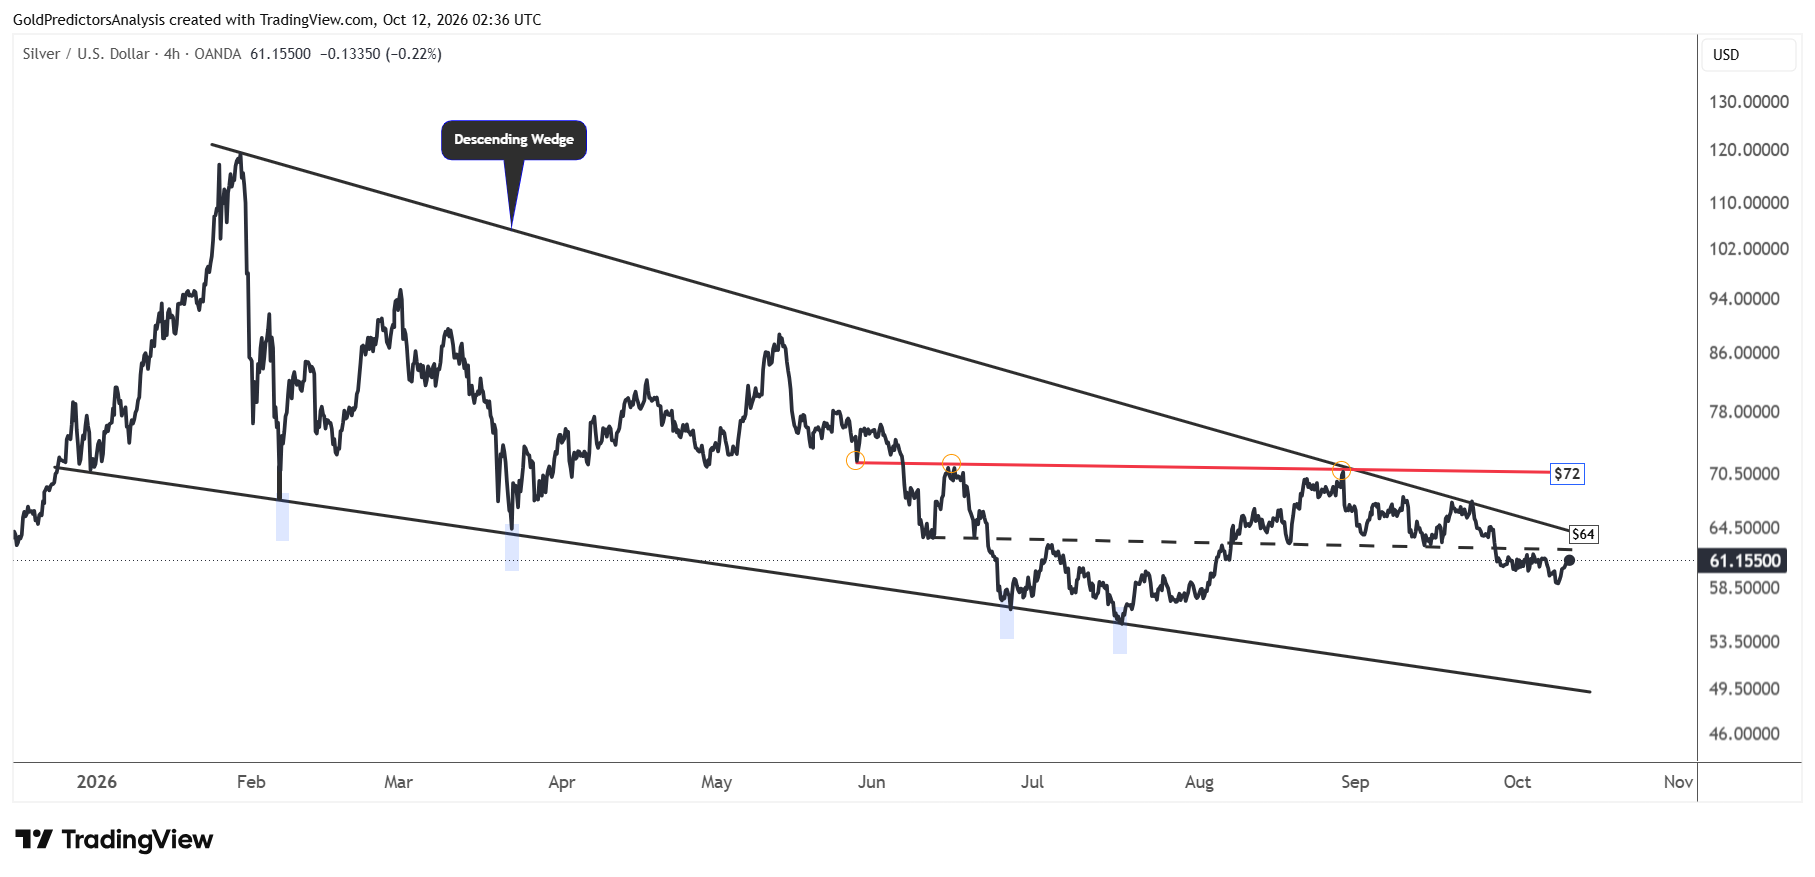
A break above the $64-$65 resistance zone will likely push the silver price towards the $72 area. The $72 resistance is now at the 200-day SMA. A break above $72 will likely indicate a strong rally towards the $90 area.
The 4-hour chart for spot silver also shows significant resistance in the $64 region.
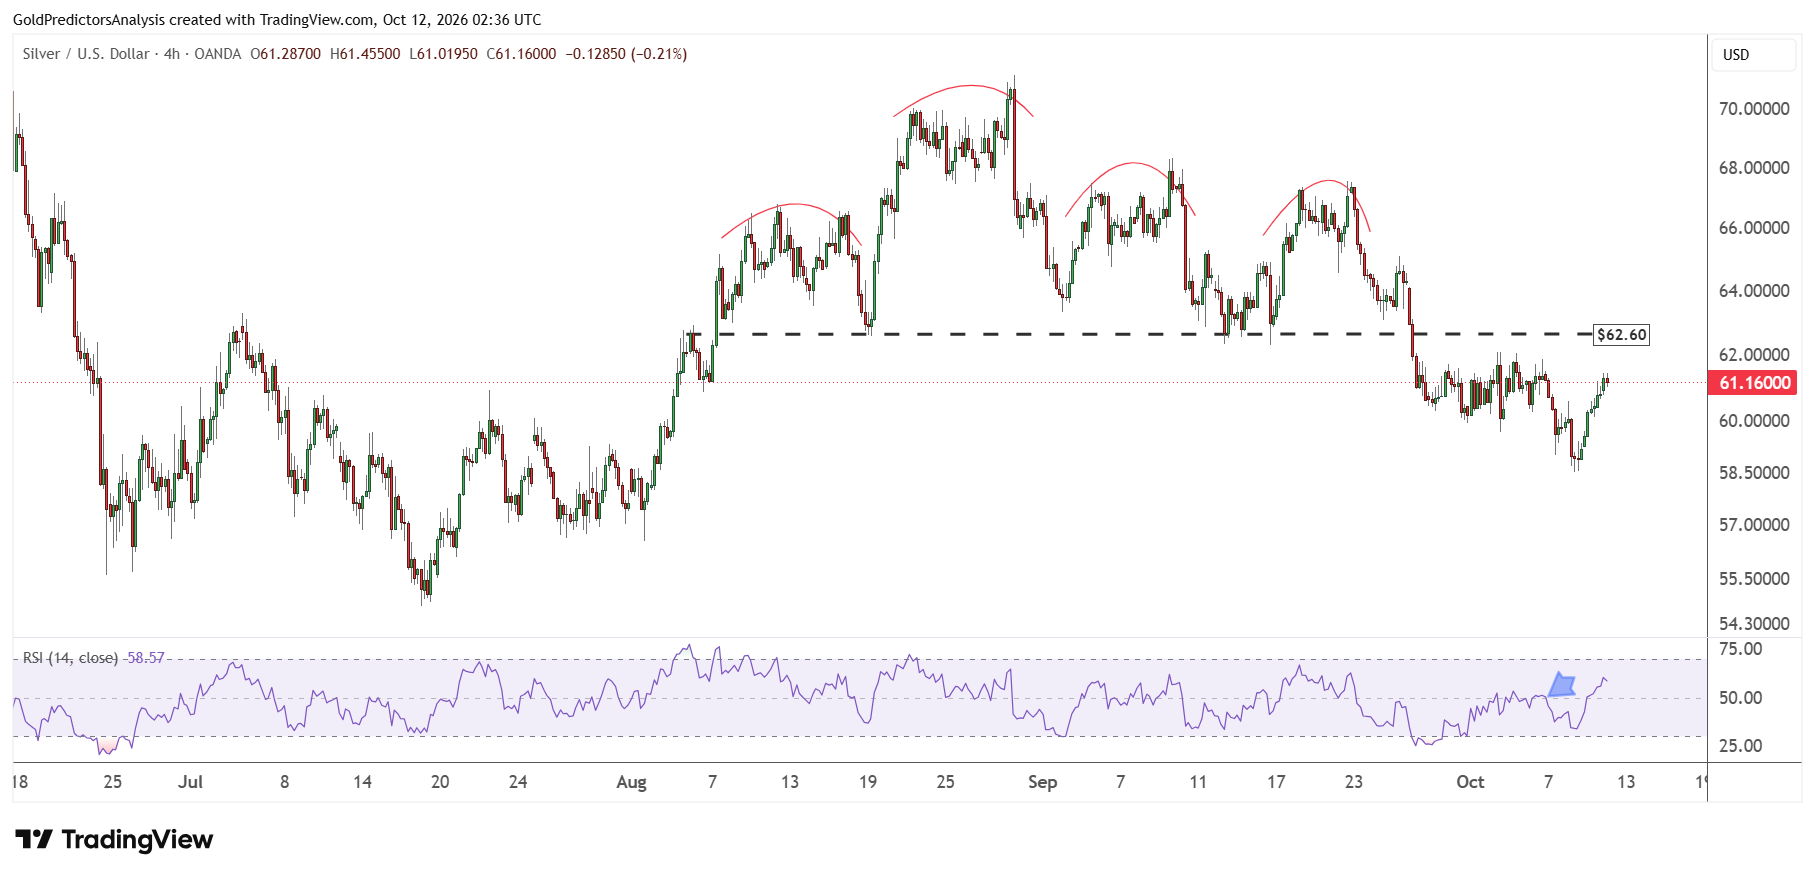
Another chart for spot silver shows that the key resistance in spot silver remains at $62.60. A break above $62.60 is required to push silver prices towards the $64-$65 area in the short term.
What to Watch Next
Gold and silver face a key test with the US CPI report on October 14. The softer inflation could ease the expectations of a rate hike by the Fed and support both metals. Stronger inflation data could lift the dollar and Treasury yields and limit the recovery in precious metals. Gold needs a confirmed break above $4,250 to open the way towards $4,330.
On the other hand, silver must clear $62.60 before testing the resistance zone of $64-$65. In my view, easing inflation pressures and confirmed breaks above resistance would strengthen the rebound in gold and silver. But another increase in oil prices could keep inflation concerns alive and limit further gains in both metals.