Gold: Inflation Data Takes Center Stage as Energy Pressure Eases
Gold got a minor tailwind Monday due to a dip in the energy markets and a softening in some inflation fears. This move came after President Trump announced what he called a temporary energy ceasefire between Russia and Ukraine. Details of the arrangement remain unclear, and neither Moscow nor Kyiv had fully confirmed it. Lower energy costs should help ease headline inflation and should provide the Federal Reserve some flexiblility to pause their rate hikes.
Investor focus now shifts to the upcoming U.S. CPI report due out on Wednesday. Market expectations for an October Fed Funds hike have dropped to approximately 17%, while expectations for a December hike have risen to approximately 86%. With the Fed expected to continue hiking through year end, there is still a good chance that there will be some contraction in the non-yielding asset class in the near to intermediate term.
Institutional investor interest in gold remained high. Global gold ETFs added 67 metric tons in September, and brought total holdings to a new record high of 4,256 tonnes. Third quarter global inflows to gold ETFs hit an all time high of $31 billion, according to the World Gold Council.
A forecast cited by Reuters suggests elevated central-bank demand will continue through 2026. Estimates indicate purchases will be around 720 metric tons in 2026, which is about a 15% reduction from 2025, but still above pre-2022 levels.

Silver: Investment Demand Offsets Solar-Sector Weakness
Fed policy impacts silver prices, but unlike gold, silver has an active industrial demand component. The Silver Institute expects a sixth successive structural deficit in 2026, with an estimated shortfall of 46.3 million ounces.
Industrial demand for silver in 2026 is expected to drop to 639.6 million ounces due to the continued substitution of silver in Photovoltaic manufacturing. AI Infrastructure and the Automotive and Power Electronics sectors will help absorb some of the silver demand.
Also, bar and coin demand for silver is expected to increase by 18%, indicating a return by investors into the silver markets.
Gold Price Forecast
Every new Gold analysis as it publishes, today's technical signal and key levels, live price — on one page.
See all Gold forecastsGold Technical Analysis: XAU/USD Rejected Below $4,227 as $4,175 Support Comes Into Focus
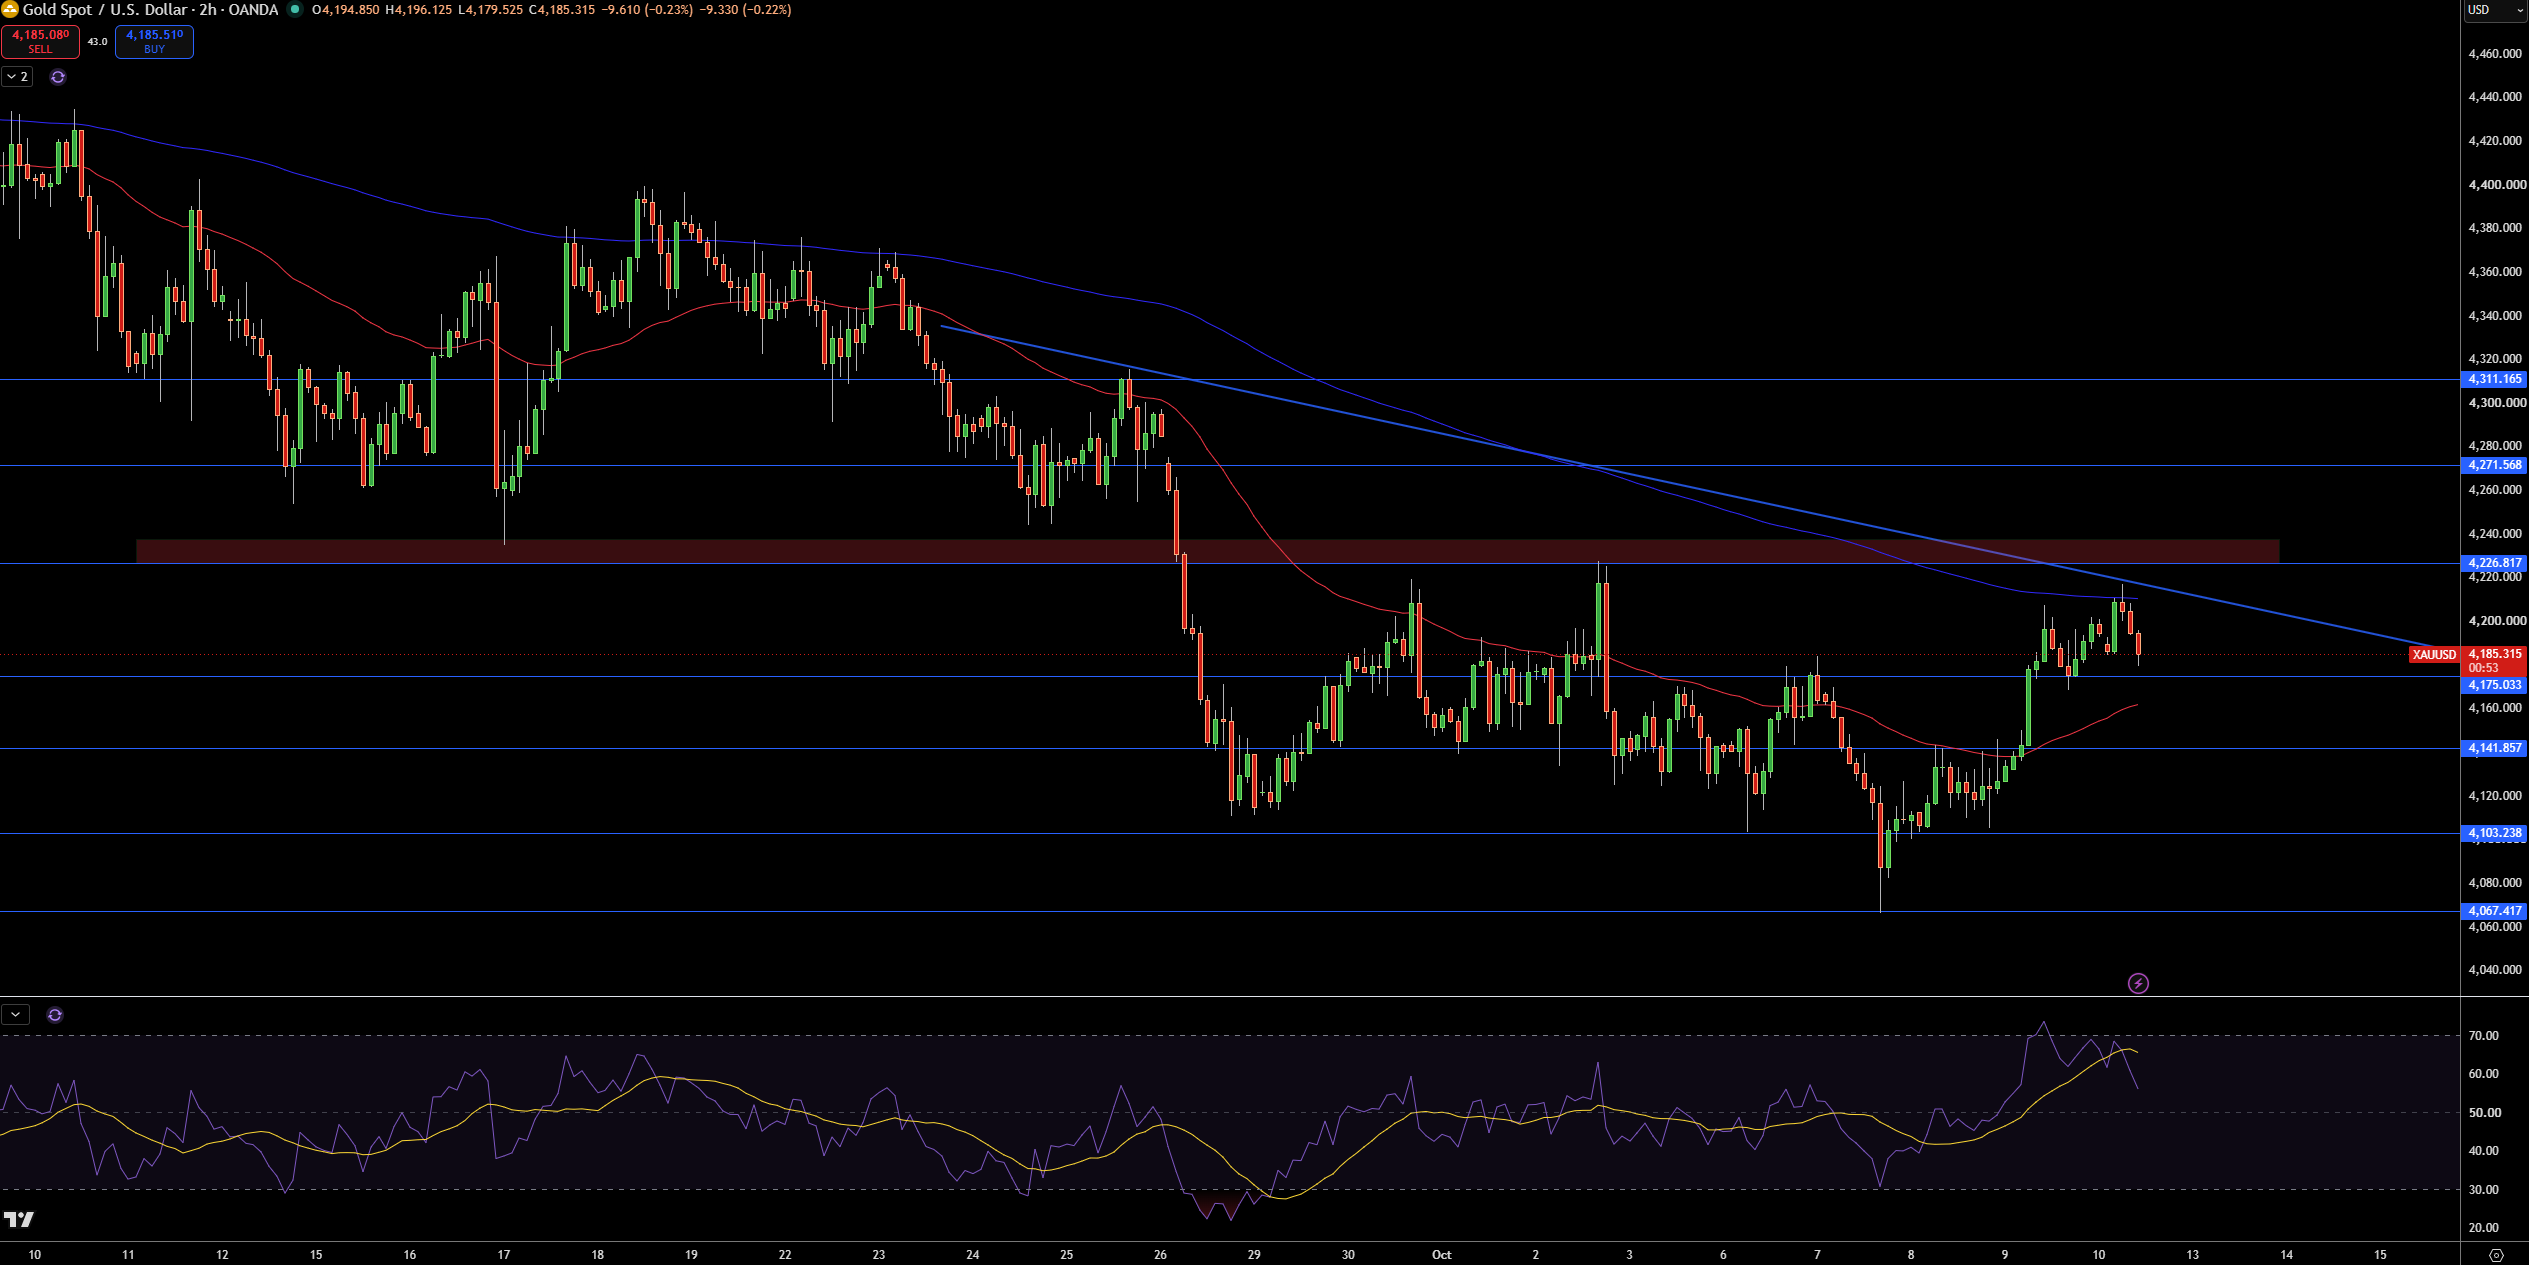
Gold is sitting at around $4,185.32 on the 2-hour chart and recently failed to break above the $4,200 region. Gold is still under the descending trendline and the longer term moving average. The recent candles are showing a loss of momentum after the bounce from the $4,103 region.
I am looking for gold to bounce from the $4,175.03 region, but if it does break below this region, I expect further downside to the $4,141.86 region and possibly $4,103.24 and $4,067.42. On the other hand, if we do see a move above the $4,226.82 region, I expect further upside to the $4,271.57 and $4,311.17 regions.
RSI has moved away from overbought region and is now in the middle of the range. I believe that gold is still in a bearish state as long as it is below $4,226.82 and the descending trendline. If gold does break above this region, it would change the bias to bullish. If gold breaks below the $4,175.03 region, this would open up further downside toward the $4,141.86 region.
Silver Technical Analysis: XAG/USD Rejected at Trendline as $59.96 Support Returns to Focus
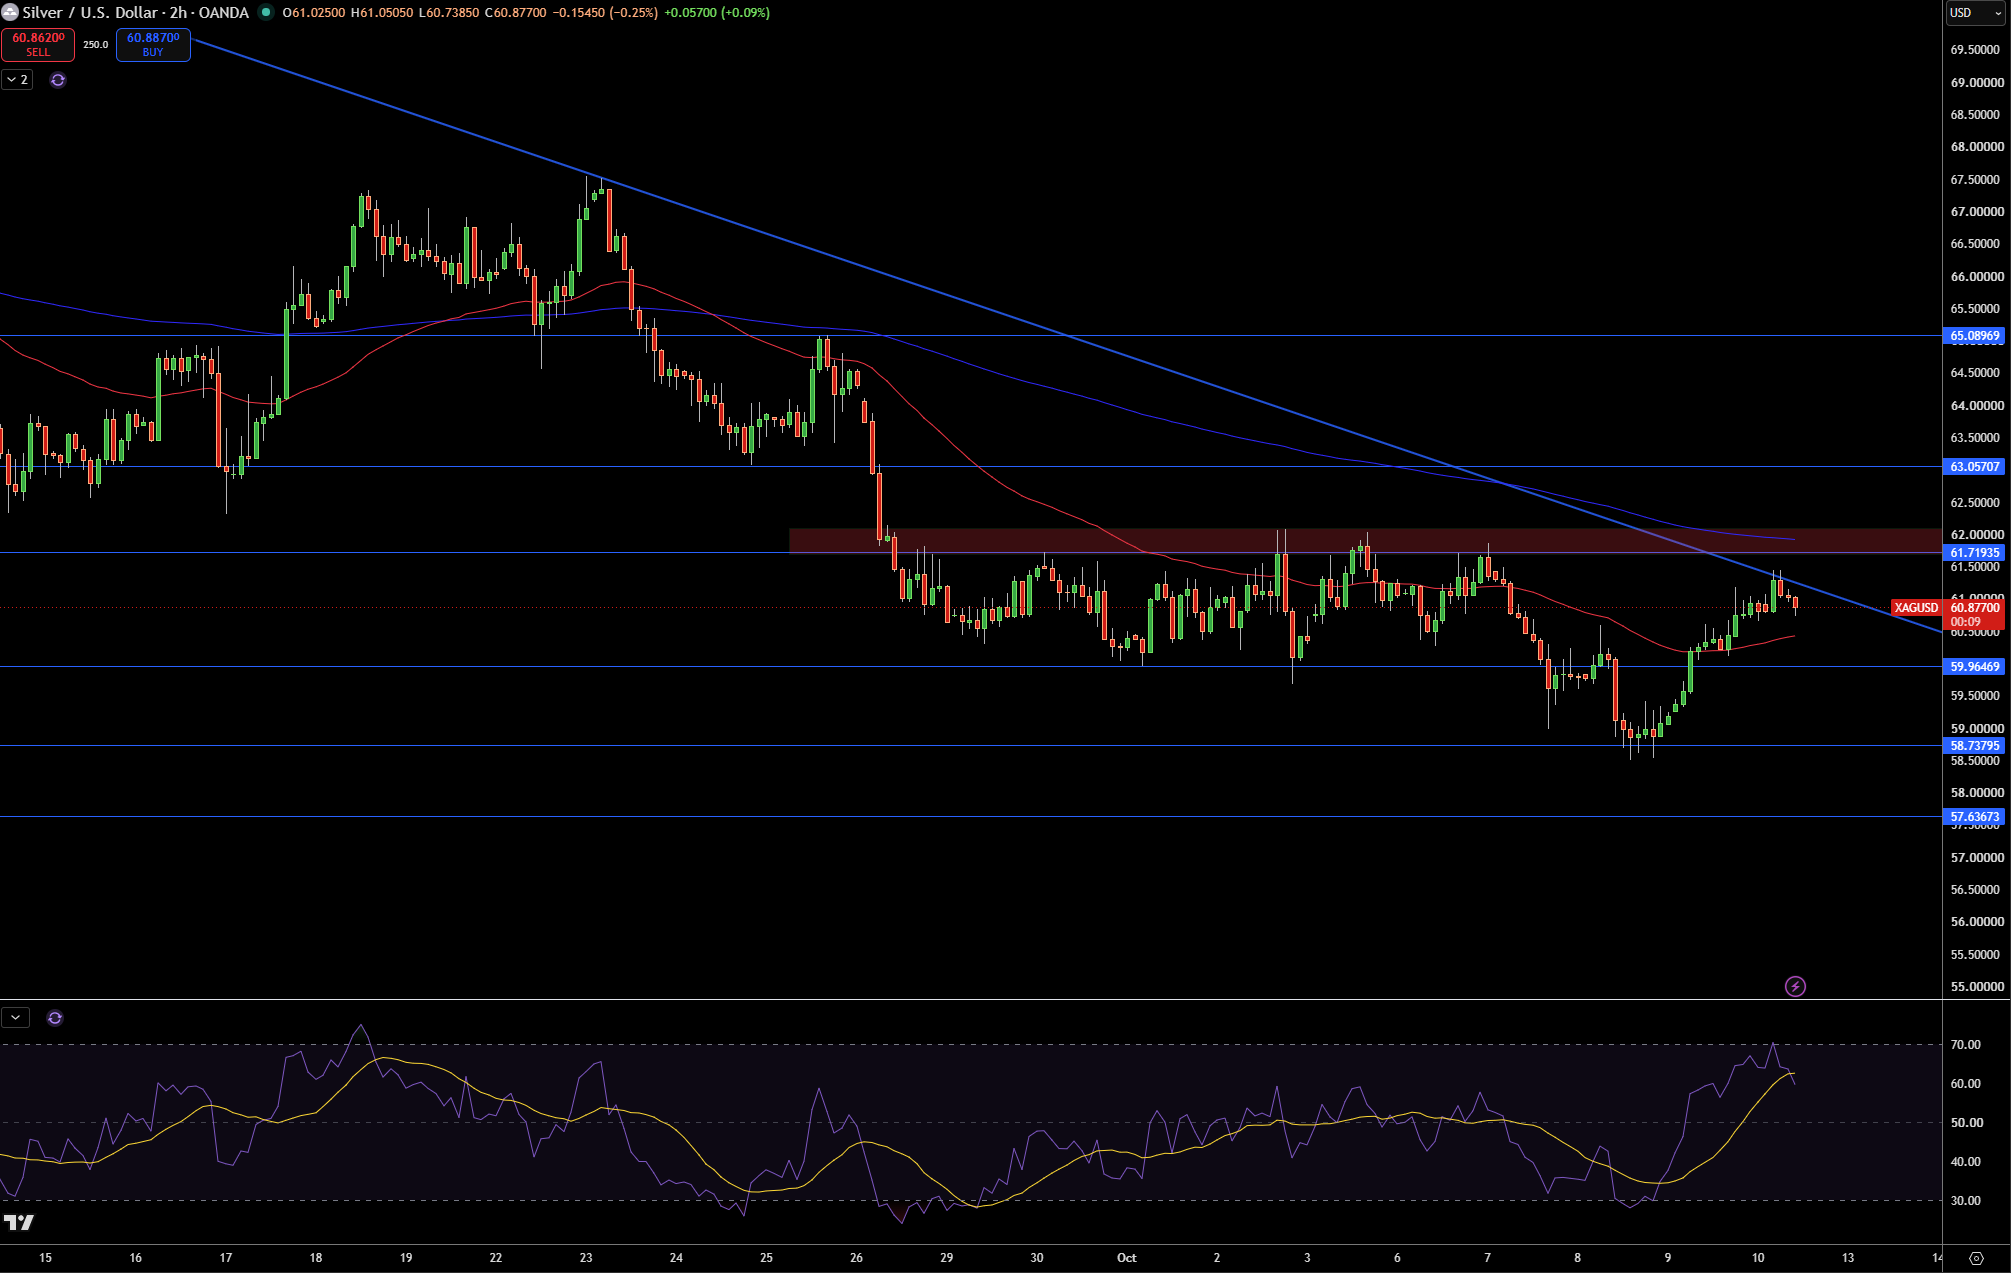
Silver has risen to $60.88 on the 2-hour chart after bouncing up from $58.74, but stalled against the falling trendline. I like to sell here because Silver is also still below the larger moving average structure and trendline, which keeps the bigger picture still in a downtrend.
$59.96 is the first support area I want to watch. A clear move below that would bring $58.74 into play and support below that would be $57.64. $61.72 remains the first major resistance area, with $63.06 and $65.09 becoming more relevant resistance areas if we see a strong move by the bulls to breakout.
RSI is moving back toward its average after the recent move higher and tells us momentum is potentially moving back toward the mean. I like to sell in this area. I will look to change my bias if silver moves and closes above $61.72. If silver moves below $59.96, that would further validate a move toward $58.74 next.