
USOIL: Gulf Output Returns as Russian Supply Prospects Improve
U.S. crude fundamentals have changed following Hurricane Isaias’ disruption of Gulf of Mexico (GOM) production. At the storm’s peak, about 1.5 million barrels a day (b/d) or 72% of Gulf of Mexico crude production was shut-in. Of the major producers, Shell, Chevron and BP have started returning workers and have restarted production.
According to the EIA, commercial crude oil inventories for the week ended October 2, decreased by 3.2 million barrels to 424.1 million barrels, and exports averaged 4.77 million b/d, up about 1.2 million b/d from the prior week. Refinery utilization rate was at 92.7%.

UKOil: Russia Ceasefire Hopes Meet Persistent Hormuz Risk
Elsewhere on the international front, the supply balance shifted after U.S. President Donald Trump announced what he called an energy ceasefire between Russia and Ukraine, and that Russia would immediately supply more than 300,000 metric tons of diesel, followed by 500,000 metric tons in November. Neither Moscow nor Kyiv confirmed the deal.
Middle East risk remains high. Iran says that the U.S. response to its conditions for re-opening the Strait of Hormuz was unsatisfactory. Before the war, roughly 20% of the world’s oil and LNG shipments transited the Strait. Approximately 2.3 million barrels per day of Middle Eastern refining capacity remains offline adding to the global fuel supply deficit.
Natural Gas: U.S. Storage Improves as Qatar LNG Remains Constrained
U.S. working gas inventories increased by 85 billion cubic feet (Bcf) to 3,500 Bcf. Gas inventories are 2% higher than the five-year average for this time of the year.
Global LNG supplies remain constrained. Around 17% of Qatar’s export capacity is offline. September LNG shipments recovered to 1.6 million tons, still less than a quarter of the pre-war average. So far in October, LNG shipments remain tracked at 0.6 million tons.
Natural Gas Price Forecast
Every new Natural Gas analysis as it publishes, today's technical signal and key levels, live price — on one page.
See all Natural Gas forecastsNatural Gas Technical Analysis: NG Holds $3.11 as $3.24 Becomes the Next Upside Test
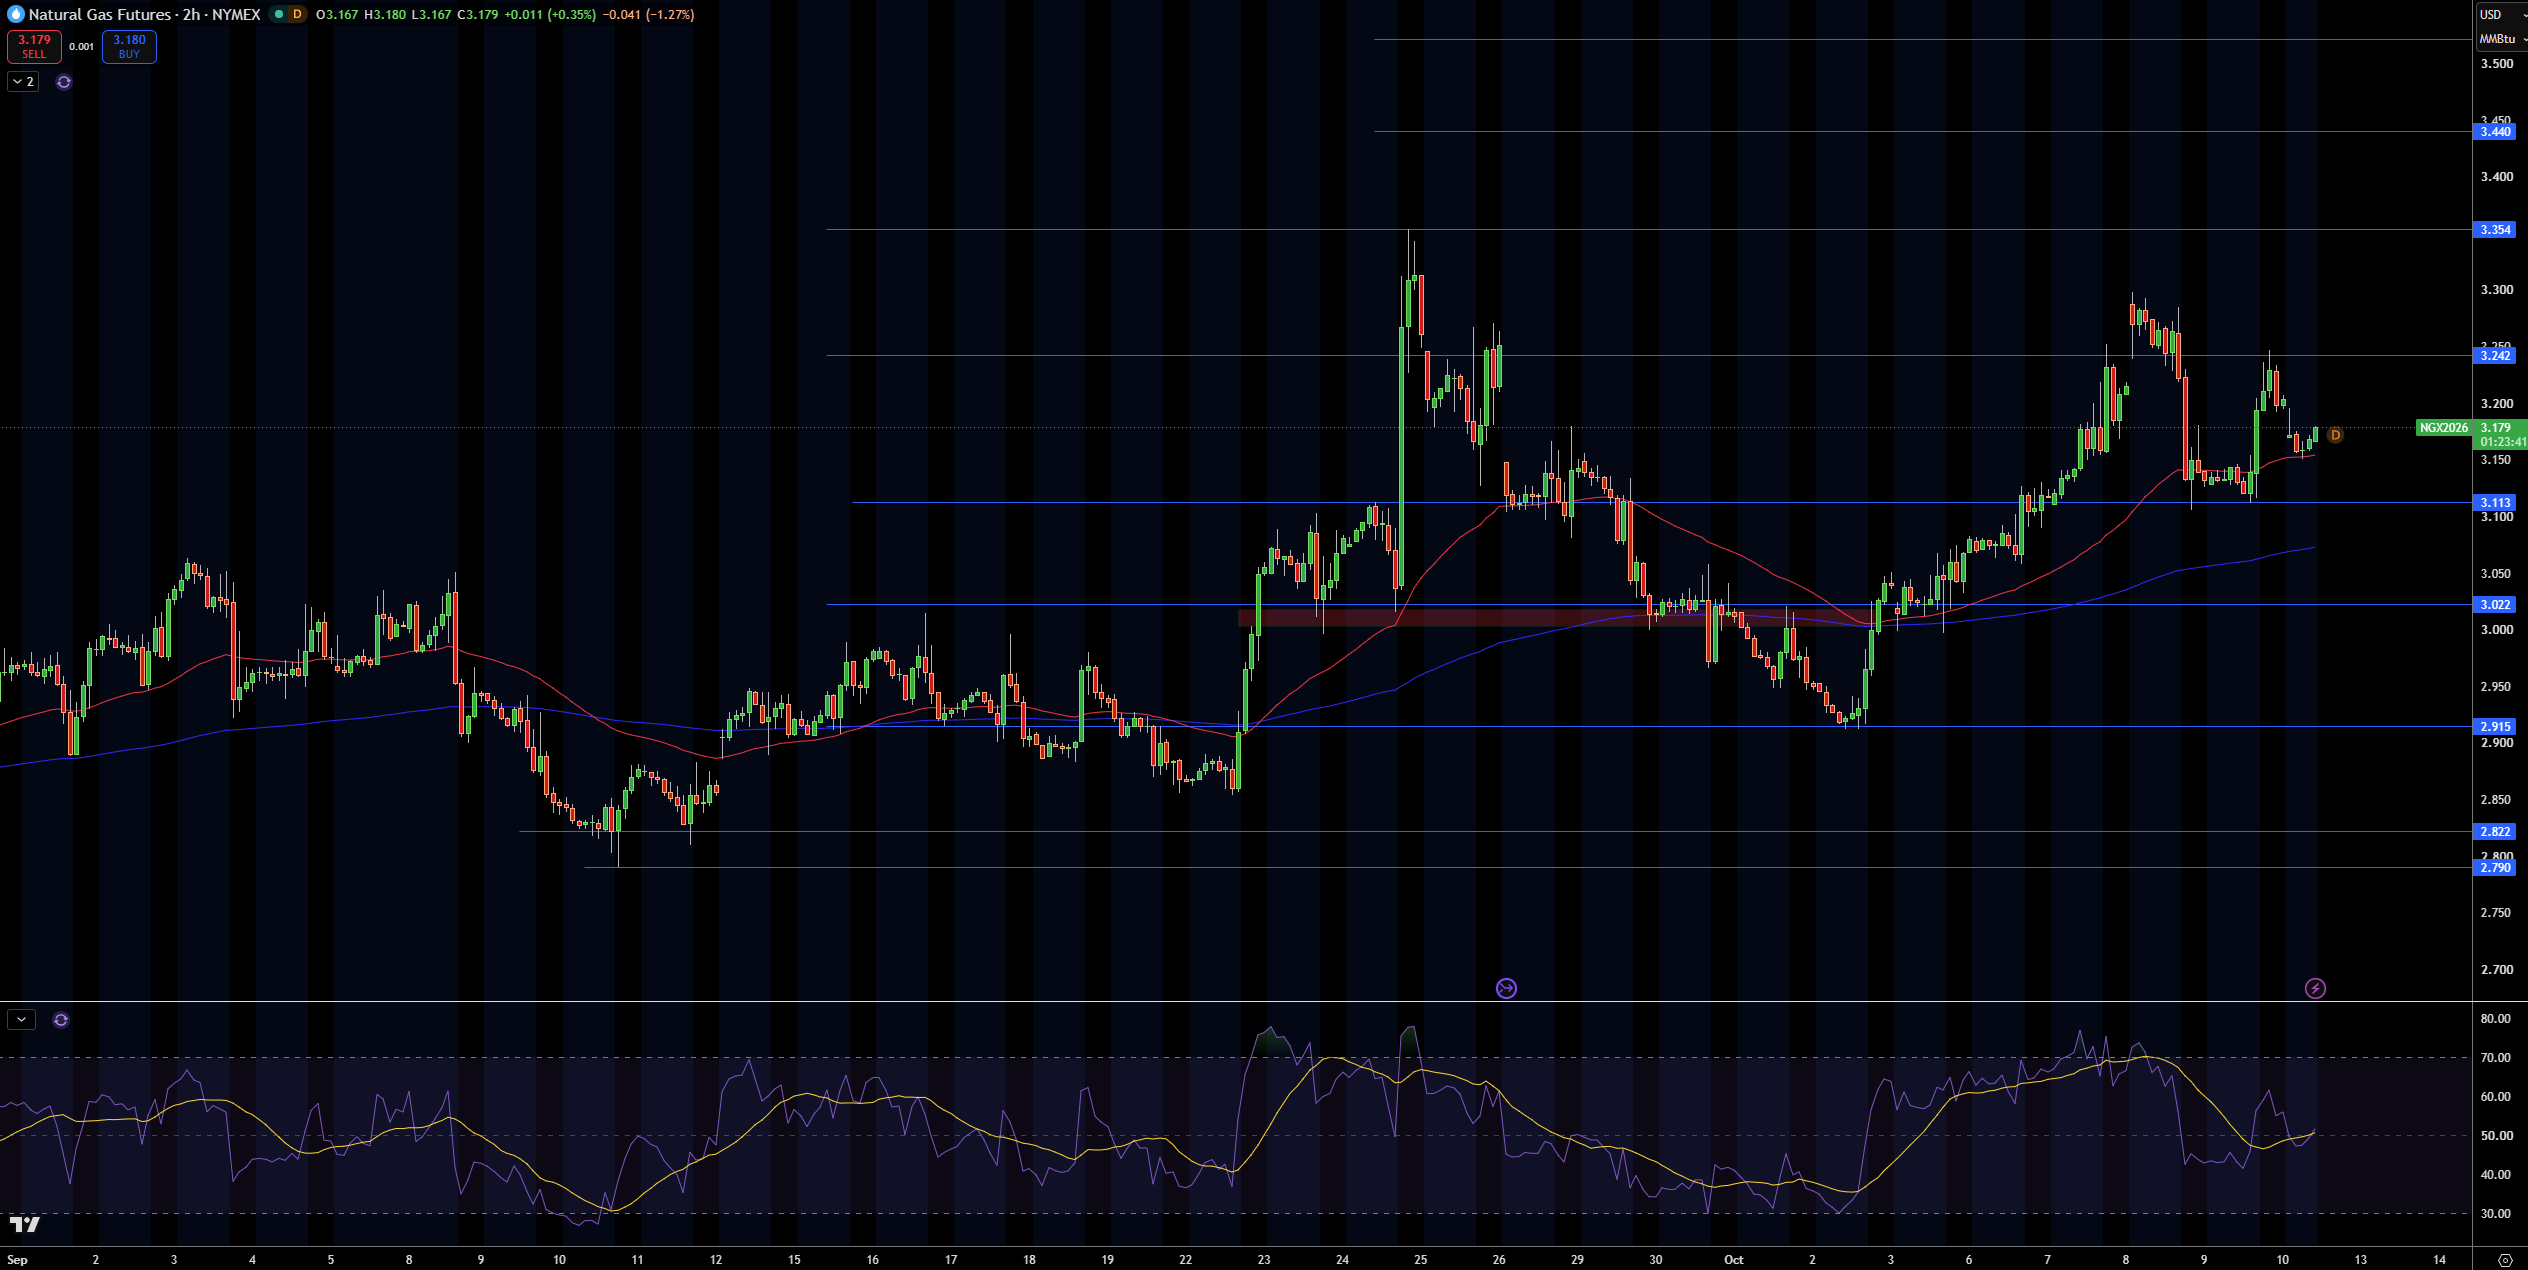
Natural gas is currently trading at around $3.18 on the 2 hour chart after bouncing up from $3.11. What interests me is price currently trading above both moving averages and the overall trend of higher lows is still valid despite the most recent pullback from the $3.30 area.
I see $3.24 as the first resistance area and beyond that $3.35, $3.44, and so on. $3.11 is support again, and if that breaks, focus shifts to $3.02, $2.92, $2.82, and so on.
RSI is back to the neutral zone after being overbought which means that price has just pulled back from being overbought. I like the long side as long as price trades above $3.11. I am also interested in the $3.24 area to the upside, where a break above opens the door to $3.35. If $3.11 breaks to the downside, $3.02 opens.
WTI Crude Oil Technical Analysis: USOIL Tests $91.40 as Triangle Compression Builds
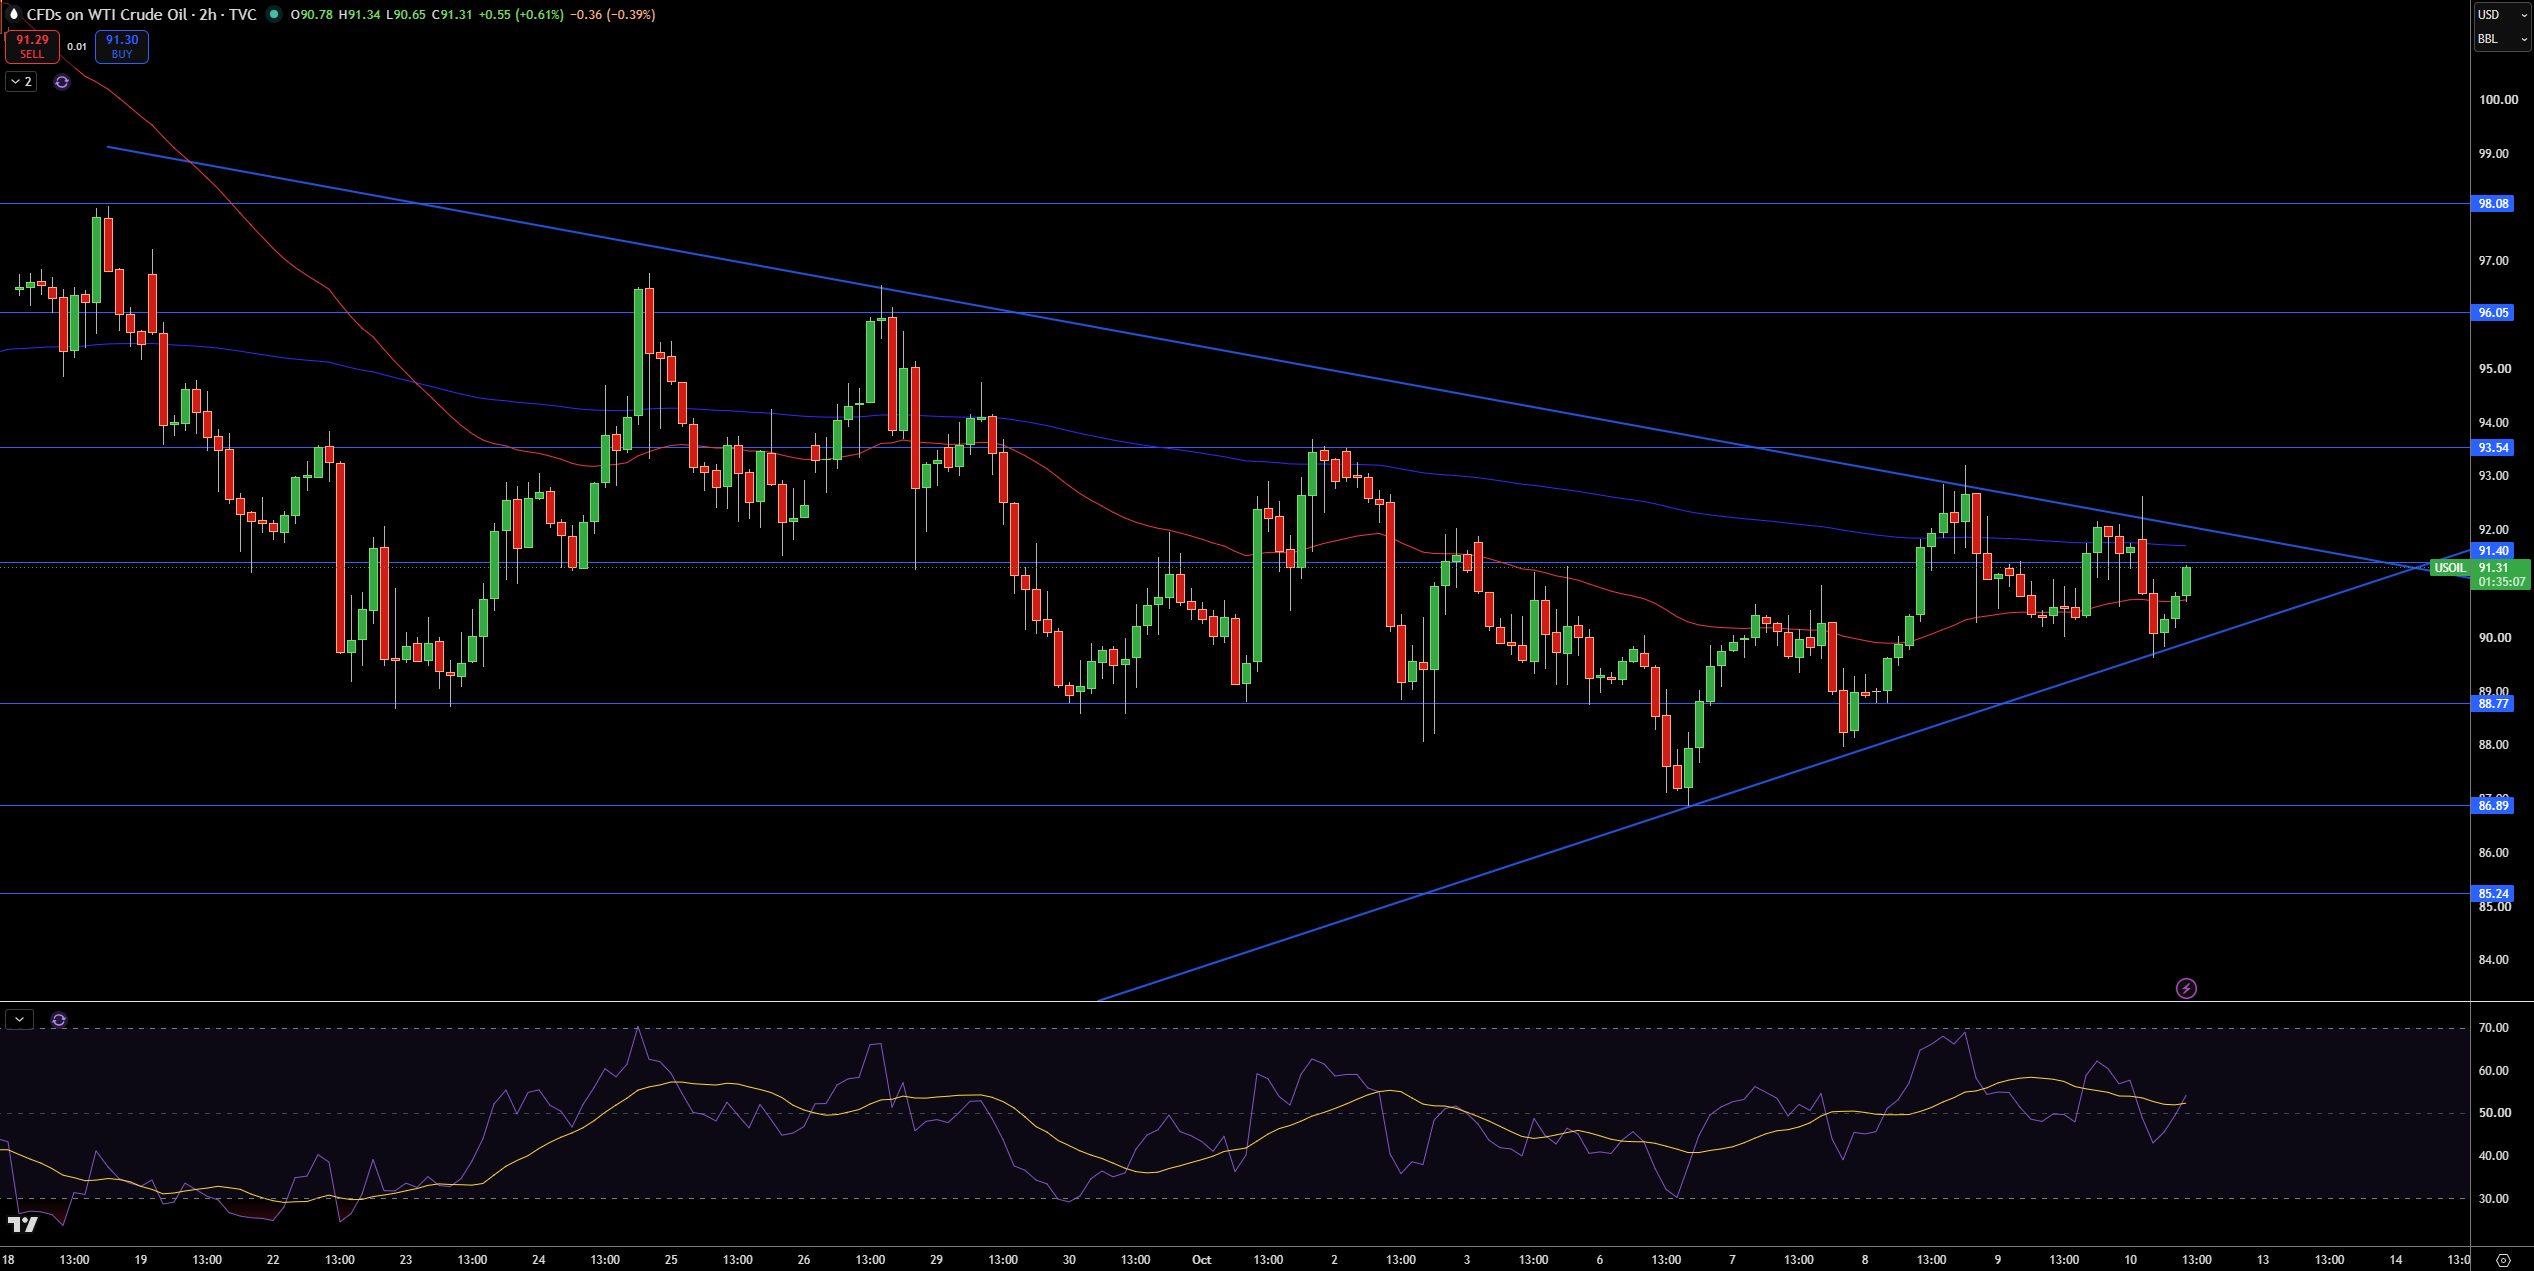
WTI crude oil is currently trading at $91.31. What is important about this price action is the compression between the descending trendline and the rising support line. The moving averages are also starting to flatten. This is short term compressing action.
The first area of interest is $91.40. A break above that would target $93.54, then $96.05, and $98.08. Support comes in at $88.77, then $86.89 and $85.24.
RSI is showing a neutral picture, but, like WTI, is caught in the middle of the range. A break above $91.40 would be bullish and a breakdown below $88.77 would put the focus back on the $86.89 level.
Brent Crude Oil Technical Analysis: UKOIL Breaks Higher as $106.03 Comes Into Focus
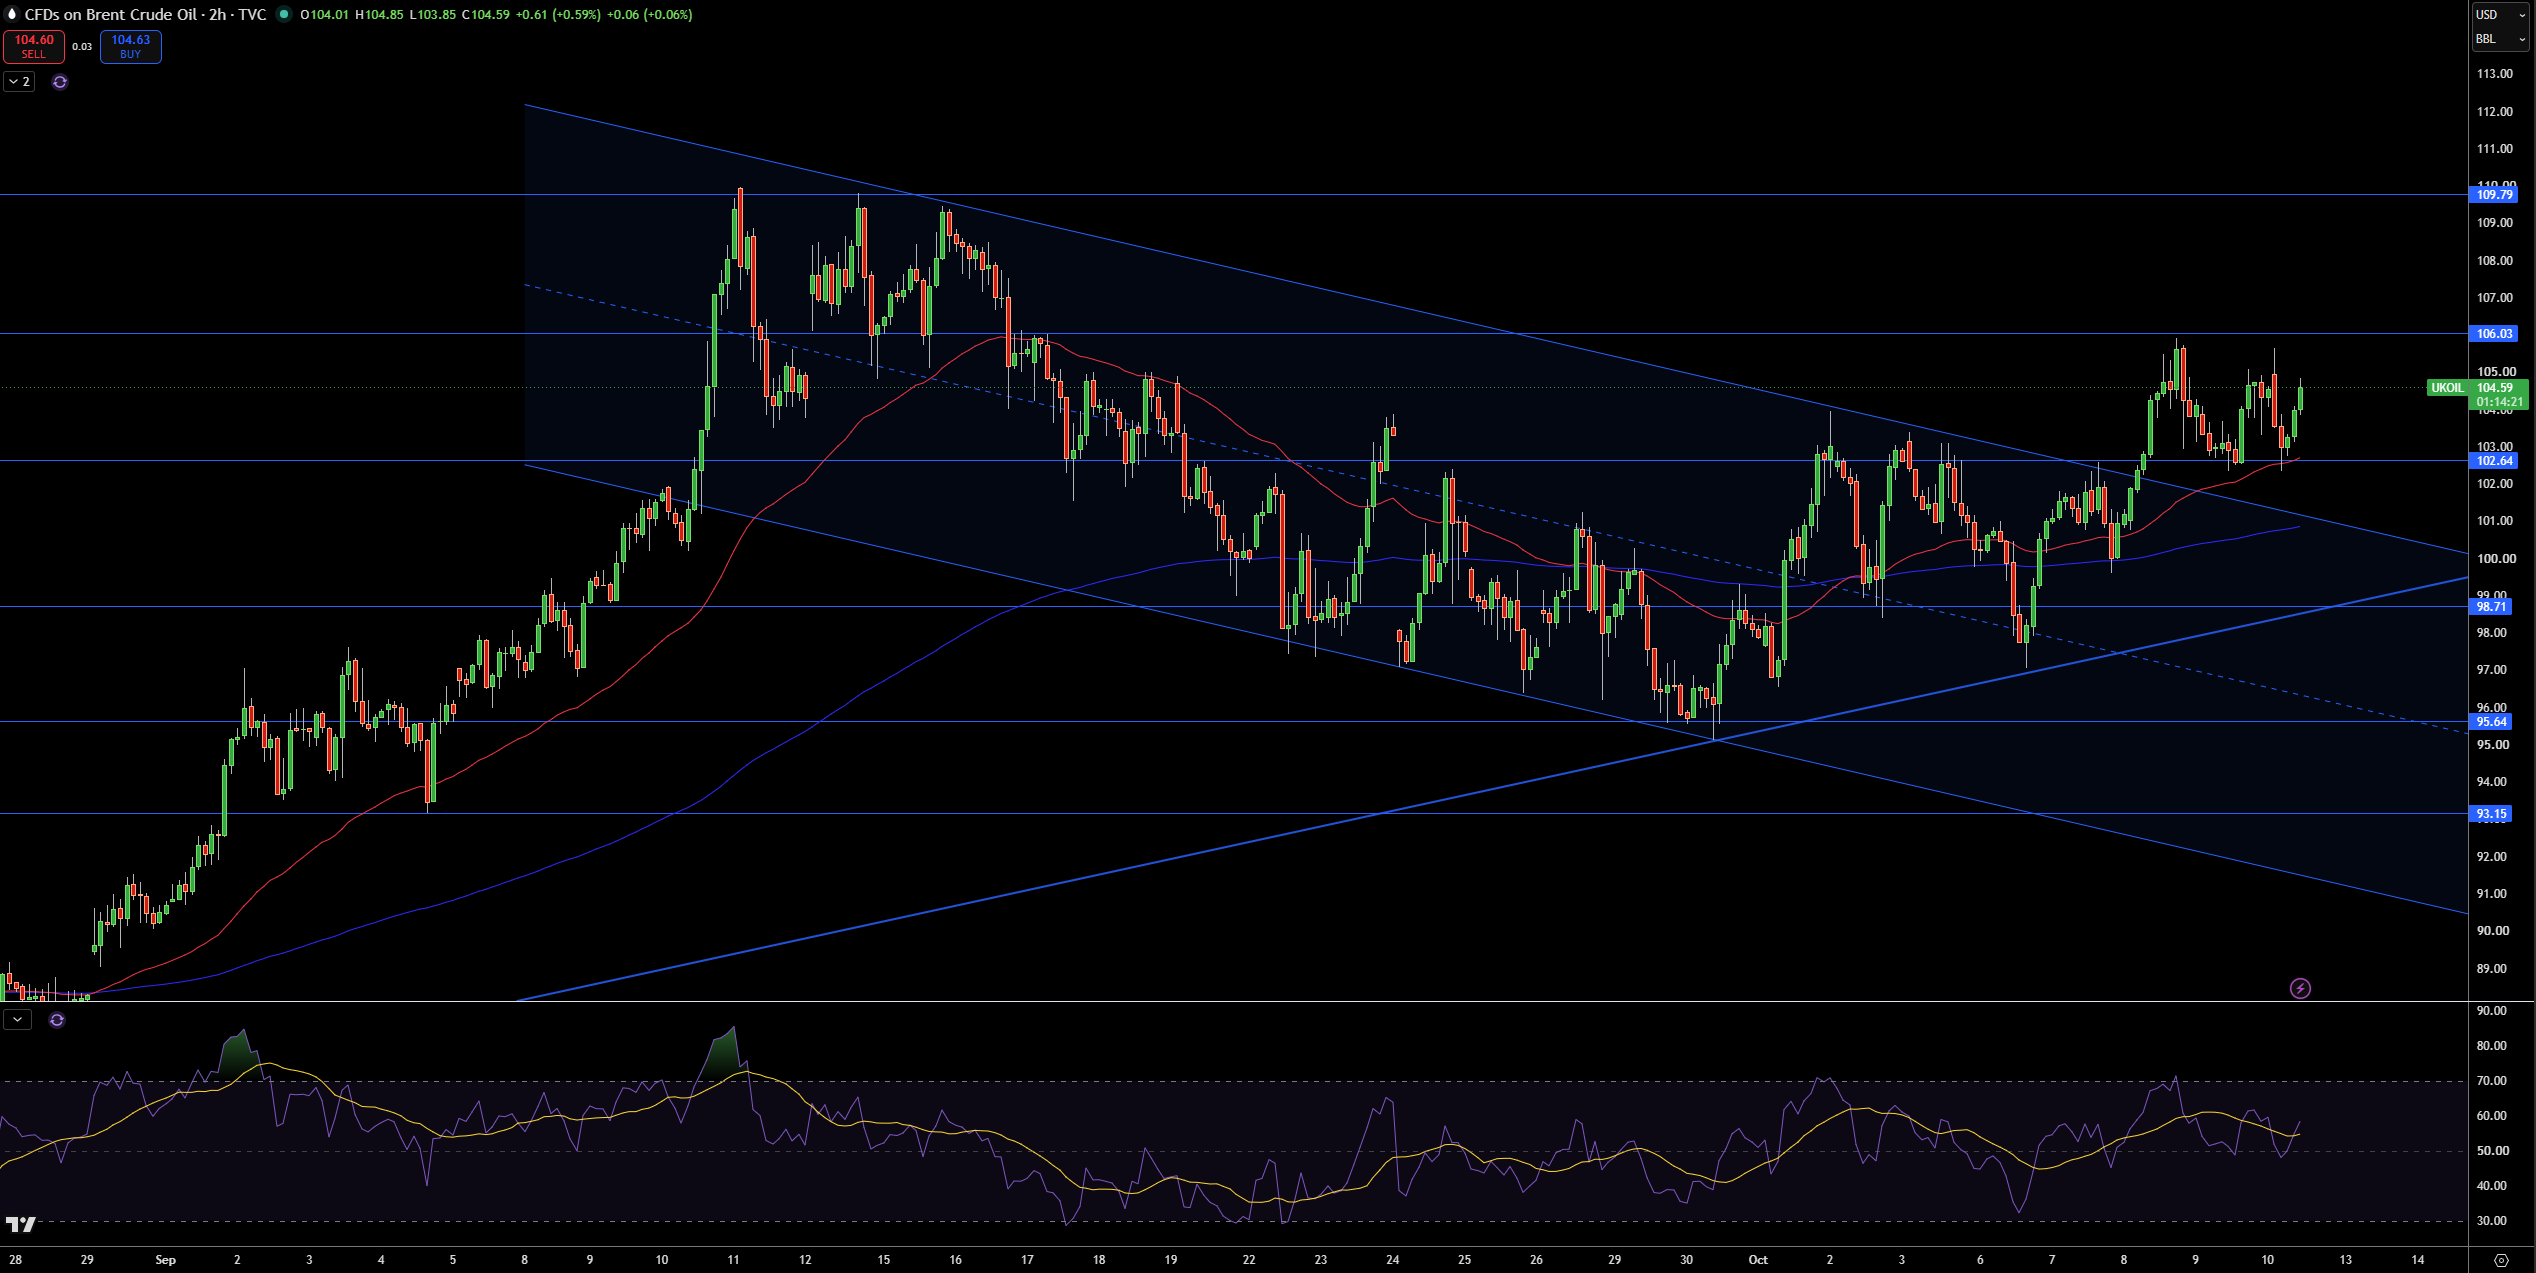
Brent Crude is currently trading at $104.59 with bullish momentum breaking through the upper trendline of the descending channel. Price is currently above the $102.64 area and both moving averages. This is a positive short-term development compared to WTI.
The price of Brent is now above $102.64 and both moving averages. This creates an even stronger case than WTI. I am looking for $106.03 for the first target. $102.64 is the first support and below that $98.71, $95.64, and $93.15 are areas of interest.
RSI is showing positive momentum and bullish condition. As long as $102.64 does not break down, the bias should be bullish, especially as long as Brent trades above the channel. A break above $106.03 supports the case for $109.79 and a break below $102.64 invalidates the bullish development.