
USOIL: Russian Diesel Relief Meets Softer Demand Outlook
US crude fundamentals are balancing as expectations of further Russian diesel exports offset worries about loss of Middle Eastern crude. The Trump administration recently eased some restrictions on Russian diesel, to enable Russia to export more diesel. But how much diesel is available is uncertain. Also, Ukrainian attacks on Russian refining infrastructure continue, and could impact the amount of Russian diesel available for export.
Demand expectations also weakened. OPEC cut its 2026 global oil-demand growth forecast to 400,000 barrels a day from 1.4 million bpd, citing developments in the global economy and energy market.

UKOil: Hormuz and Shipping Costs Keep Supply Risk Elevated
Brent fundamentals remain dominated by Middle East logistics. Iran is still assessing Washington’s response to Tehran’s proposal to reopen the Strait of Hormuz. Until that assessment is completed, disruption to shipping through one of the world’s most important energy straits is possible.
Shipping costs have increased, with OPEC and non-OPEC ministers highlighting how freight and insurance costs on some energy routes have increased to more than one-third of the underlying commodity’s value, adding inflationary pressure and creating challenges in crude and product flows.
Natural Gas: US Storage Improves, but Global LNG Remains Tight
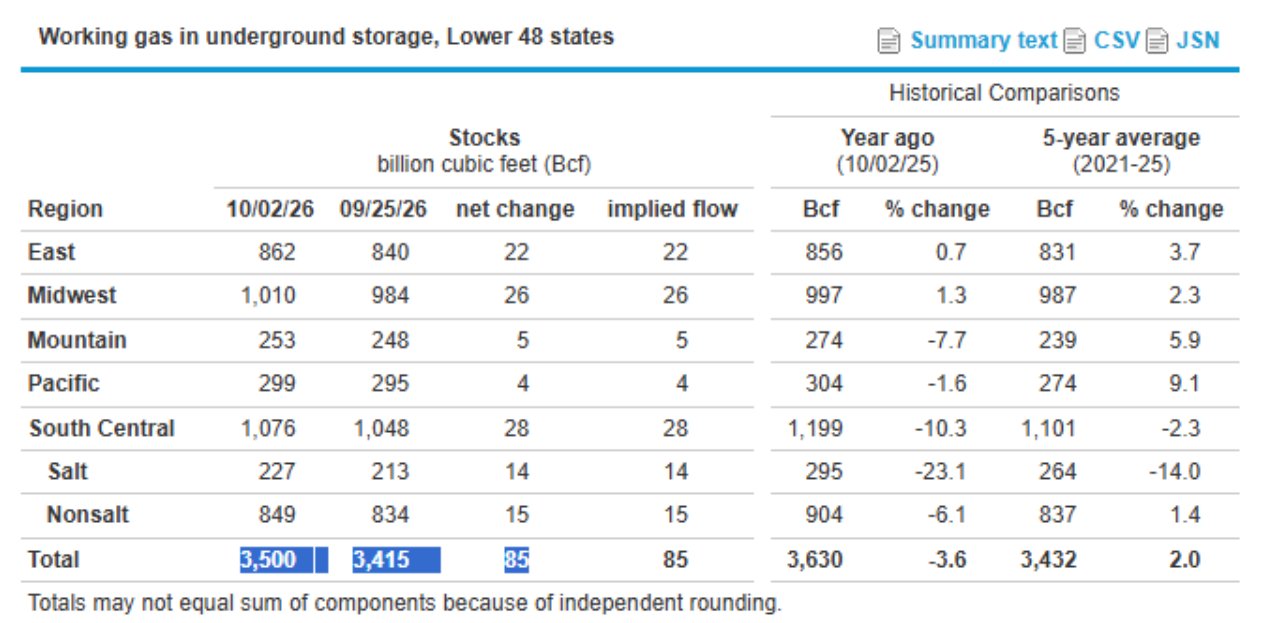
US gas inventories provide a relatively comfortable domestic buffer. EIA data show working gas increased by 85 Bcf to 3,500 Bcf for the week ended October 2, and stocks are 2% above the five-year average.
Internationally, the situation is much tighter. Damage and disruptions have removed approximately 17% of Qatar’s LNG export capacity, and September shipments recovered to only about one-fourth of pre-war levels. Meanwhile, European storage is expected to be only 75%-78% full going into November, creating more competition to capture US LNG cargoes.
Natural Gas Price Forecast
Every new Natural Gas analysis as it publishes, today's technical signal and key levels, live price — on one page.
See all Natural Gas forecastsNatural Gas Technical Analysis: NG Consolidates Above $3.11 as $3.24 Caps the Recovery
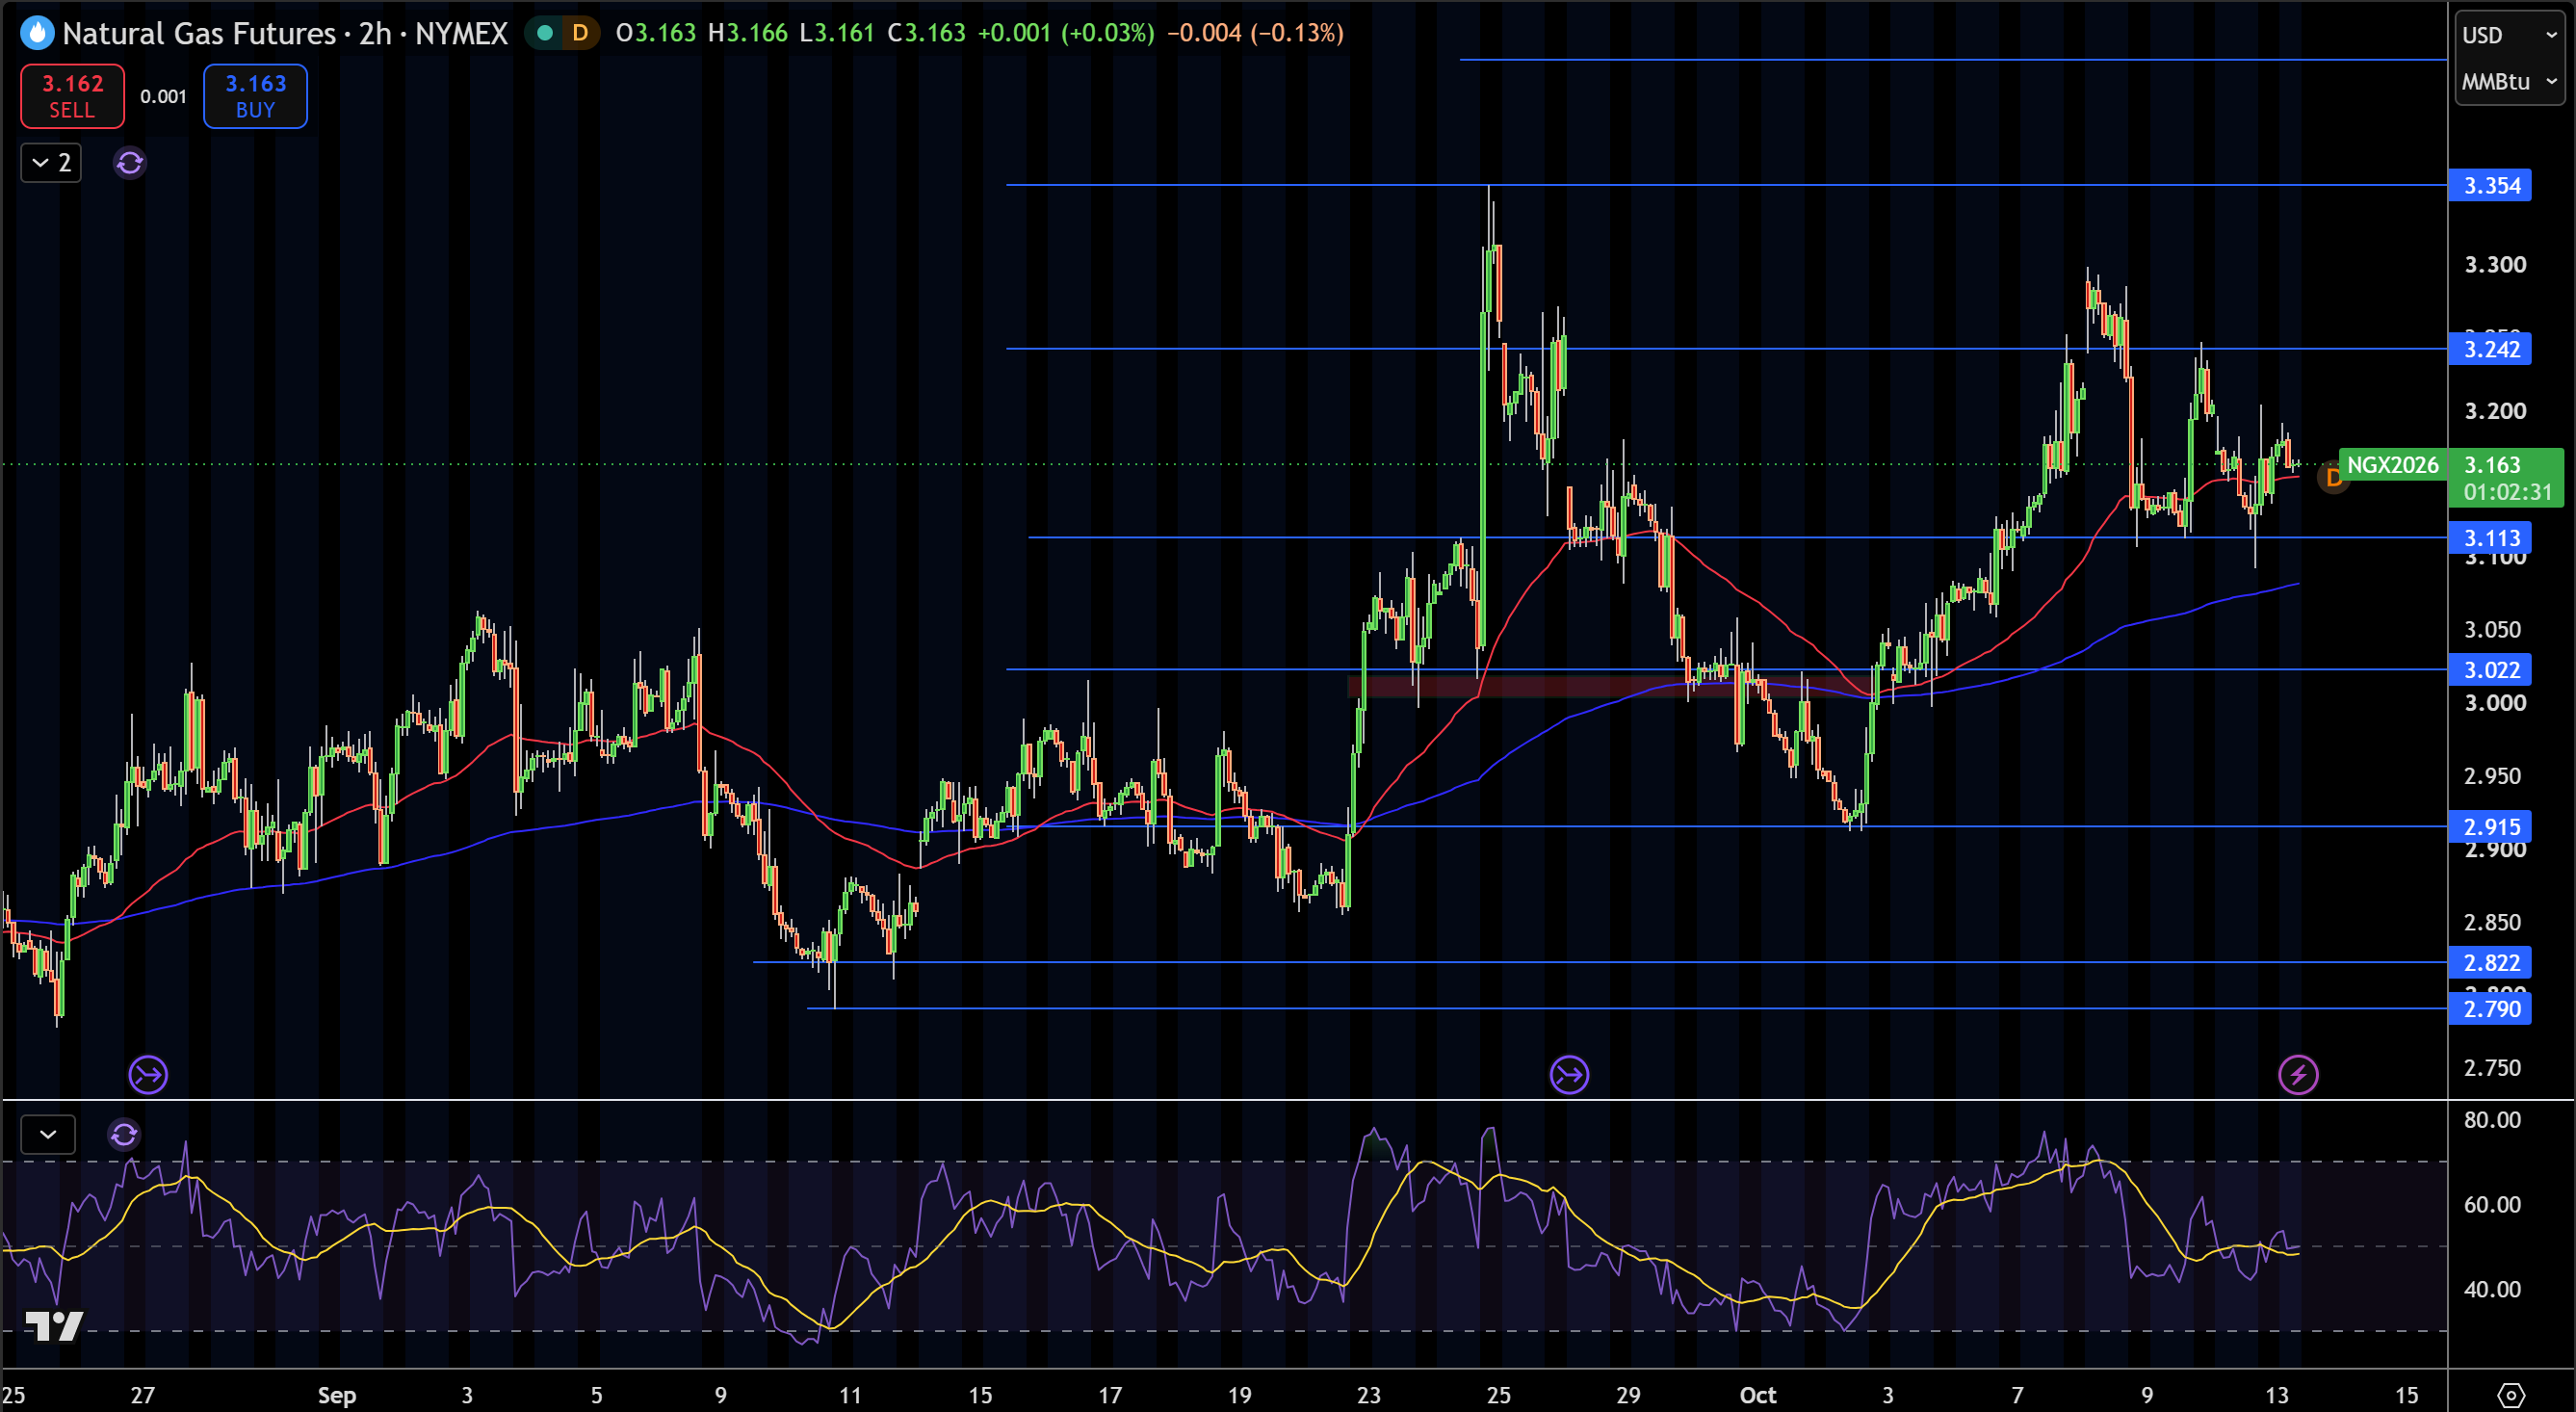
NG is trading near $3.16/MMBtu on the 2-hour chart and has rebounded from $3.11. What is of interest is NG’s current position above both moving averages, but note the shift into consolidation following the rejection near $3.24 and $3.30. The larger recovery is still in effect, but NG needs a breakout to bring back better momentum.
$3.24 is the first resistance, and an intermediate target, with $3.35 and $3.44 being the next levels of resistance above that. Support is located at $3.11, $3.02, $2.92, and $2.82.
Momentum has slowed, and the RSI is near the 50 neutral point. I am currently neutral with a slight bullish bias, but this could change depending on where NG trades. A clear break above $3.24 would bring a more bullish bias, and a close below $3.11 would be bearish and focus on a possible move down to $3.02.
WTI Crude Oil Technical Analysis: USOIL Holds $92.14 as $94.34 Becomes the Next Upside Test
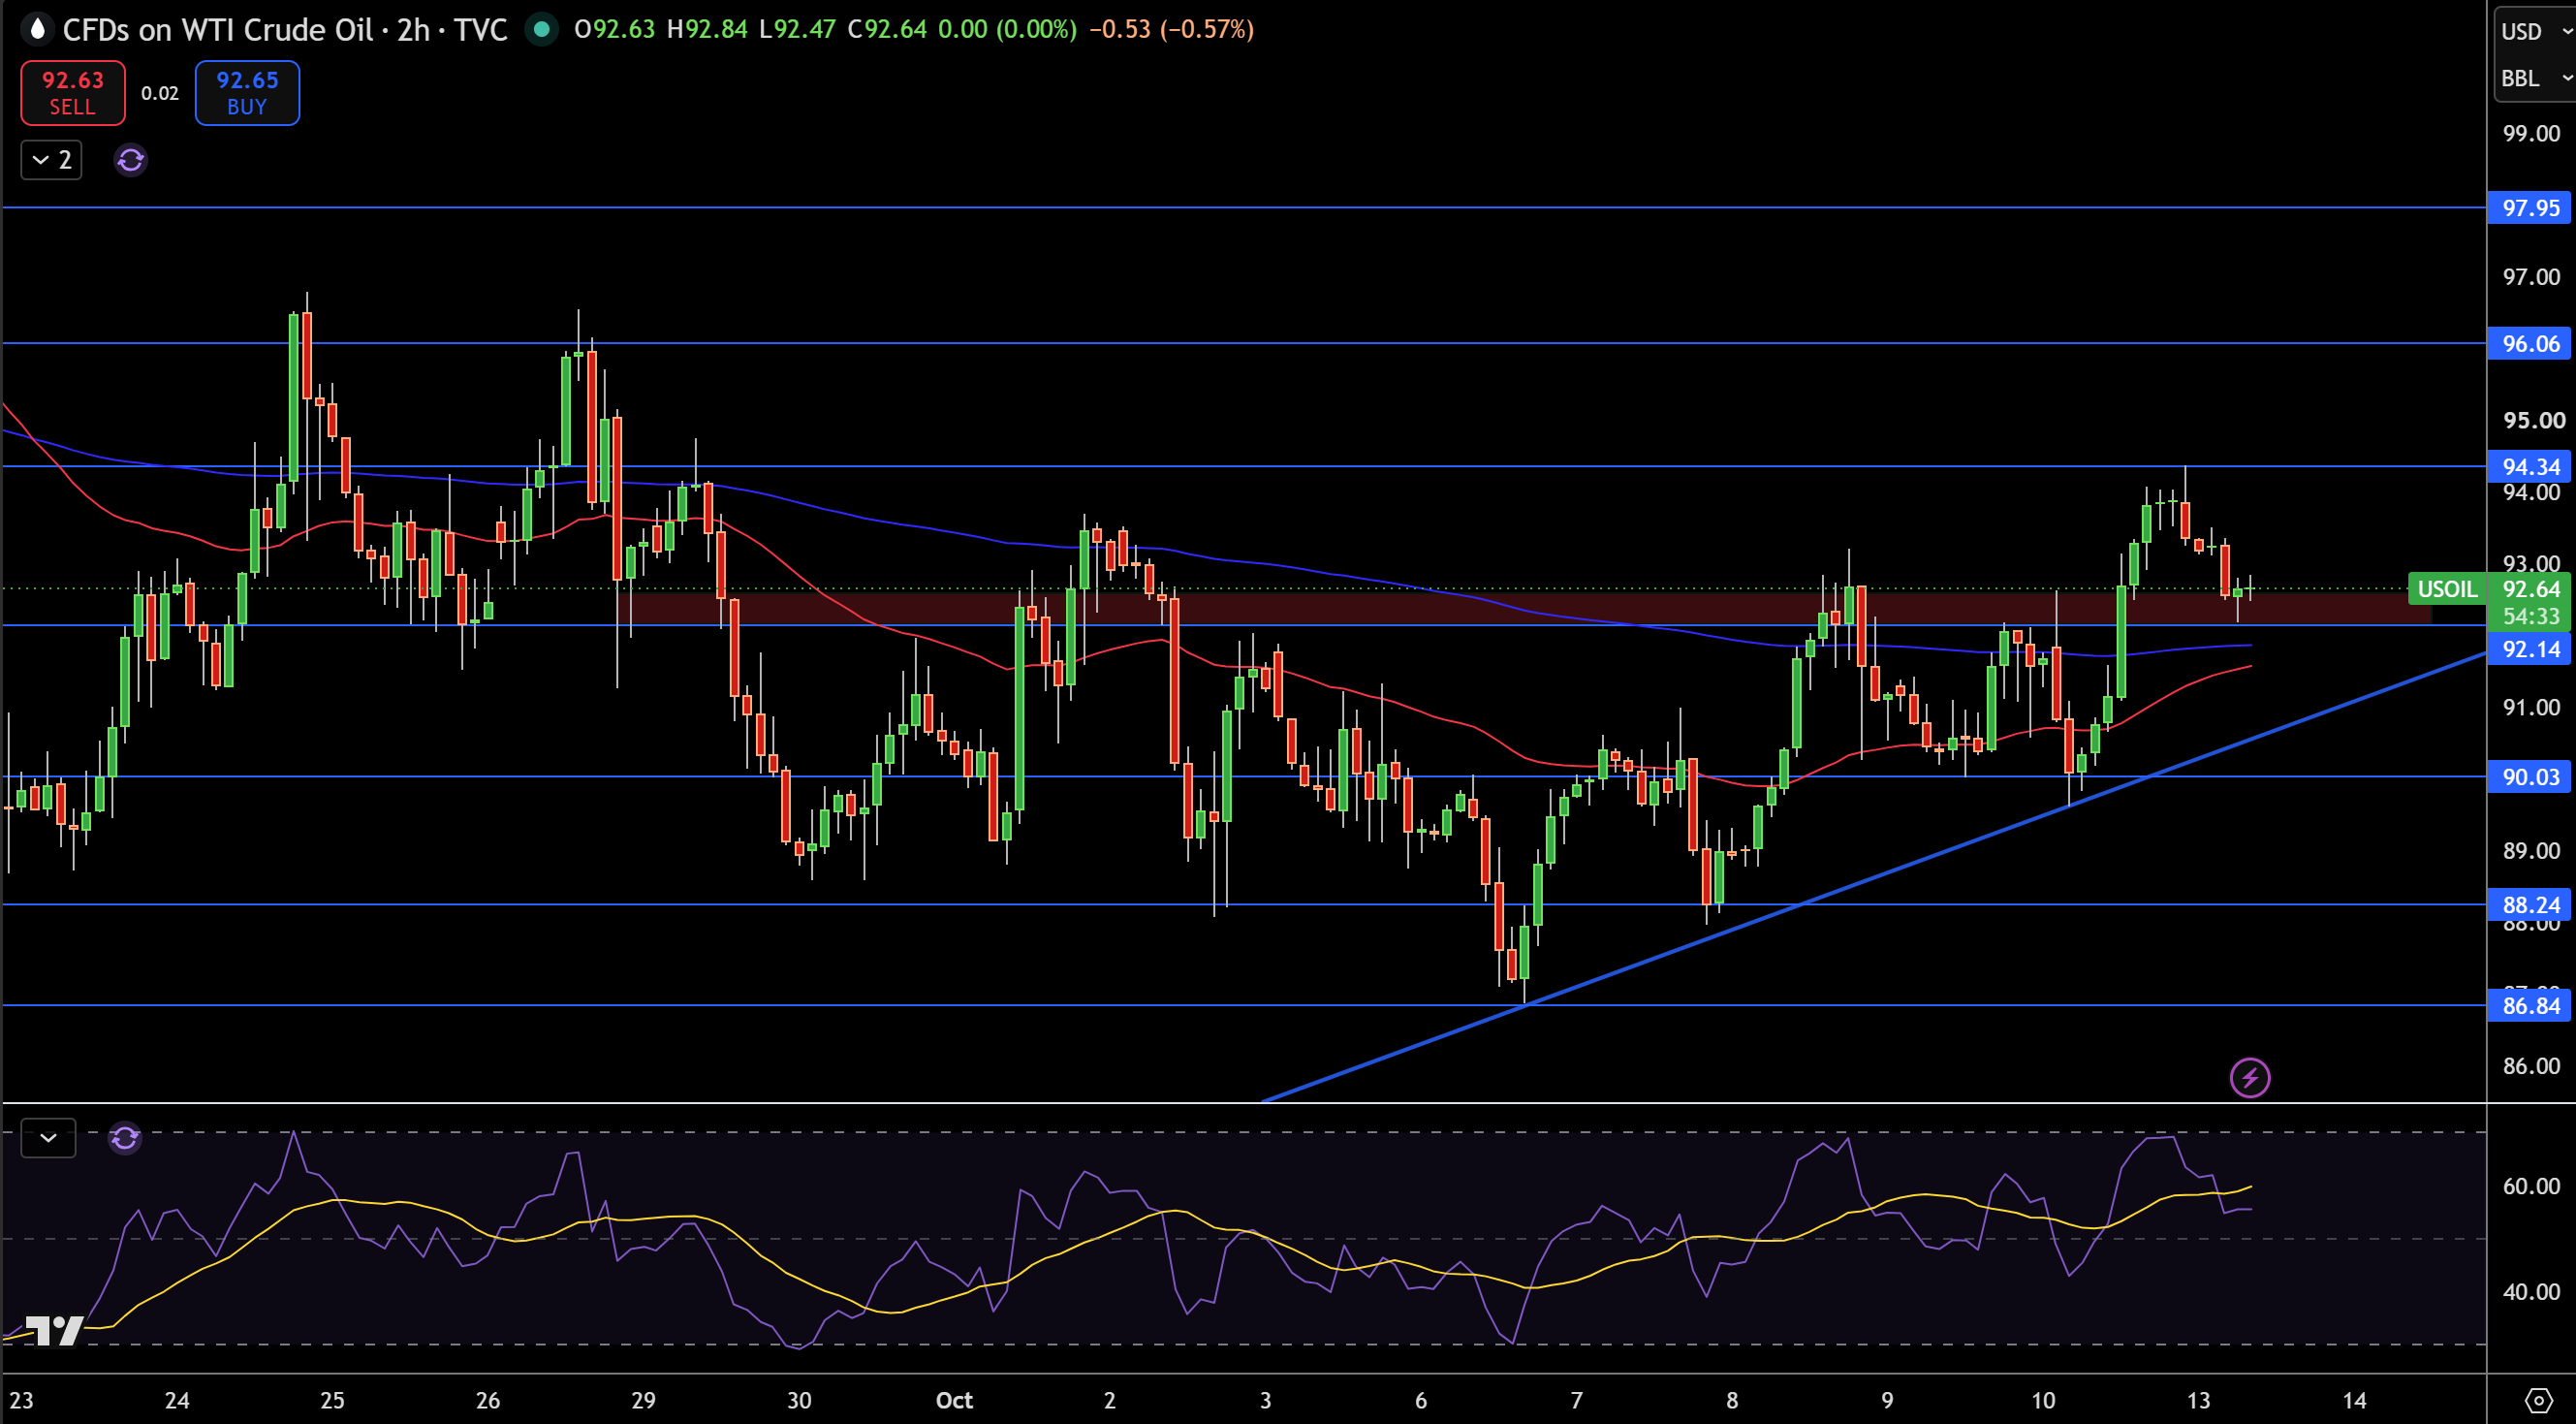
WTI crude oil is trading at $92.64 on the 2-hour chart and is currently up from the $88.24 to $90.03 support region. Right now price is maintaining the bullish structure by trading above both moving averages and the rising trendline. In addition, price is holding above the $92.14 breakout level.
I see $94.34 as the first upside target. This level opens up the next target at $96.06 and the final target at $97.95. On the other hand, the $92.14 support level is the first line of defense, with the $90.03 level, the $88.24 level, and the $86.84 level coming into play if sellers regain control.
Looking at the RSI, it is currently near 50, which indicates that neither the bulls nor the bears are in control. However, I am bullish as long as price holds above $92.14 and the rising trendline. I see a break above $94.34 increasing the likelihood of a move to the $96.06 level and a move below the $90.03 level increasing the likelihood of a move to the $88.24 level.
Brent Crude Oil Technical Analysis: UKOIL Holds Above $102.30 as $107.22 Comes Into Focus
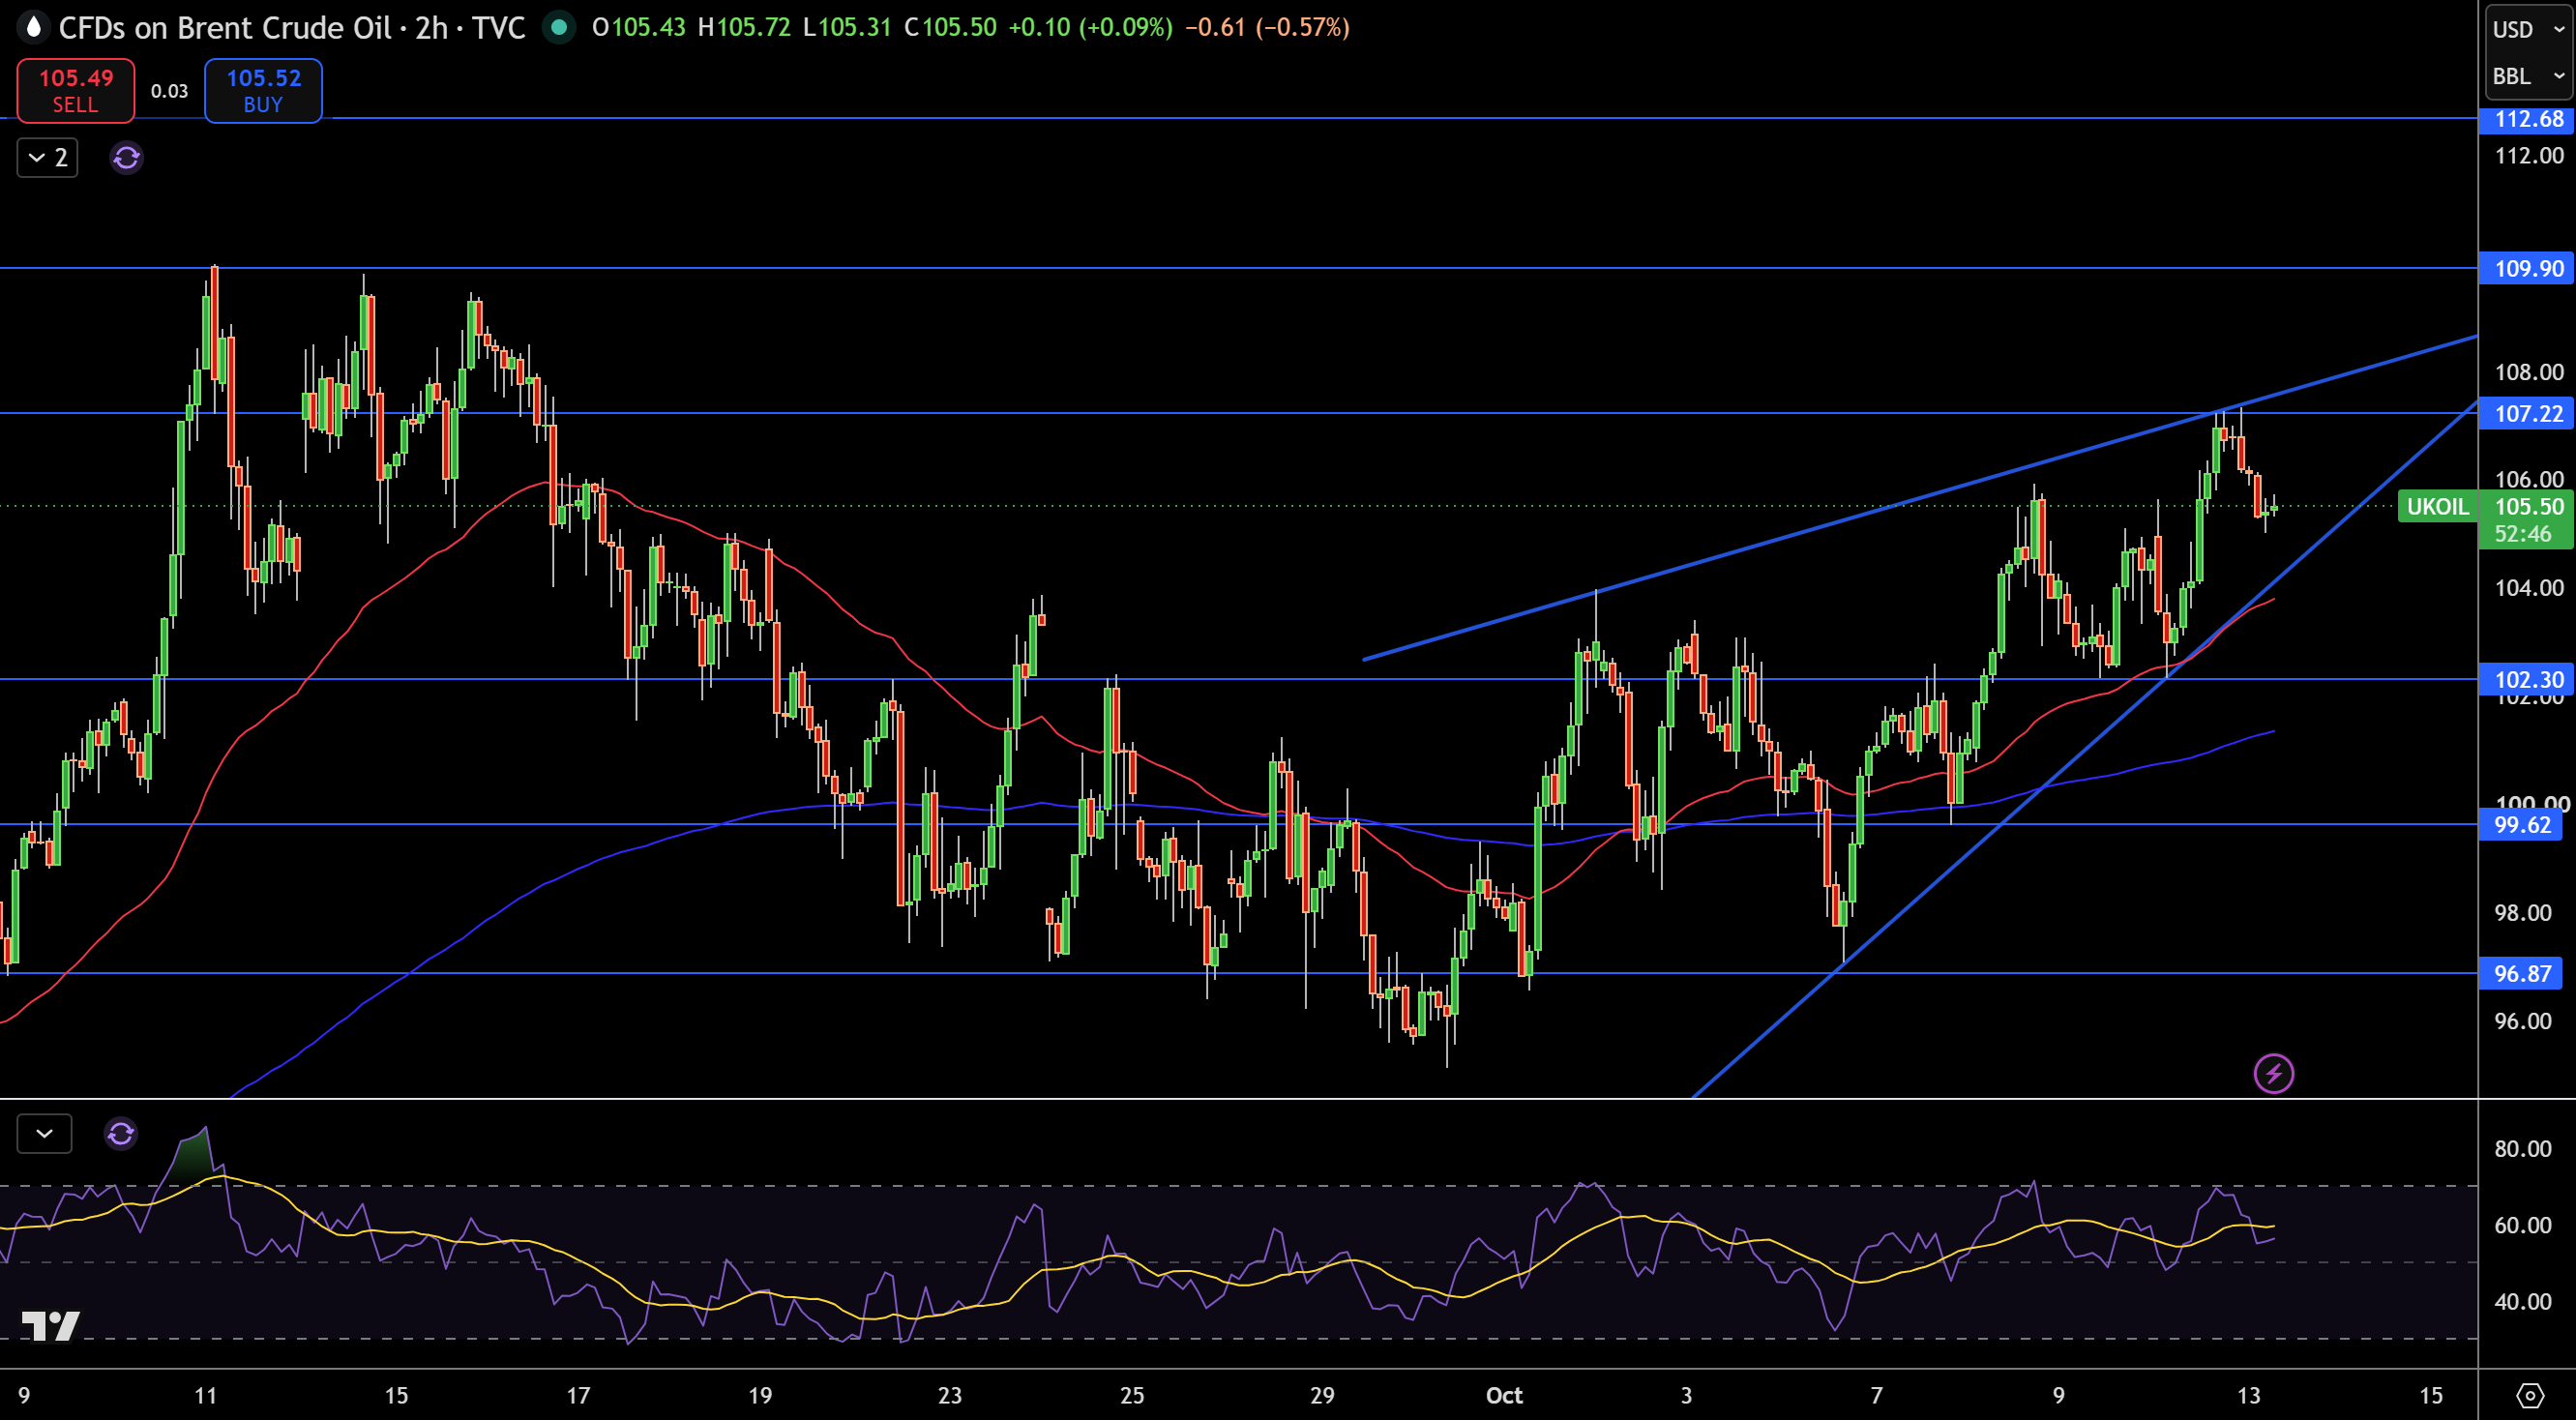
The 2-hour chart for Brent crude shows a price of around $105.50. Price has maintained its more recent higher lows sequence.
Also notable is the fact that price is comfortably above both moving averages as well as the rising support trendline. The recent dip from the $107 area has not altered the bigger bullish scenario.
The first target I am watching is $107.22. A break above that level would expose $109.90 and then $112.68. Support is situated at $102.30, $99.62 and $96.87.
RSI is above the 50 line. I am bullish while $102.30 and the rising trendline are holding. A close above $107.22 would be more bullish for the $109.90 area, and a close below $102.30 would be more bearish.