Bullish Pennant Breakout Gains Momentum
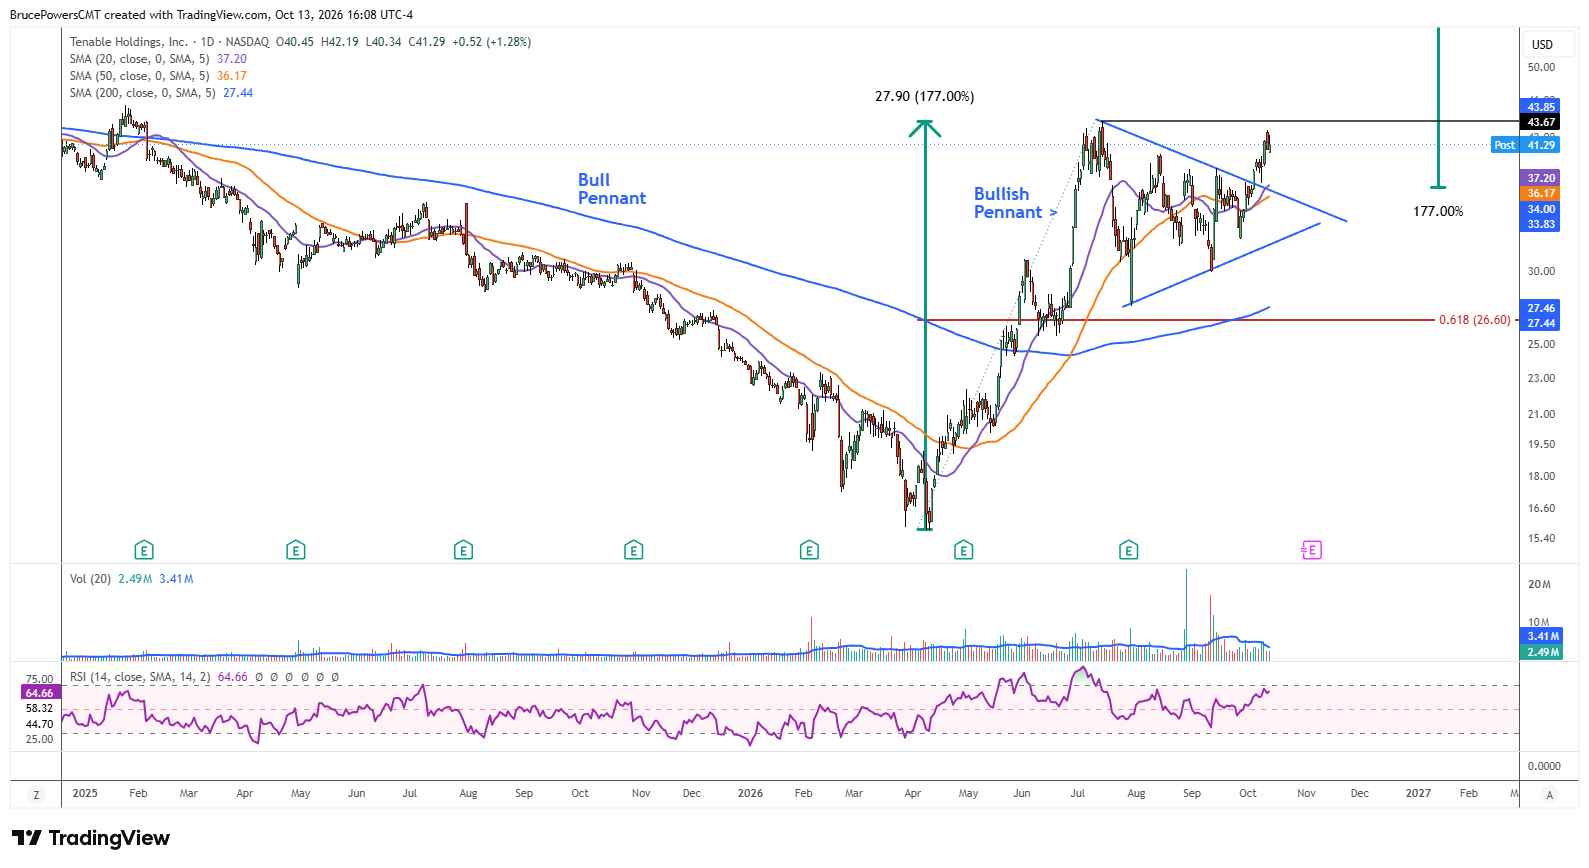
Tenable Holding, Inc. (TENB), a cybersecurity company, signaled a bullish continuation with an upside breakout from a pennant pattern last week, on a rally above the week’s high. The bullish continuation signal was accompanied by the highest volume in three weeks and followed the convergence of the 20-day and 50-day moving averages prior to the breakout. As the price range narrowed, the moving averages came together, reflecting the compression of price action also evident in the small symmetrical triangle that defines the pennant. During this consolidation buying and selling pressure converge before a breakout signals the next potential directional move.

Long-Term Breakout Adds Conviction
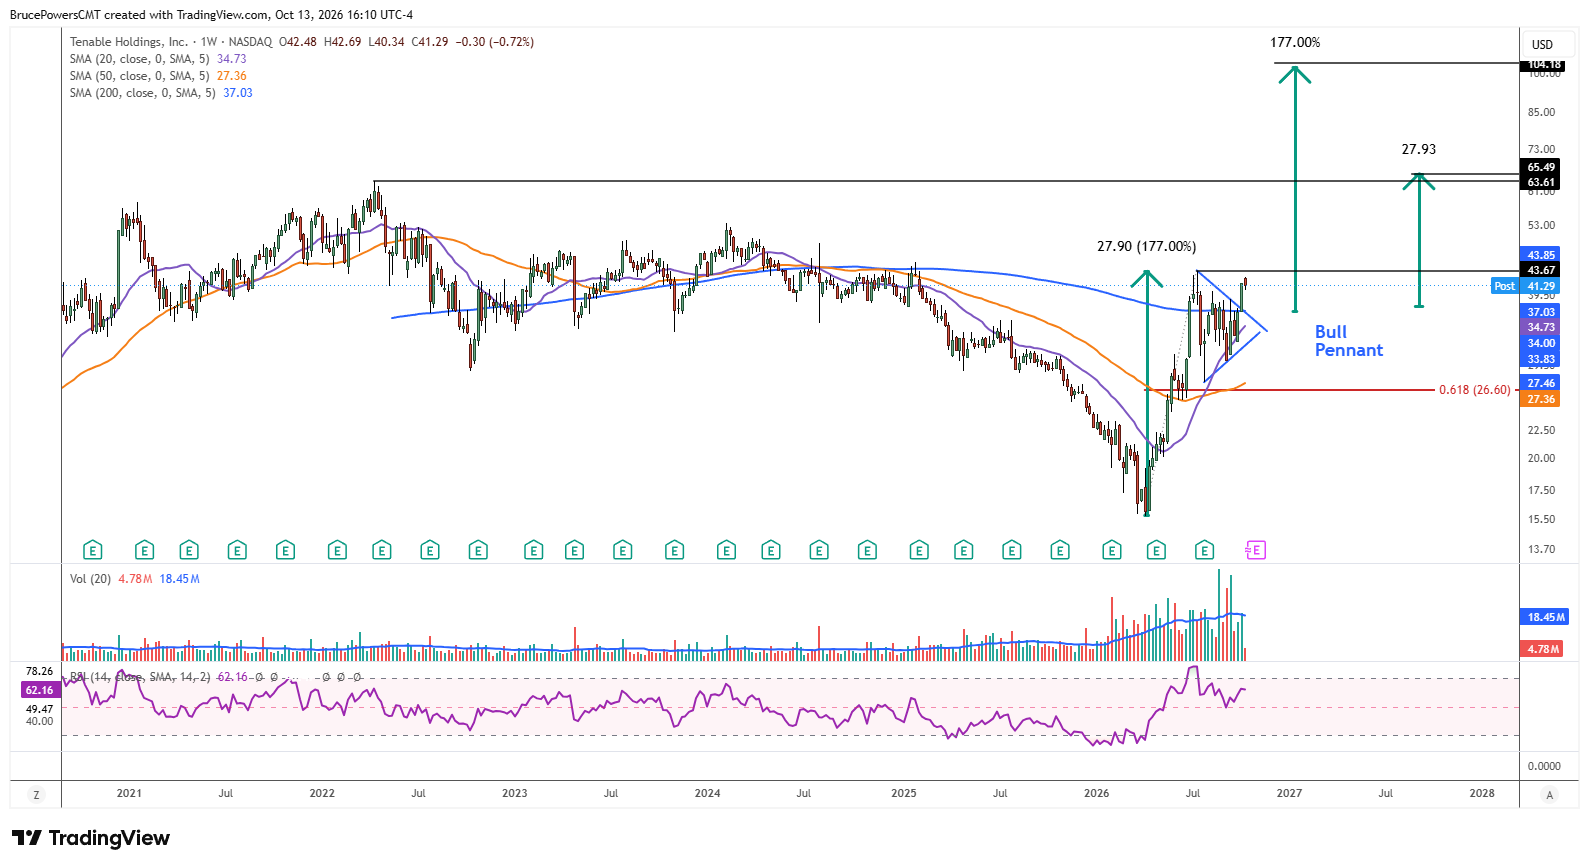
The pennant formed during a bearish correction that followed the July peak of $43.67. At that high TENB was up 177% from the trend low of $15.73 in April. Last week’s breakout was decisive, with the significance of the signal enhanced by the concurrent reclaim of the 200-week moving average. Notably, the 200-week moving average was near the same price level during the breakout week, adding confluence to the bullish signal.
Record High in Sight, With Higher Targets Ahead
Together, these developments provide two meaningful bullish signals and suggest buyers could remain in control as TENB advances toward higher resistance targets. A classic measuring objective based on the pennant’s preceding advance points to possible upside targets near $65.47 or $104.18. The record high of $63.61 is also an eventual upside target. The first target near $65.47 is particularly notable because it aligns closely with the prior record high, creating an important potential resistance zone.
Support Levels That Could Preserve the Breakout
For now, investors will be watching for the first pullback following the pennant breakout to identify potential trend-continuation opportunities. Areas to watch for support during weakness include a recent resistance shelf near $38.89 and the pennant breakout level of $37.53. A sustained dip below the 50-day moving average near $36.17 could be a cause for concern, as it would put TENB back inside the pennant’s consolidation range and weaken the breakout signal. Holding above these support levels would help preserve the bullish setup and keep the higher price targets in focus.
If you’d like to know more about technical analysis and how traders use it, please visit our educational area.