Sellers Maintain Control Below Moving-Average Resistance
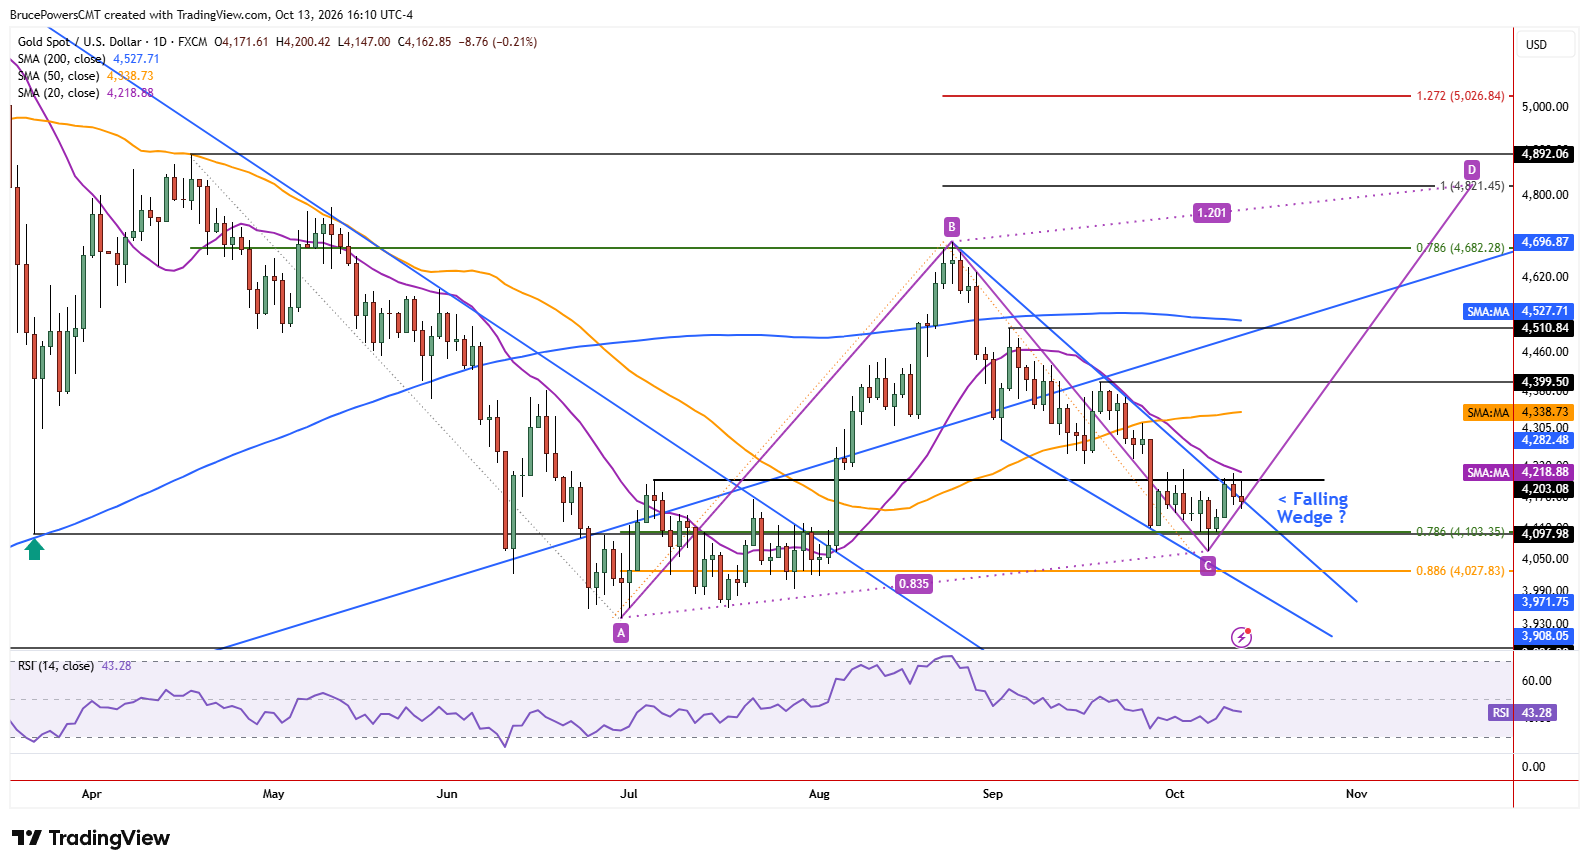
Gold began the week with a slight advance to test resistance near the 20-day moving average, now around $4,219, before sellers took back control and drove prices lower. That resulted in a loss for the day and a weak close in the lower half of the day’s range. Sellers remained in control on Tuesday, with a lower daily high of $4,200 and a lower daily low of $4,150. At the time of writing, trading remains near the low of the day and could extend lower. A close in the lower third of the day’s range appears likely, which would reinforce the short-term bearish indications.

Consolidation at a Critical Crossroads
Monday’s advance also failed to recover the recent minor lower swing high of $4,226, which marks a key level in the declining trend structure and the top of an 11-day consolidation range. That range could eventually form a base for a renewed advance. Alternatively, a break below the corrective low of $4,066 would signal a continuation of the bearish trend. The 20-day moving average’s decline toward the lower portion of the consolidation range highlights the risk of further downside. If a break below $4,066 occurs then the 88.6% Fibonacci retracement of the prior advance at $4,028 becomes a target, followed by the June low of $3,942.
$4,226 Marks the Bullish Reversal Threshold
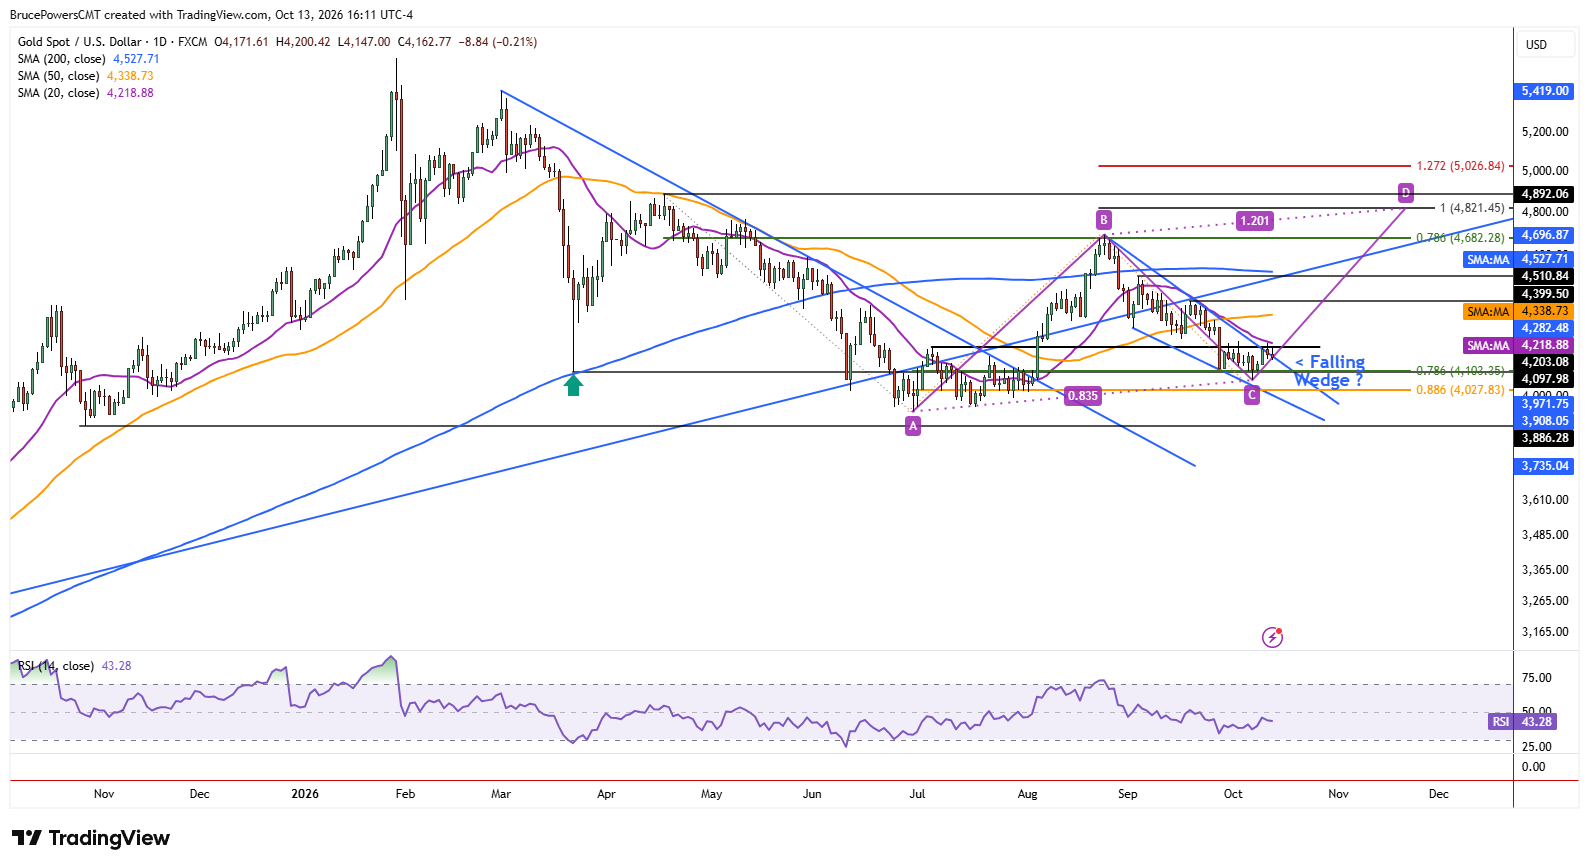
So far, this week’s price action has preserved the bearish trend structure. However, since the 20-day moving average has now fallen below the top of the range at $4,226, a bullish reversal signal above that high will also confirm a reclaim of the 20-day moving average. That average is a key dynamic resistance indicator for the short-term trend, especially since it has acted as resistance several times during short-term rallies in the decline from the August peak of $4,697, which began the current decline.
Falling Wedge Offers an Alternative Path Higher
Alternatively, the bearish correction from the August peak of $4,697 formed a falling bullish wedge pattern. Monday’s advance was an initial upside breakout attempt that has failed so far. A move above $4,226, however, would strengthen the bullish case by signaling a wedge breakout, confirming a bullish reversal, and reclaiming the 20-day moving average. Initial upside targets in this bullish scenario would be $4,400, $4,511, and $4,697. These upside levels would become relevant if buyers overcome the resistance that has contained recent rallies, potentially marking a transition from the current bearish structure to a renewed advance.
If you’d like to know more about how to trade gold and silver, please visit our educational area.