Bullish Reversal Signals Strengthen Outlook
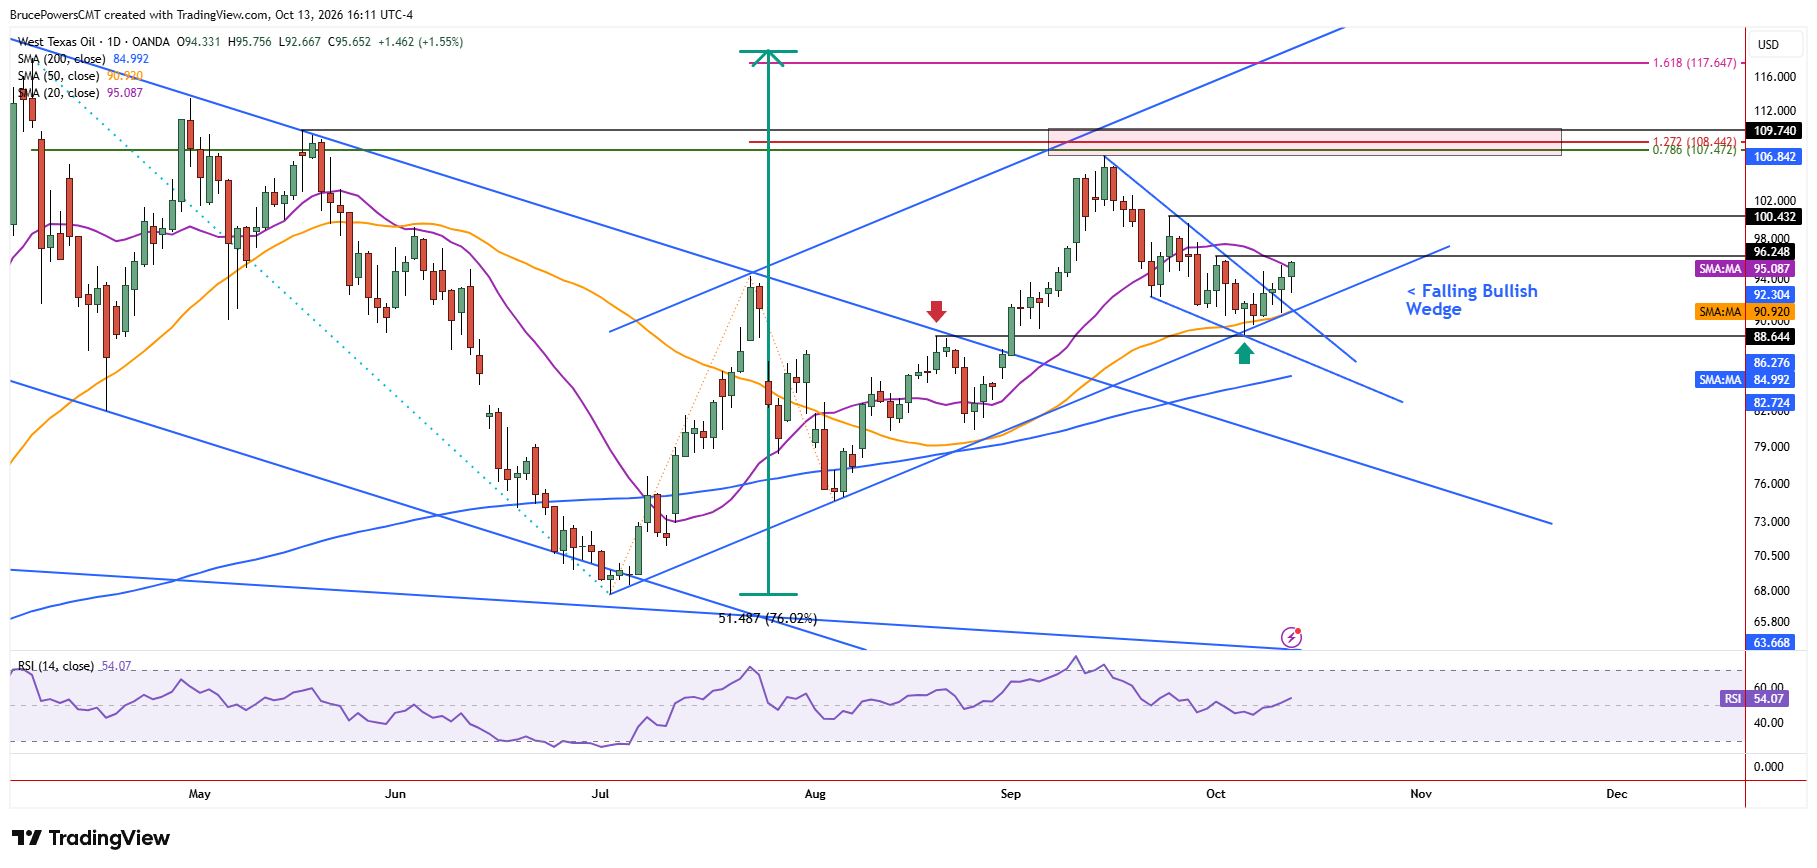
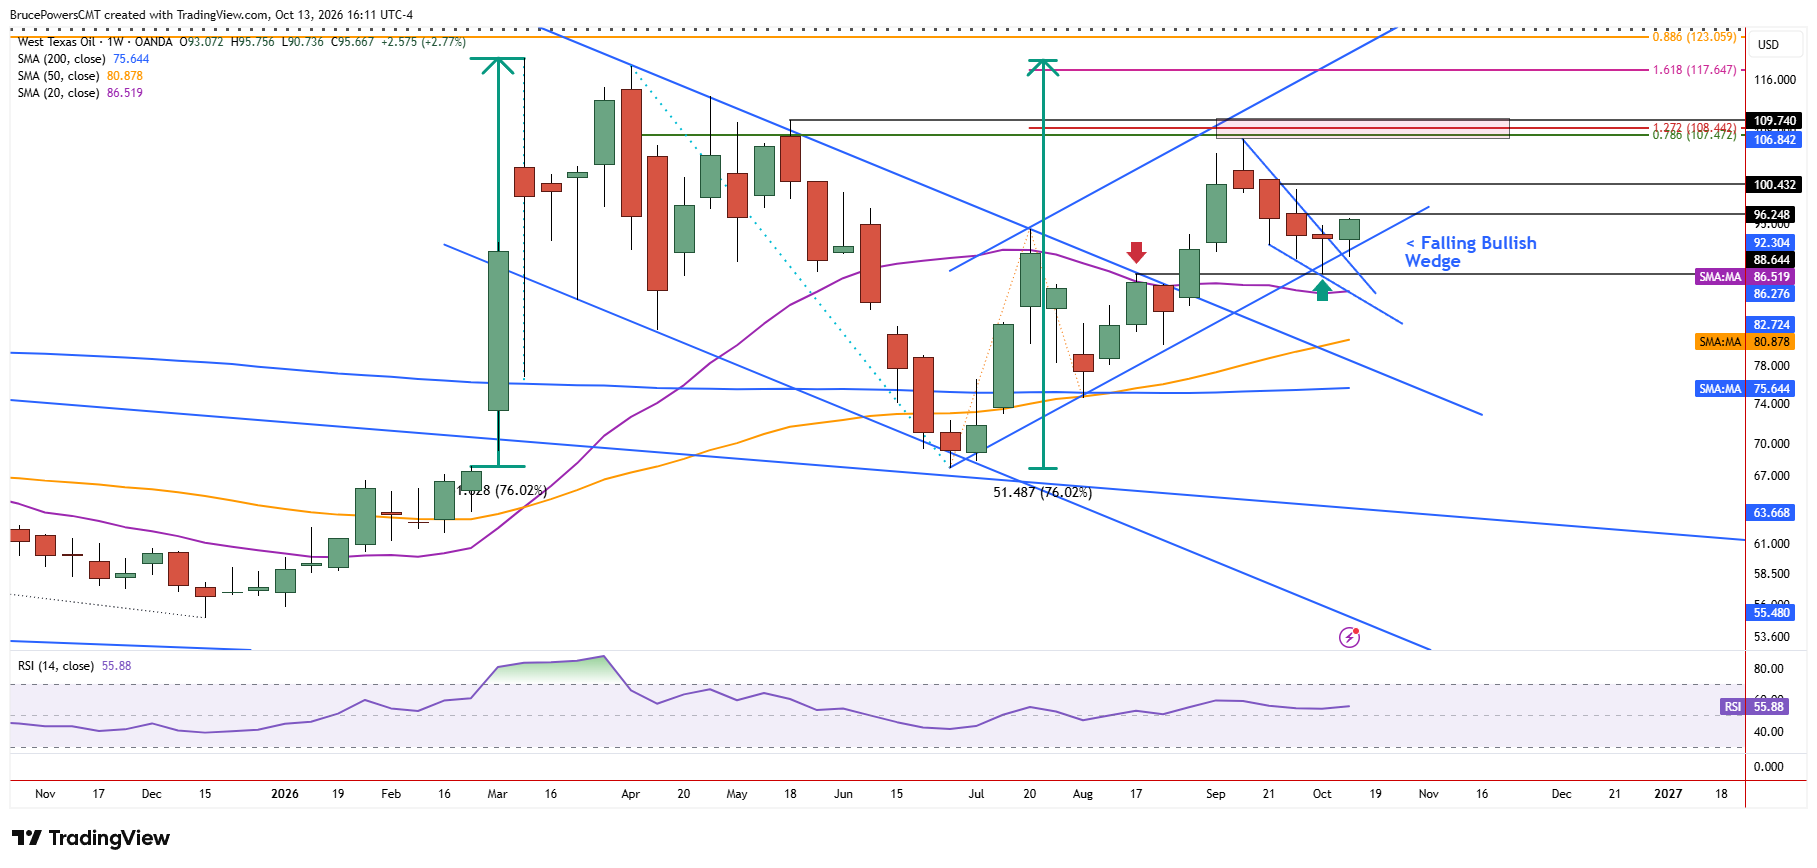
WTI crude oil triggered a one-week bullish reversal signal on Monday, moving above the prior week’s hammer candlestick and signaling the potential completion of the bearish correction and start of another leg higher in the broader advance. That indication of strength followed Friday’s upside breakout from a falling bullish wedge pattern. The combination of these two trend reversal signals strengthens the bullish outlook and raises the potential for an acceleration in momentum if further strength is confirmed.

Support Confluence Backs Recovery
The confluence of support indicators near last week’s higher swing low of $88.66 reinforces the bullish case and suggests the correction may have ended. Support at the low was reinforced by the 50-day moving average, the lower boundary of a rising channel, and a prior resistance level that appears to have switched to support.
Key Resistance Stands Between Crude and Further Gains
Although momentum since the breakouts has been muted so far, that could change quickly upon further evidence of strength. The 20-day moving average, now near $95.05, was tested as resistance on both Monday and Tuesday, while Monday’s high of $95.44 defines key near-term structural resistance. Tuesday’s session is currently on track to remain within Monday’s range, potentially forming an inside day that reflects consolidation. If the 20-day moving average is reclaimed, a move above the recent interim lower swing high of $96.25 would provide an additional bullish reversal signal, further strengthening the case for a renewed advance.
Initial Resistance Zone Near $110
An initial upside target zone extends from $106.84 to $109.74, defined by the confluence of several indicators. These include the recent swing high of $106.84, which marks the upper boundary of the wedge pattern, and the May interim lower swing high of $109.74. However, since crude oil is progressing within a relatively well-defined trend channel, a sustained advance could eventually carry prices above this initial resistance zone.
Measured Move Points Toward $119
A simple measured-move projection based on the sharp March advance following an earlier breakout from a large falling wedge pattern points to a potential target near $119. That advance amounted to approximately 76% in just six days. Applying a similar percentage gain to the July higher swing low of $67.73 produces a comparable target, suggesting that the broader bullish structure could support a substantial further advance if the current reversal signals receive further confirmation.
WTI Crude Oil Price Forecast
Every new WTI Crude Oil analysis as it publishes, today's technical signal and key levels, live price — on one page.
See all WTI Crude Oil forecastsIf you’d like to know more about what drives oil prices, please visit our educational area.