


Gold (XAU) trades near $4,160 an ounce in Asian trading on Wednesday, while silver (XAG) remains weak near $59. The market is now waiting for the US CPI report on Wednesday, with an 88% chance of a rate hike by the Fed in December. The US dollar index eased to around 102.16 on Wednesday after retreating from an 18-month high.
The market expects annual inflation to rise to 3.6% from 3.4%. A hotter reading could lift the US dollar and US Treasury yields and put fresh pressure on both metals. But the softer inflation could reduce the expectations for further tightening and give gold and silver room to recover.
The fresh developments in Saudi Arabia also keep energy prices in focus. Saudi authorities reported an attack on an Aramco administrative building that caused a limited fire. Brent crude oil rose to $109 on Wednesday as traders weighed the risk of supply against hopes for more exports of diesel from Russia.
In my view, further escalation could support demand for gold as a safe haven. However, high oil prices could also sustain inflation, raise expectations for higher interest rates and limit gains in both metals. The US producer price report on Thursday and remarks by the Fed Chair Kevin Warsh later this week could shift expectations for further rate hikes. This could influence the next move in gold and silver prices.

Gold Price Forecast: $4,100 Support and $4,250 Breakout in Focus
XAUUSD Technical Analysis: Triangle Support and $4,330 Resistance
The daily chart for spot gold shows that the price has been consolidating at the support of the triangle pattern for the past two weeks. The price reached a high at $4,217 on Monday and corrected lower again. A break below $4,100 this time will likely indicate a quick drop in gold prices towards the $4,000 area.\
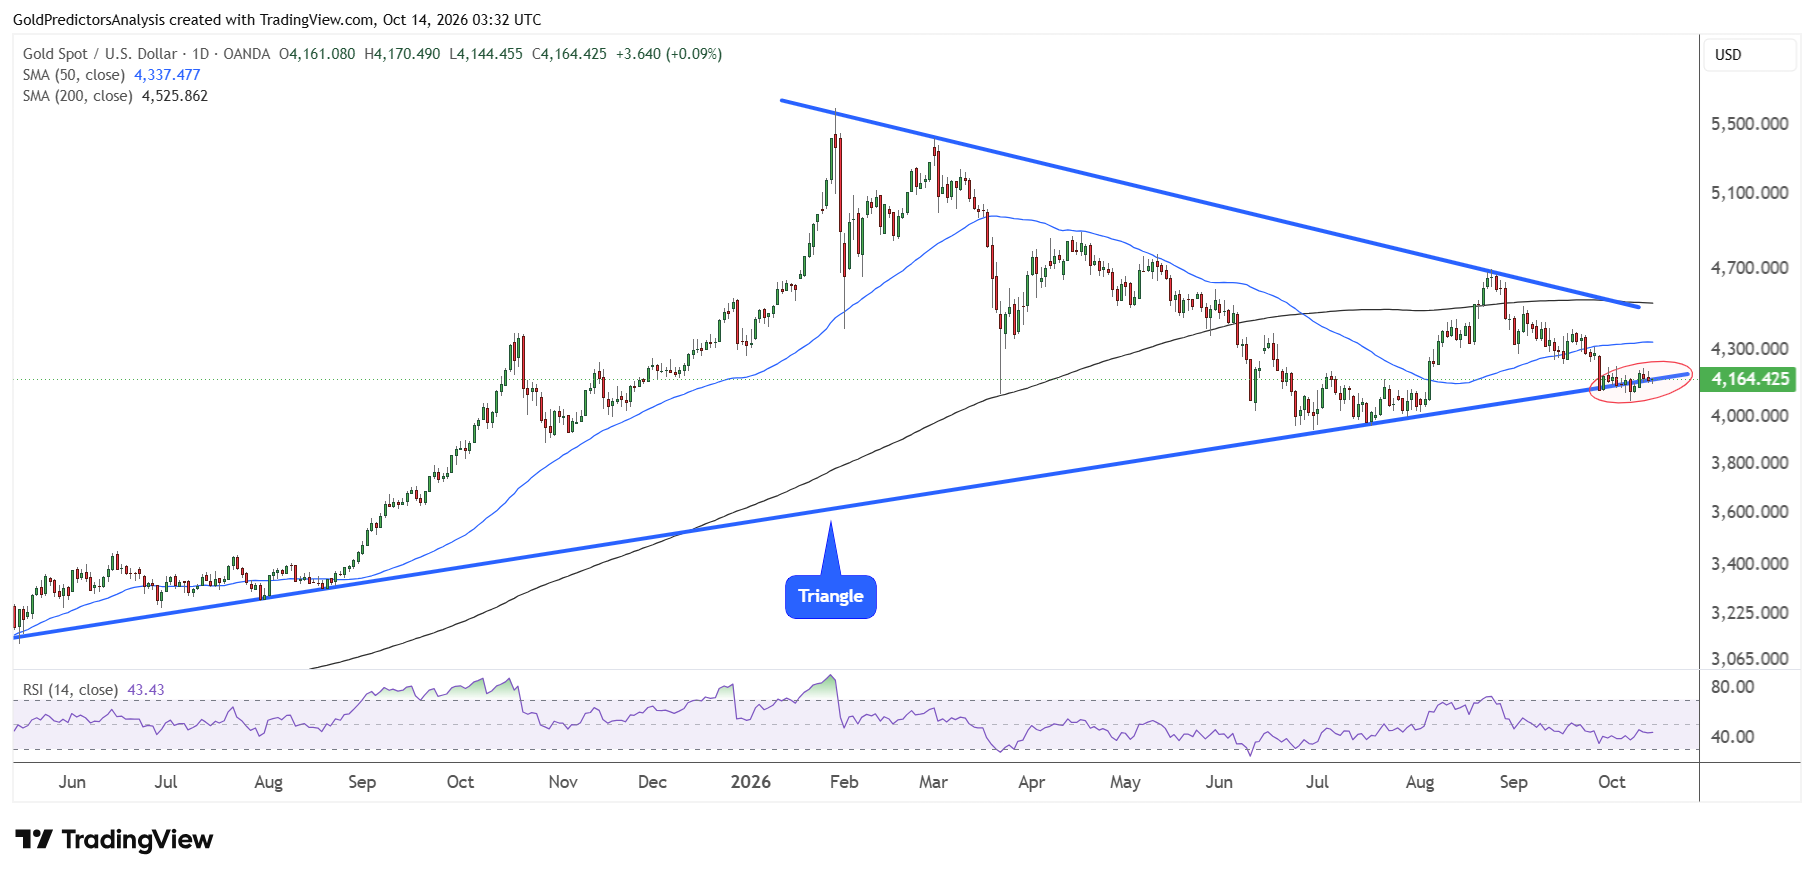
On the other hand, a recovery above $4,250 will likely indicate further upside towards the 50-day SMA near $4,330. A break above $4,330 will likely push prices towards the resistance of the triangle pattern in the $4,500 region.
The weekly chart for spot gold also shows that the price is consolidating near the ascending trend line that stretches from the October 2023 lows. If the gold price moves towards $4,000 and breaks lower this time, it will likely form bearish price patterns.
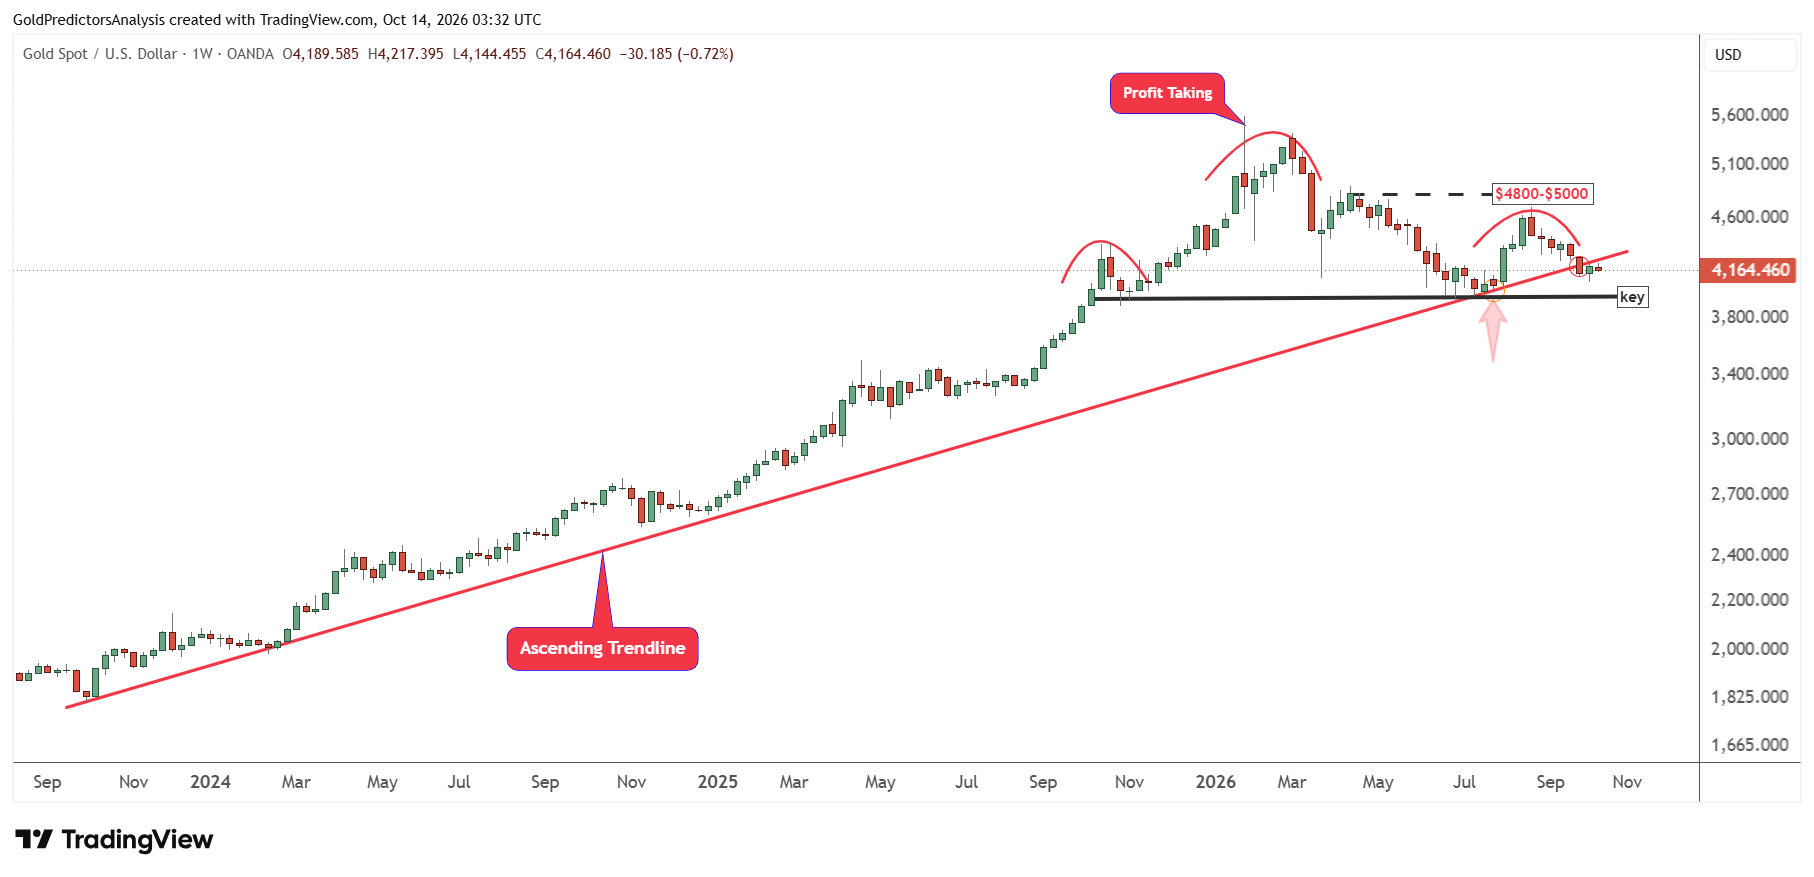
However, if prices recover above $4,330, it will indicate that they are preparing to move towards the $5,000 level. The price remains uncertain around this key support level as the market looks for the next move.
Gold Price Forecast
Every new Gold analysis as it publishes, today's technical signal and key levels, live price — on one page.
See all Gold forecastsShort-Term Gold Outlook: $4,205 Breakout Could Target $4,250
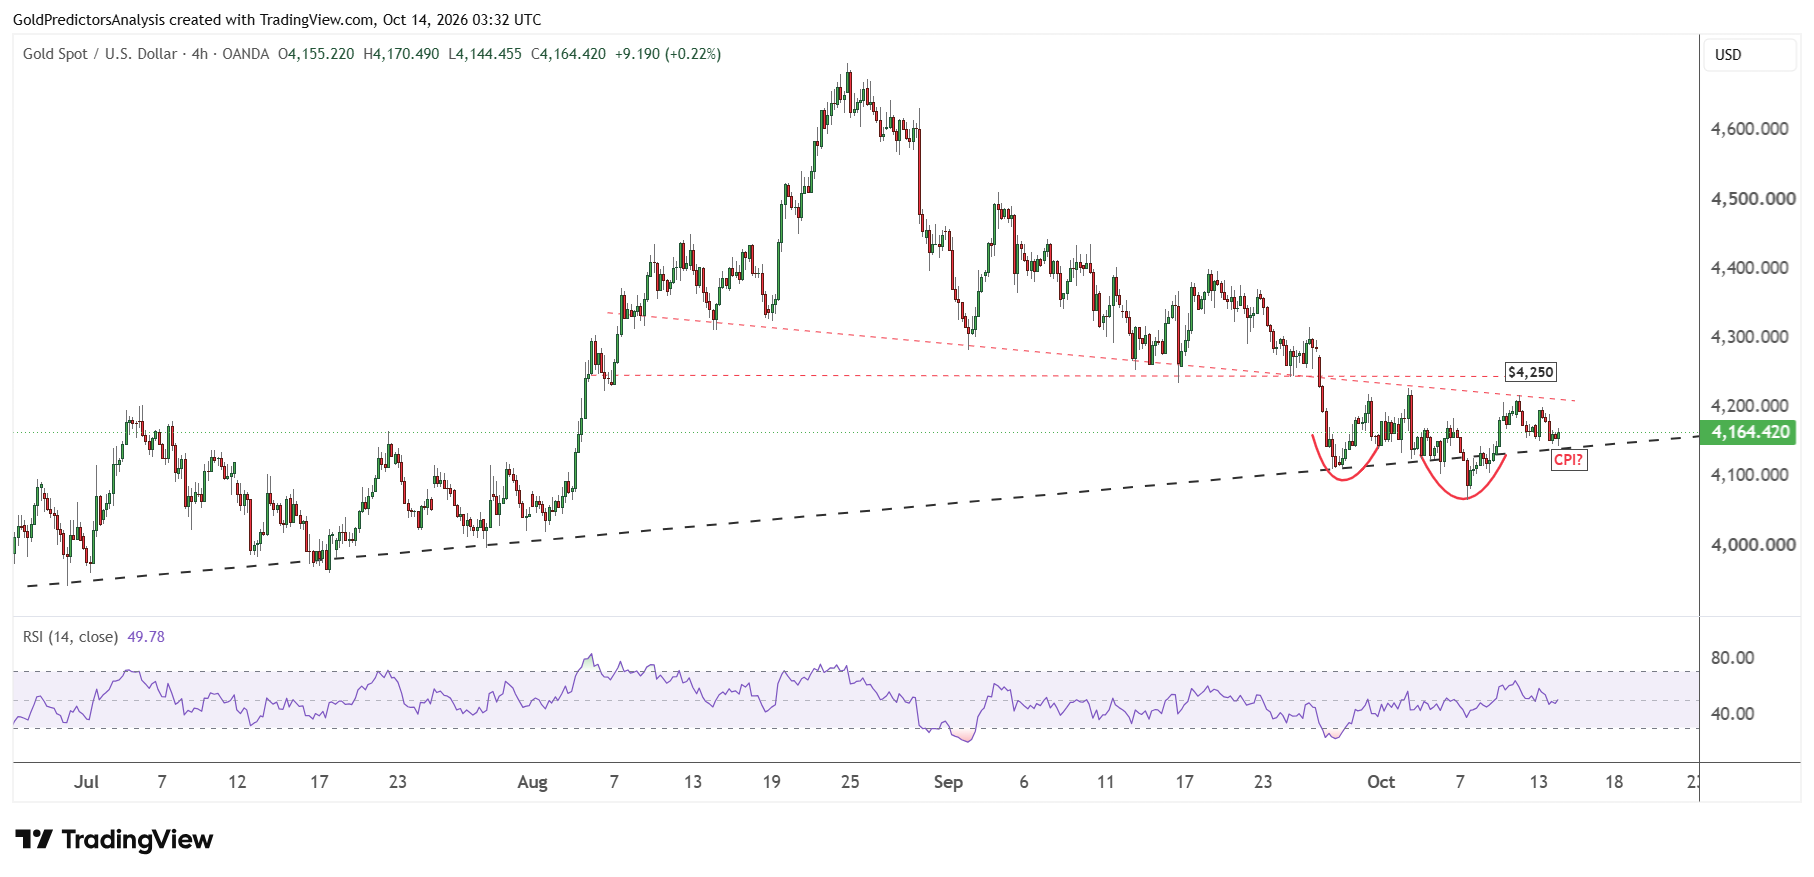
The 4-hour chart for spot gold also shows strong support at the ascending trend line that stretches from the June 2026 lows. The price is consolidating between the rising trend line and the downward trend line.
The immediate resistance for gold remains at $4,205 on Wednesday. A break above $4,205 will push the price towards $4,250. However, a break above $4,250 may complete the short-term bullish action and open the way for further upside.
Silver Price Forecast: $55 Support and $64 Resistance in Focus
XAGUSD Technical Analysis: $64 Breakout Could Target $72
The daily chart for spot silver also shows bearish price action in the short term. The price is consolidating near the edge of the triangle pattern, with immediate support in the $55-$56 area. A break below $55 will likely push prices towards the $50 zone.
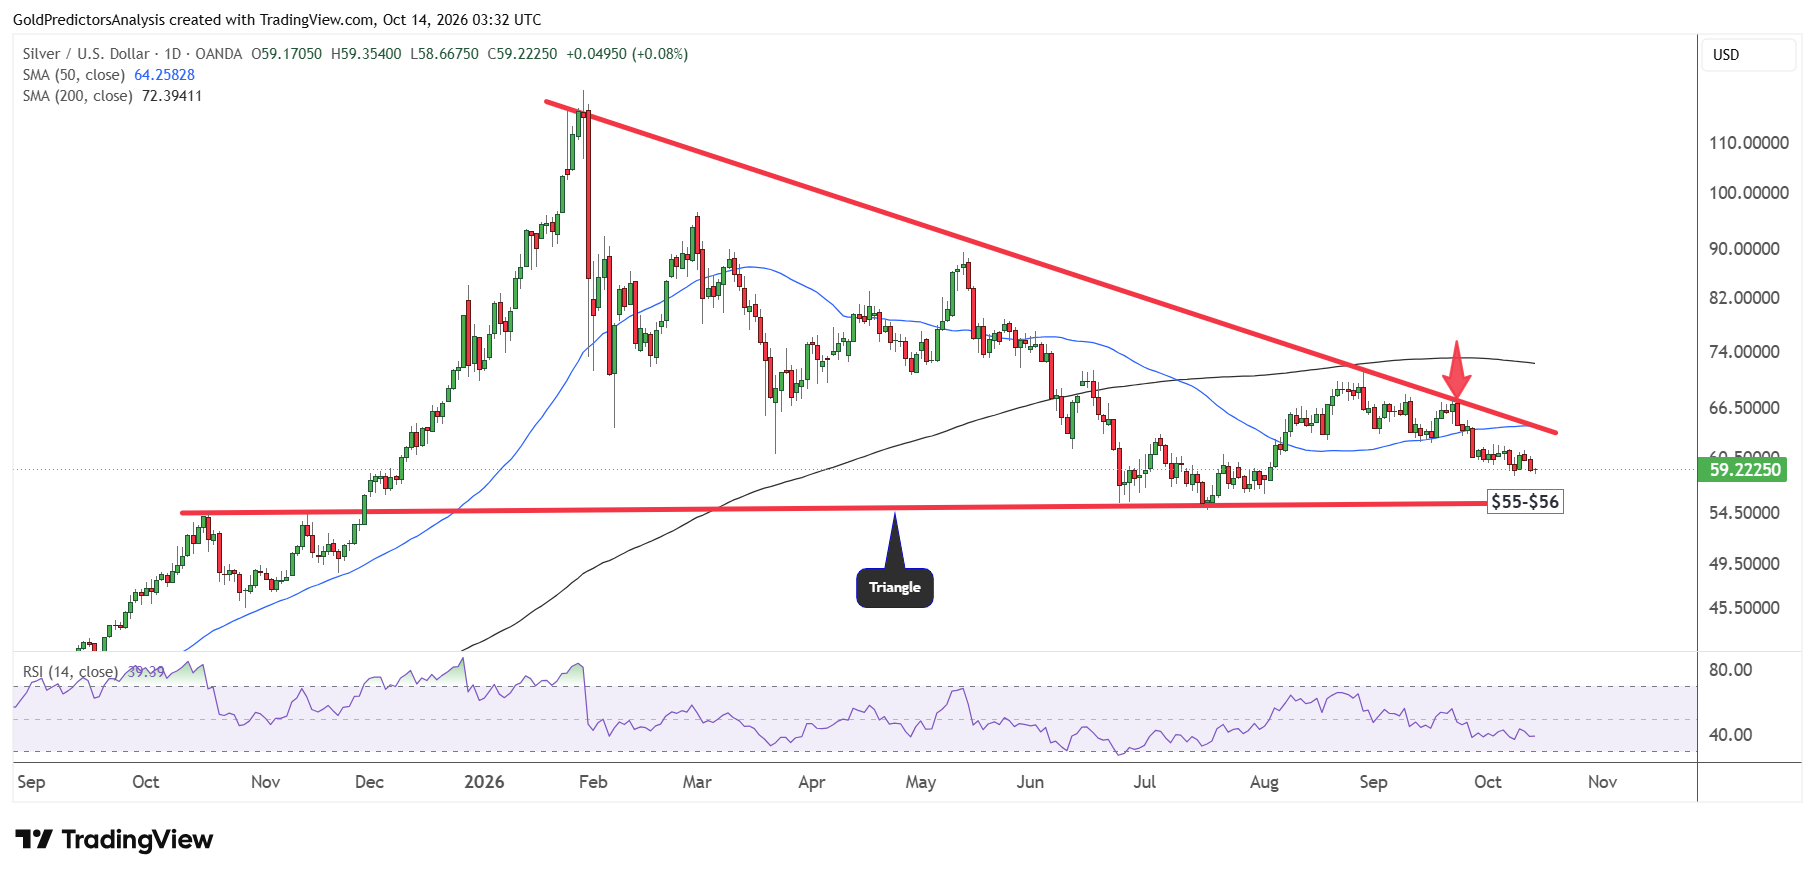
However, a break above the 50-day SMA near $64 will likely push prices towards the 200-day SMA near $72. The resistance of the triangle now remains at the 50-day SMA. A break above this level will likely trigger a strong rally in the silver market.
Short-Term Silver Outlook: $61.20 Breakout Could Target $62.60
The 4-hour chart for spot silver also shows that the price has been trading within the descending broadening wedge pattern between $61.20 and $57.80, which act as resistance and support, respectively.
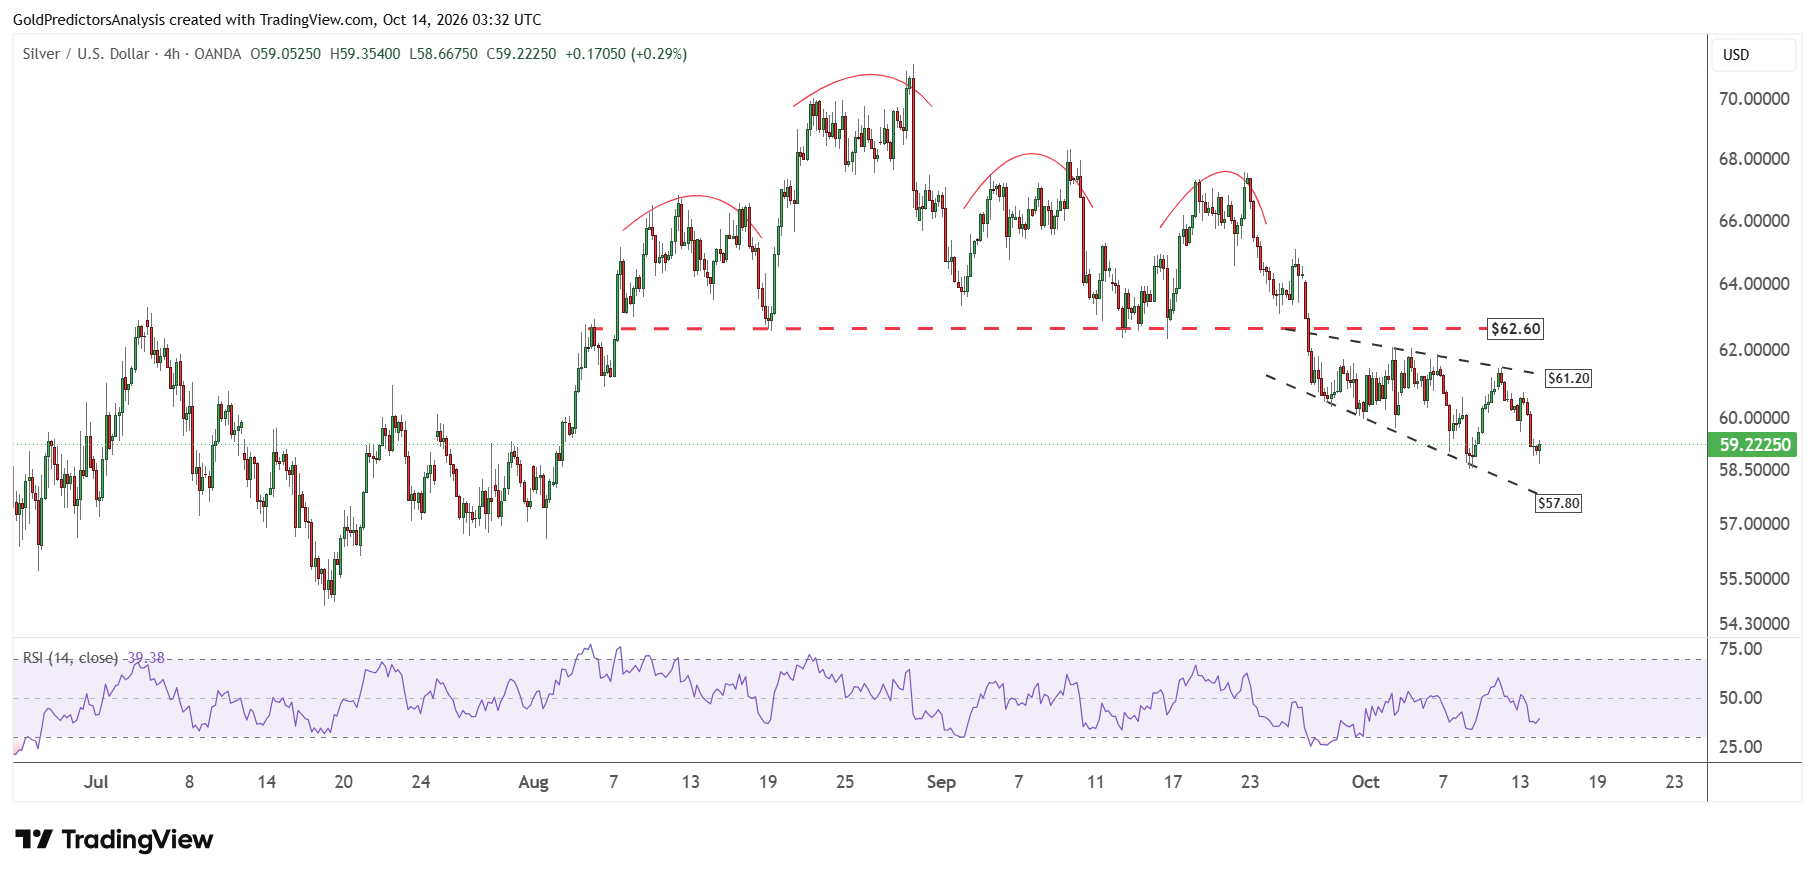
A break above $61.20 may push the price towards $62.60 in the short term. However, a break above $62.60 will open the way for a rally towards the $64 area in the short term. As long as the price remains below $72, the possibility of further downside in silver remains high.
What Is Next for Gold and Silver Prices?
The US CPI report could shape the next move in gold and silver prices. The hot inflation could lift the dollar and Treasury yields and add pressure to both metals. But the softer data could ease those pressures and support a recovery.
Gold needs to break above $4,250 to strengthen the rebound. Silver needs to clear $61.20 before $62.60 comes into view. A break below $4,100 in gold could bring $4,000 into focus. Silver could fall towards $50 if support at $55 fails. In my view, both metals remain vulnerable until buyers clear the nearby resistance levels.


