



Dollar Index: CPI Becomes the Test for Fed Patience
In the lead up to U.S. inflation data for September, the fundamental outlook for the U.S. dollar softened as the market reassessed the need for further Fed tightening. According to the August reading, headline CPI rose 0.4% from the previous month and 3.4% on a year over year basis. For September, the median estimate of economists is for an annual increase of 3.6% from a year ago, with the month over month increase estimated at 0.6%. Market participants now place a 77% likelihood for the Fed to keep rates unchanged at the October meeting, up from 51% last month. New York Fed President John Williams is still looking for one additional hike this year, keeping December in play.

EUR: Lagarde Tells France Fiscal Solution Must Come From Paris
The euro is still stuck between a restrictive ECB and a deteriorating French fiscal situation. ECB President Christine Lagarde has previously warned against proposals for the central bank to cancel French debt, dampening hopes that the central bank would step in to bolster French bonds.
The ECB has already hiked rates twice in the last four months, with a third hike possible in December. The IMF has warned that elevated borrowing costs underline the need for fiscal consolidation. Meanwhile, ECB policymakers are closely monitoring wage developments for indications of second-round effects of inflation.
GBP: BoE Tightening Case Strengthens, but Budget Risk Lingers
While the fiscal policy backdrop in the UK still presents risk from the upcoming October 28 budget, the recent hawkish shift from the BoE has opened up a strong differential case from other central banks. With energy costs still high and squeezing profit margins, BoE Governor Andrew Bailey said firms are prioritizing cost cutting which may feed through to lower staffing levels and lower wage growth. Markets are expecting a 25 basis point hike from the BoE next month despite the bank keeping rates on hold since the start of the Iran conflict.
U.S. Dollar Index Technical Analysis: DXY Slips Below Rising Trendline as 101.93 Support Comes Into Focus
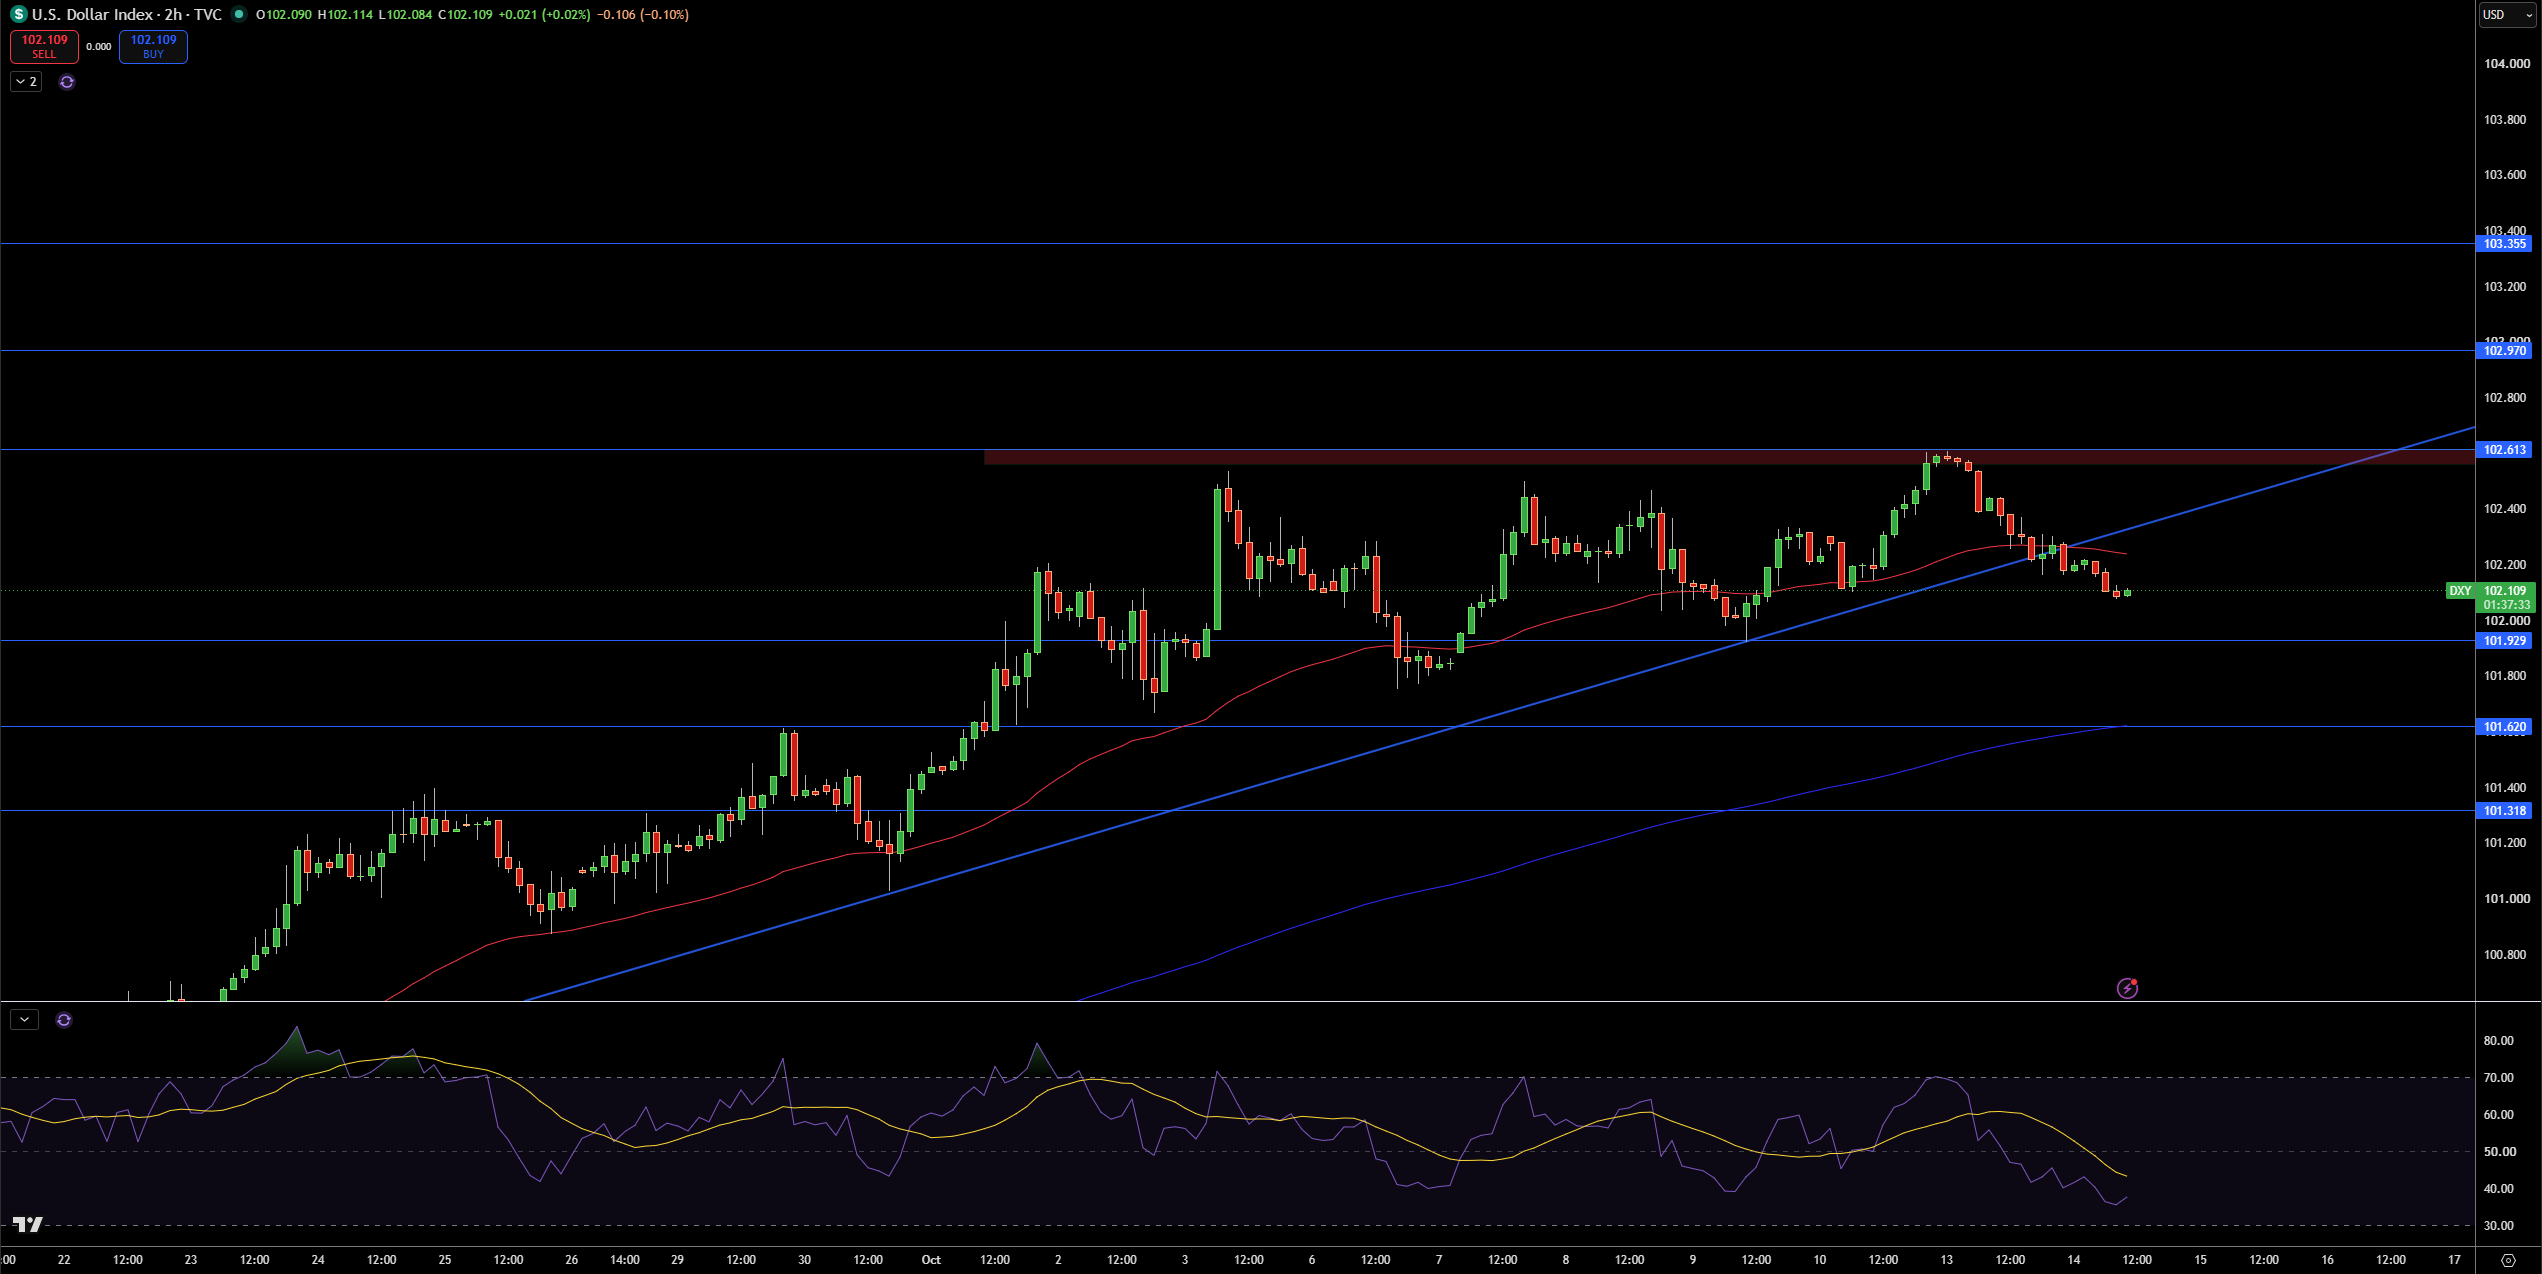
The US Dollar is currently hovering around 102.11 according to the 2 hr chart, and pulled back from 102.61. What I find interesting is that price is currently trading below the rising trend line, and currently testing the short term moving average zone. The larger trend is still bullish as the DXY is still trading above the longer term moving average, however the shorter term trend is now moving sideways.
EUR/USD Price Forecast
Every new EUR/USD analysis as it publishes, today's technical signal and key levels, live price — on one page.
See all EUR/USD forecasts101.93 is the first level of support that I am looking at. A breakdown below this level would target 101.62 and then 101.32. If the dollar bulls are still in control, the first target of resistance would be at 102.61, with 102.97 and 103.36 being the levels to watch if this is broken.
RSI is currently in the lower half of its range and is showing a slowing in the bullish trend. I am neutrally biased with a slight bearish bias as long as DXY is trading below the rising trend line. I would look for a close above 102.61 to validate a bullish move, and a close below 101.93 to validate a move toward 101.62.
GBP/USD Technical Analysis: Sterling Breaks Trendline as 1.3284 Becomes the Next Upside Test
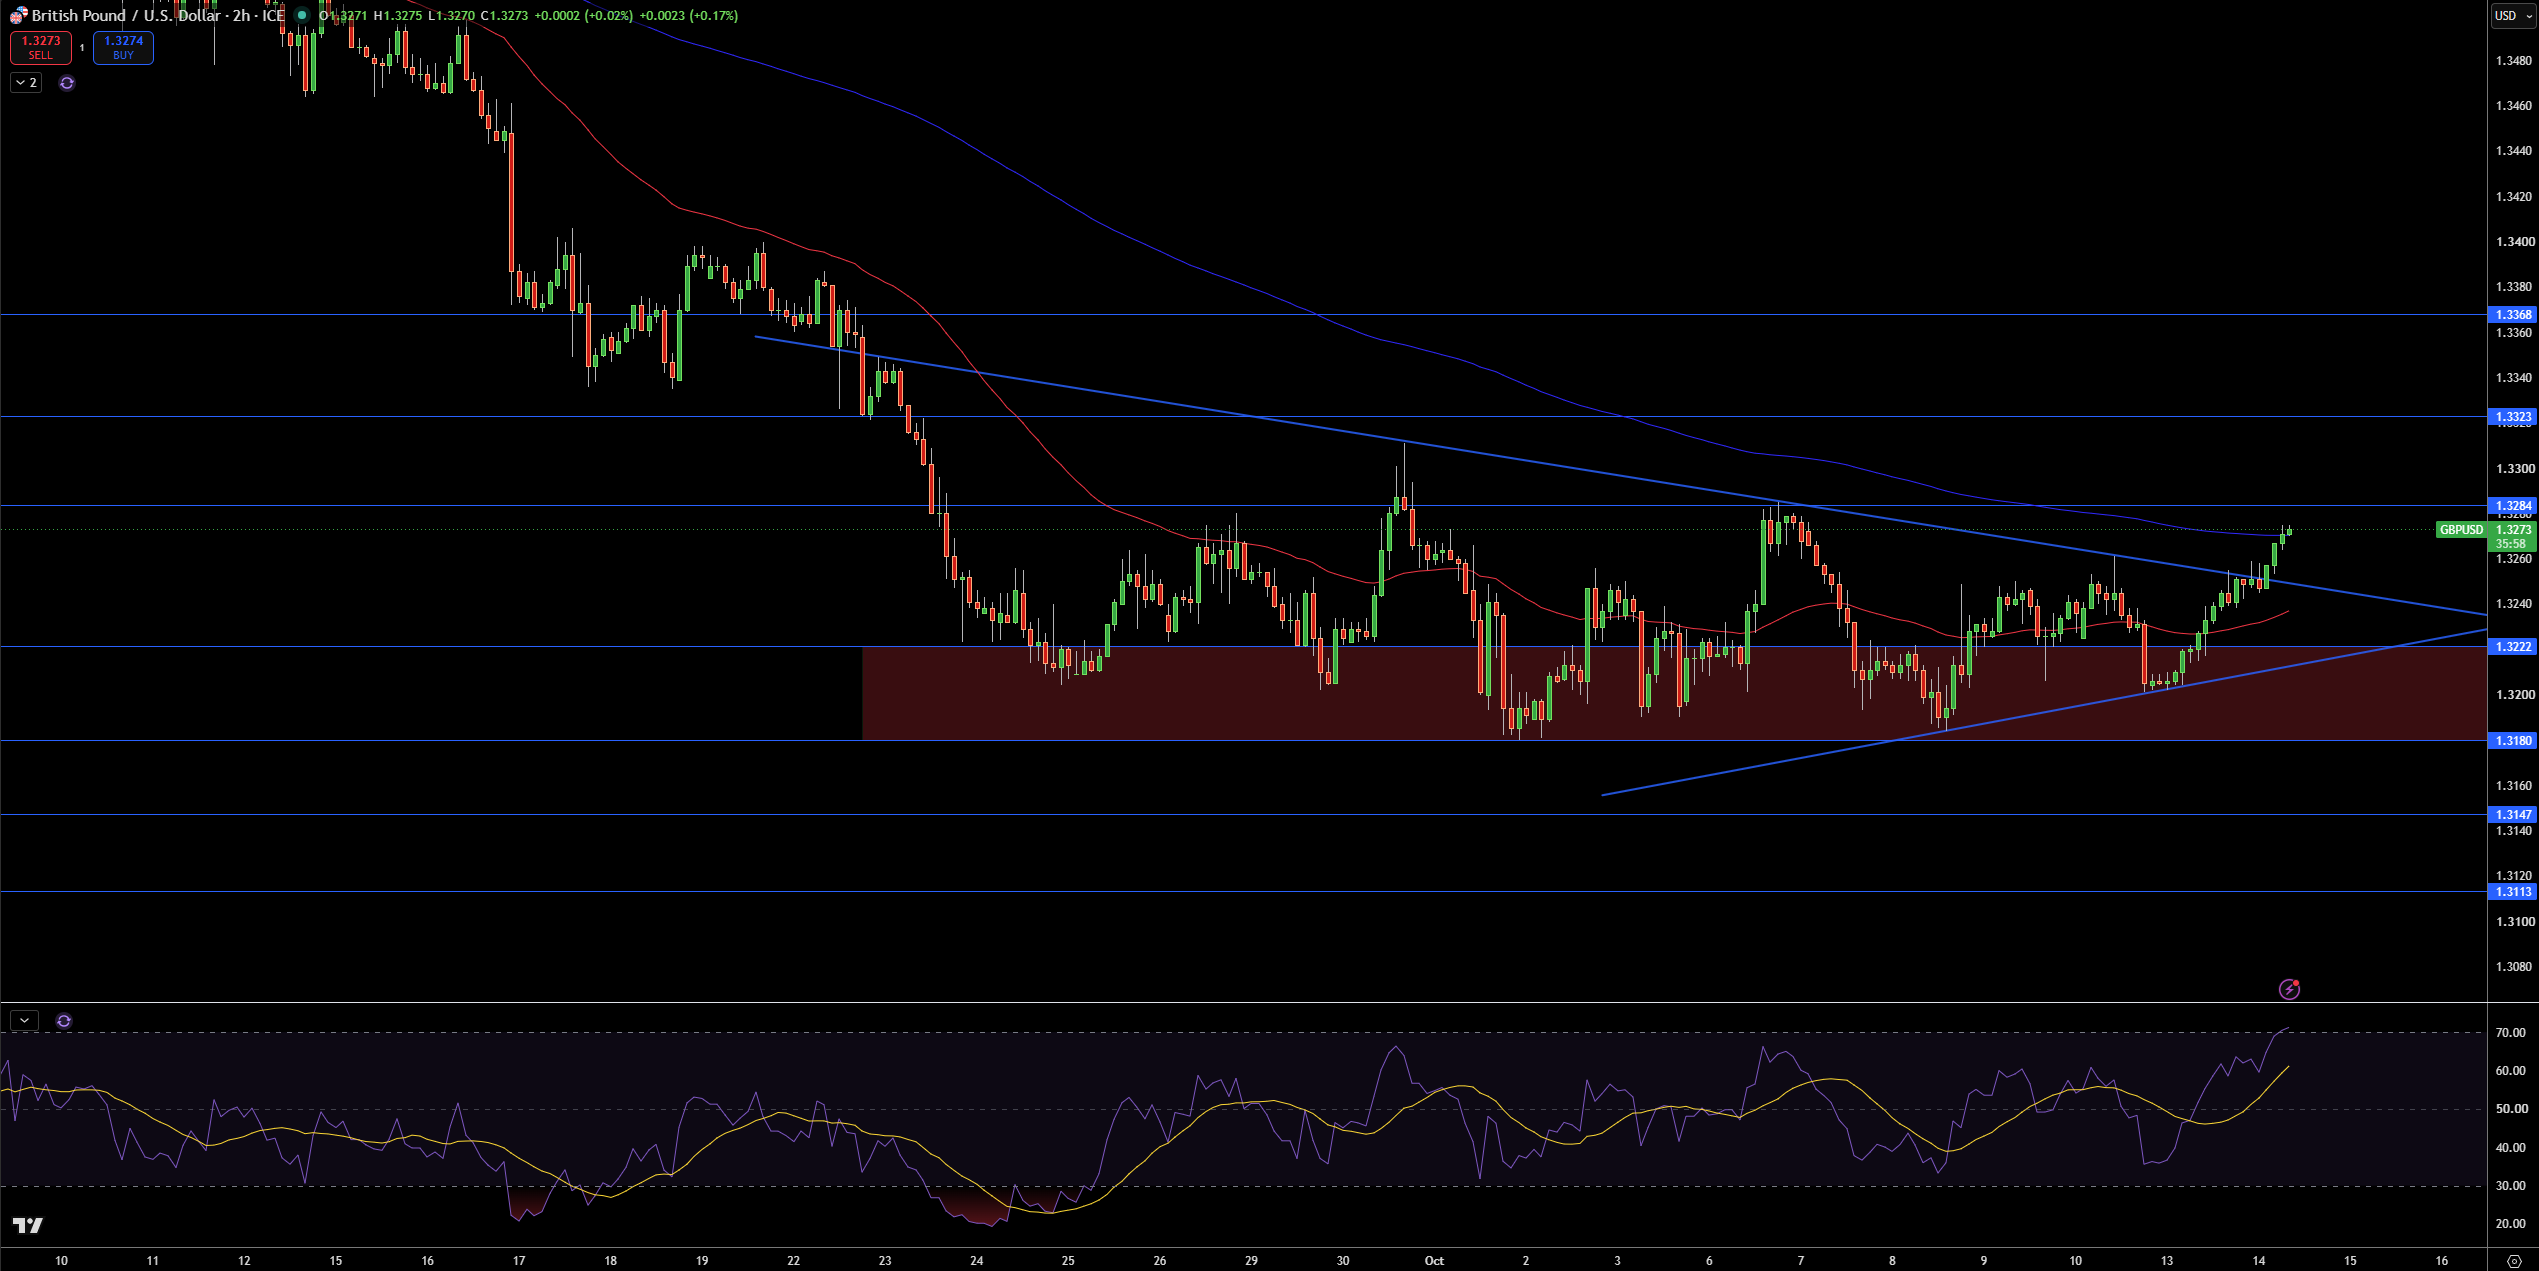
The GBP/USD pair is currently trading at 1.3273 after rallying and breaking above the descending trendline that had been limiting the pair’s upside movements. Another thing worth considering is price’s move back above the short-term moving average, and the fact that the pair remains well above the 1.3222 support area. Altogether, the above-mentioned developments have considerably improved the short-term structure.
In the near-term, I see the 1.3284 level as the next resistance area, with a break above it targeting the 1.3323 and 1.3368 levels respectively. A move to the downside could see price test the 1.3222 support area again, with the 1.3180, 1.3147, and 1.3113 levels coming into play should the breakout fail to materialize.
RSI has also moved toward the overbought region, confirming the bullish bias, however, the strength of the move suggests a correction may be due. I am bullish while the pair trades above the 1.3222 support and the descending trendline. A clean break above 1.3284 strengthens the case for a move to 1.3323, and a break below 1.3222 negates the breakout.
EUR/USD Technical Analysis: Euro Tests Descending Trendline as 1.1233 Becomes the Breakout Trigger
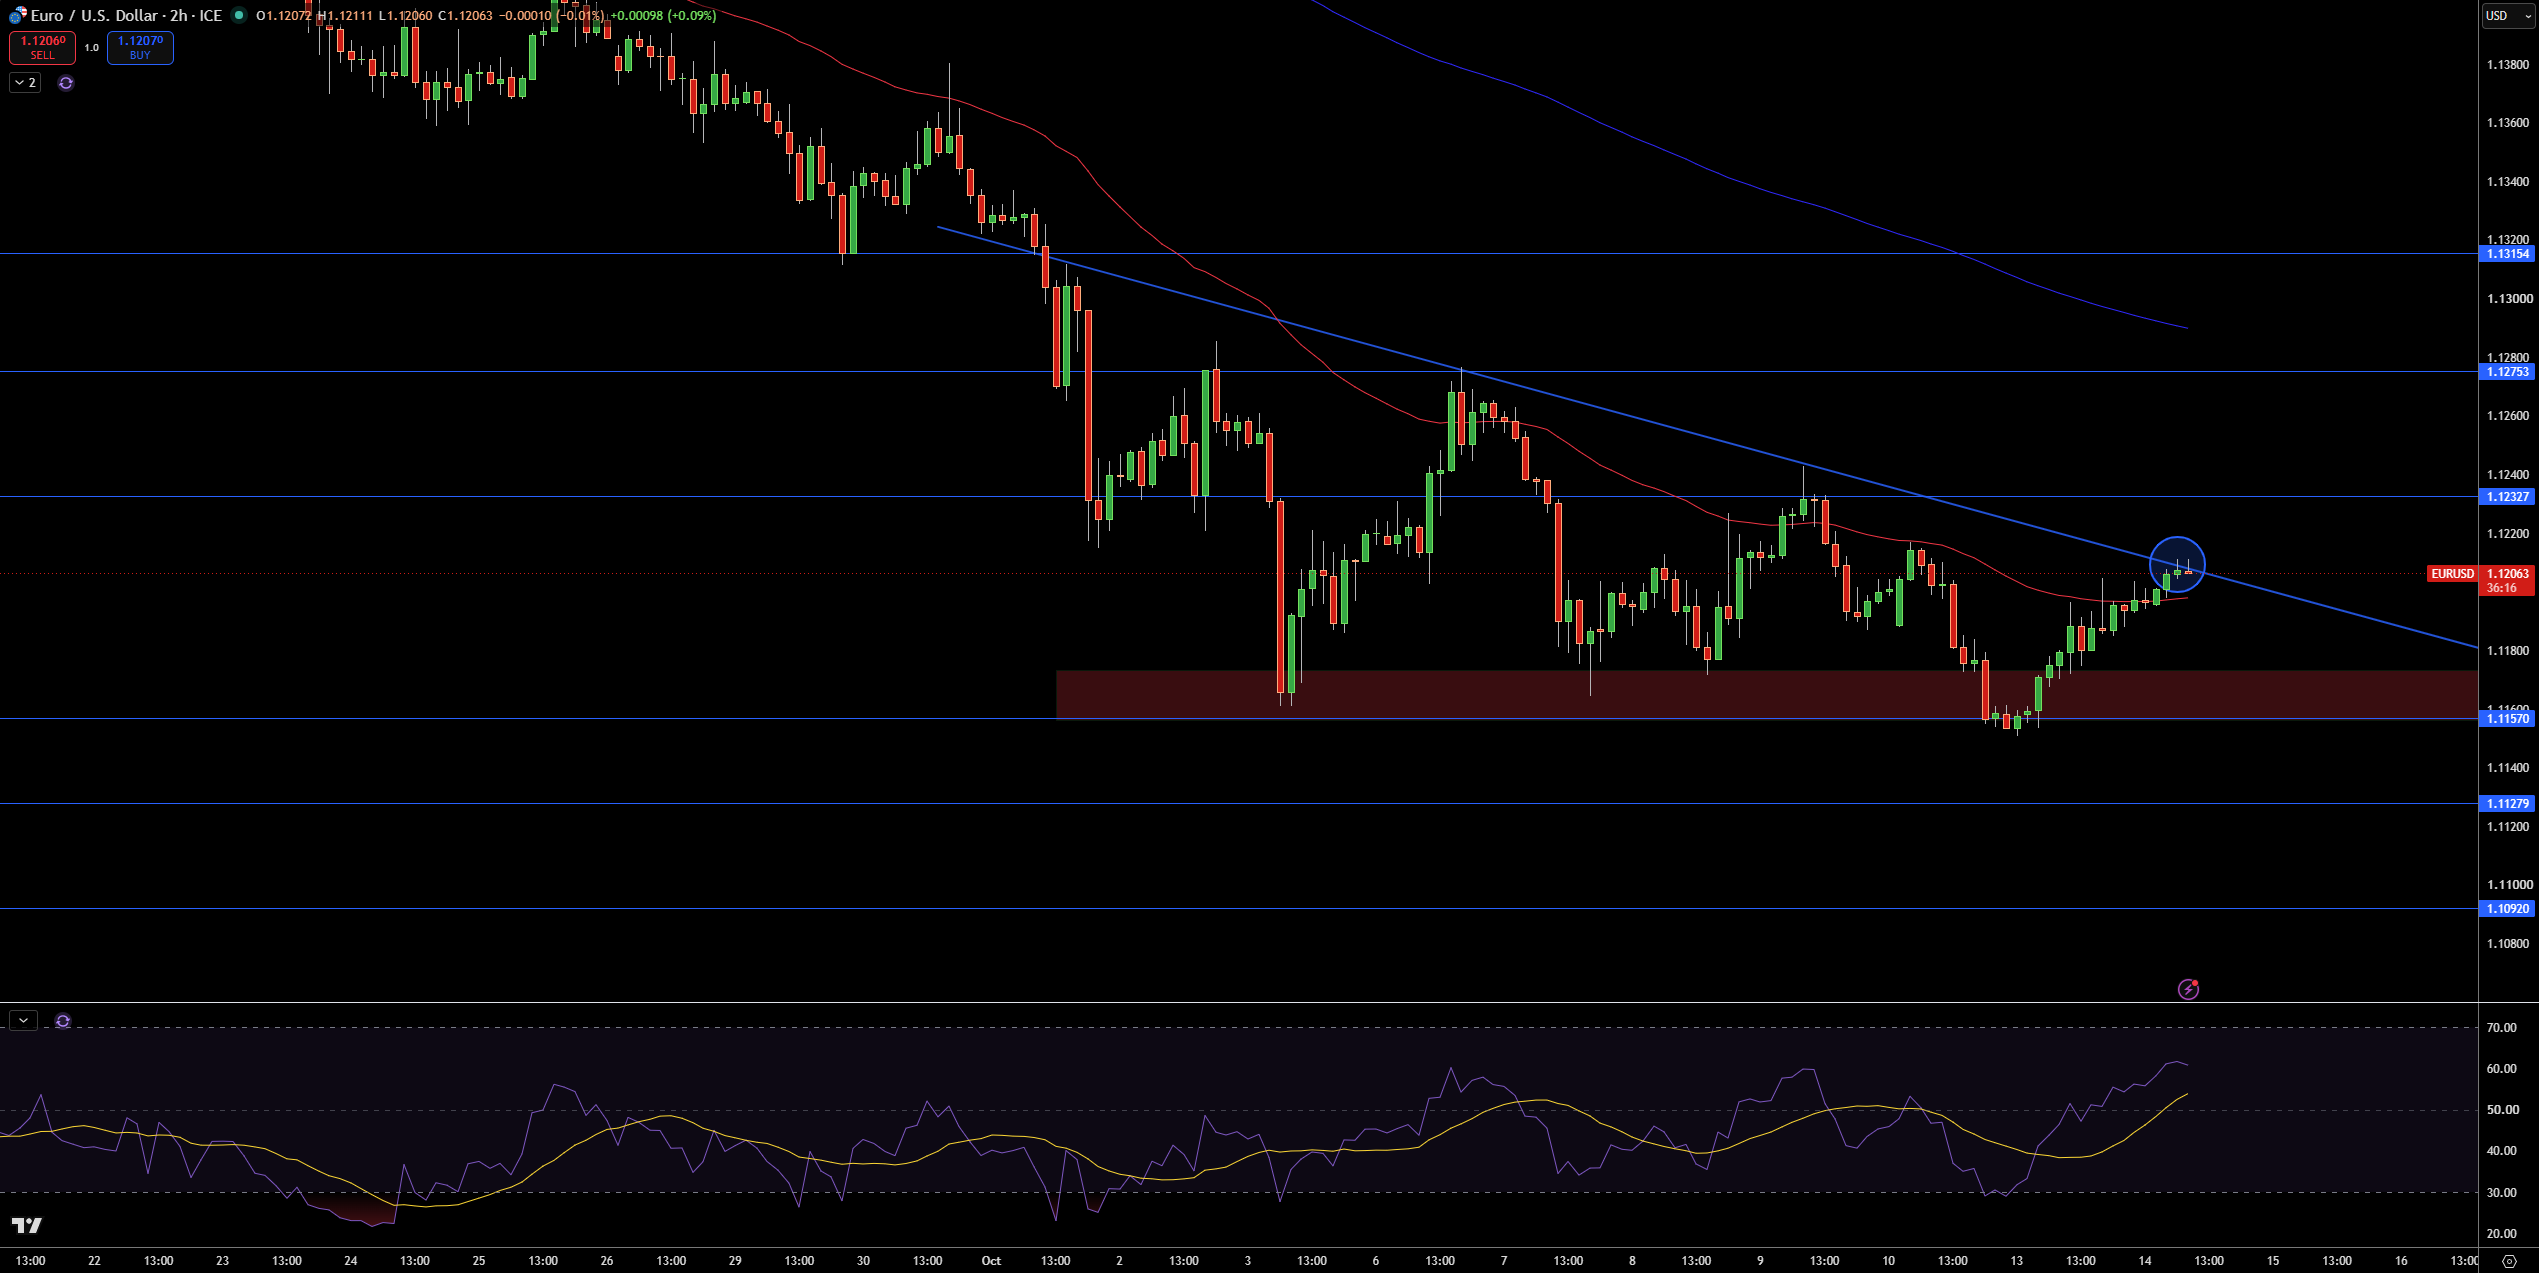
EUR/USD is trading at 1.1206 on the 2-hour chart and rebounding from 1.1157. With price pressing directly into the descending trendline and the short-term moving average, I consider the current area important. It could be the location of a breakout after a long-term decline.
The first resistance I’m looking at is at 1.1233. A break above that would have 1.1275 and 1.1315 in sight. If the area between 1.1178 and 1.1157 holds, the 1.1233 resistance would likely remain the next upside hurdle. Other areas that would offer support if the recovery fails are 1.1128 and 1.1092.
RSI is in bullish territory. With that along with the price holding above 1.1157, I’ll lean slightly bullish. I’m neutral to slightly bearish below 1.1157. A clean move above 1.1233 would shift things more bullish, while a move below 1.1157 would allow sellers to take control again.


