
USOIL: OPEC Supply Recovery Meets Tight U.S. Inventories
U.S. crude fundamentals are being pulled in opposite directions. The most recent OPEC report shows OPEC+ production in September at 39.07 million bpd, up 900,000 bpd from August, led by increased production by Saudi Arabia. Production in Russia, meanwhile, fell 38,000 bpd in September amid continued Ukrainian attacks on the country’s energy infrastructure. OPEC also revised its 2026 oil-demand growth estimate down to 180,000 bpd, while forecasting 2.55 million bpd of growth in 2027.
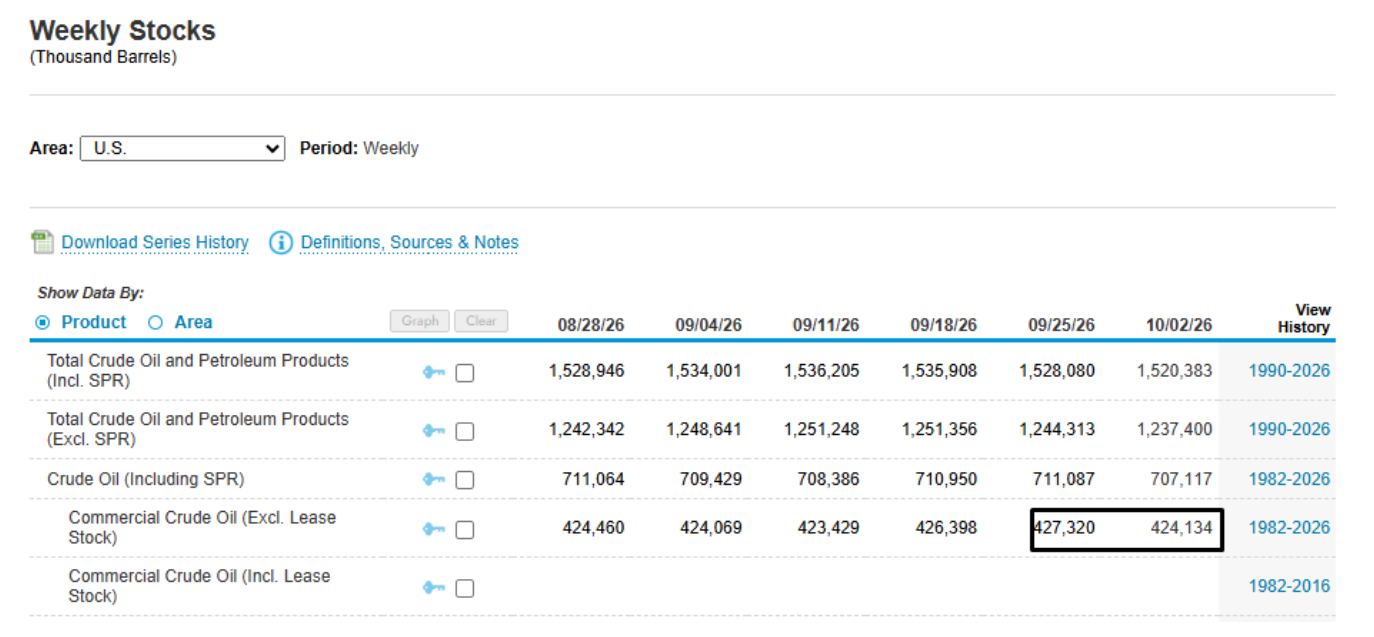
In its latest report, the EIA reported a tight balance for U.S. crude. For the week ending October 2, crude oil inventories fell 3.2 million barrels to 424.1 million barrels, with exports rising to 4.77 million bpd, and with refinery utilization rising to 92.7%.

UKOil: Hormuz Attacks Keep Shipping Risk Elevated
Brent’s main risk premium is still on the Strait of Hormuz. Vessels were hit by unknown projectiles on Tuesday. Meanwhile, Iranian officials told Reuters that Iran has changed its tactics against vessels it considers in violation of Iran’s restrictions. OPEC and non-OPEC ministers have said that shipping and insurance costs of some energy routes have climbed to more than one-third of the underlying commodity’s value, making logistics a significant constraint as Gulf production recovers.
Natural Gas: Storage Cushion Grows, but LNG Demand Expands
U.S. natural gas stocks are still comfortably padded. EIA data showed that working gas inventories were at 3,500 Bcf as of October 2, after an 85 Bcf weekly injection. Inventories are 2% above the five-year average.
Elsewhere, global LNG is still relatively tight, with around 17% of Qatar’s LNG export capacity lost to damage. Separately, President Donald Trump said Taiwan has agreed to buy 30% of the proposed Alaska LNG project’s output, although the terms were not immediately clear. The project is designed to export up to 20 million tonnes per year.
Natural Gas Technical Analysis: NG Tests $3.34 Resistance as Higher-Low Structure Stays Intact
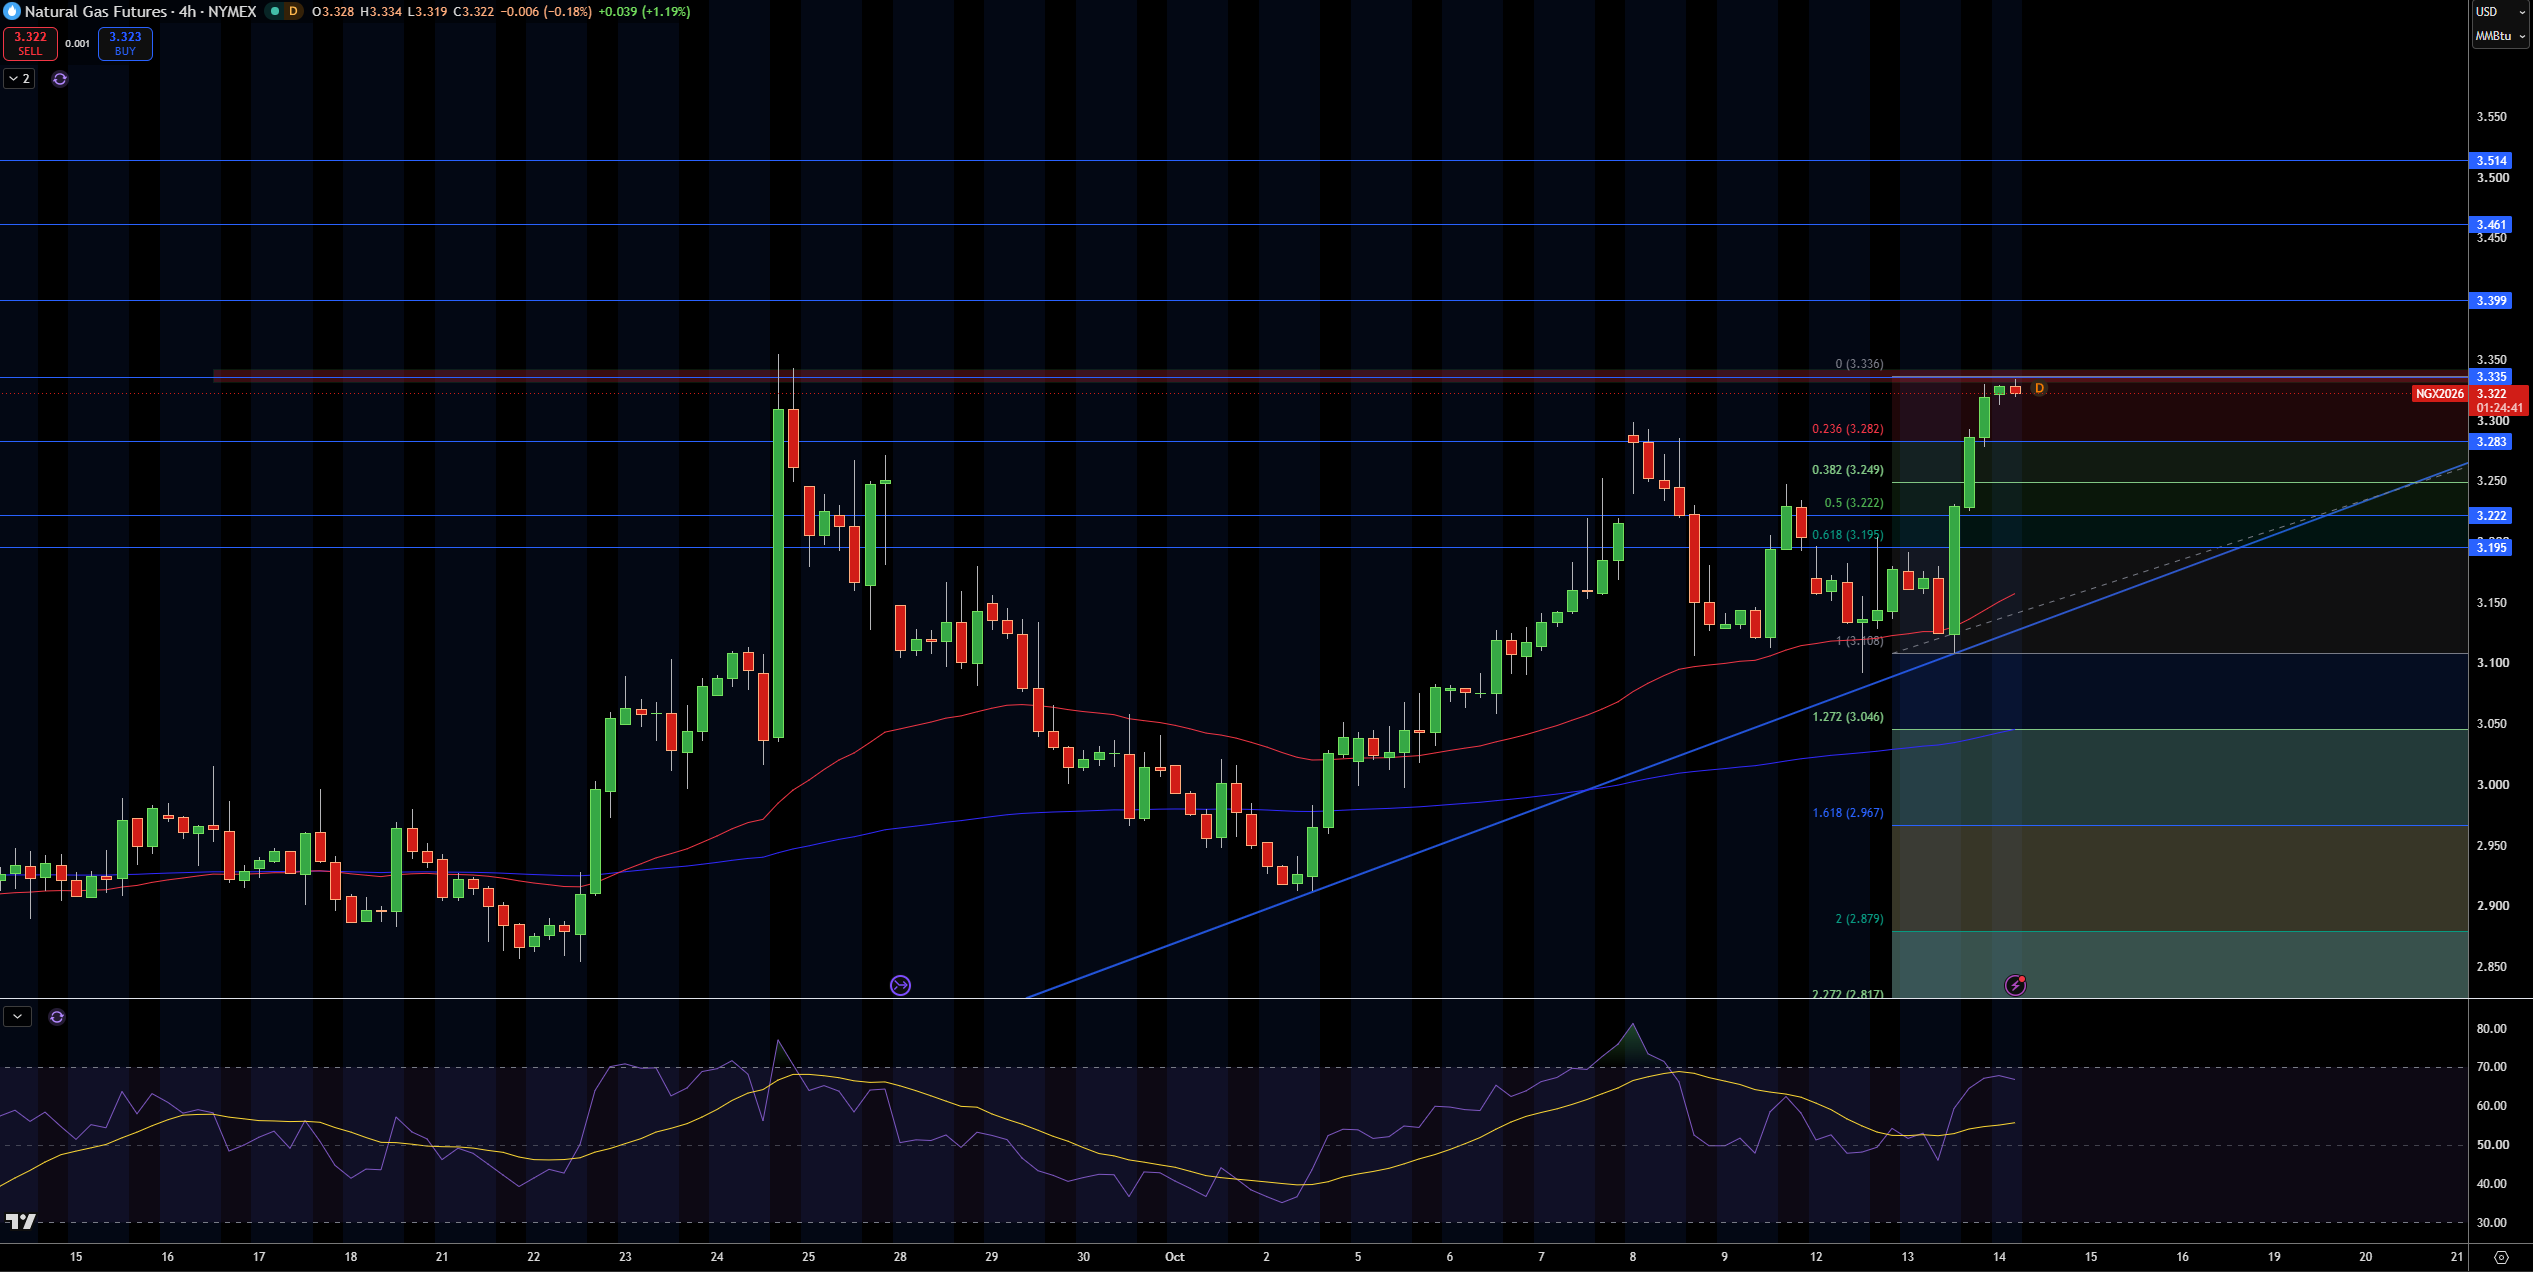
Nat Gas is trading at approximately $3.32/MMBtu on the 4-hour chart after a robust rebound from the rising trendline and the $3.11 area. Currently, price is above both the 50 SMA and 200 SMA and is reestablishing a higher-low structure. The latest move higher is challenging the 3.33-3.35 area, which is a large resistance zone.
Natural Gas Price Forecast
Every new Natural Gas analysis as it publishes, today's technical signal and key levels, live price — on one page.
See all Natural Gas forecastsThe first area of resistance I am looking at is $3.35. If price were to trade above this area then $3.40 and $3.46 would come into play, with $3.51 being next. To the downside, $3.28 would be the first area of support with $3.22 and $3.20 coming into play if the move lower continues.
RSI is currently in the upper half of its range, indicating bullish momentum, but not in overbought territory. As long as Nat Gas stays above the 3.22-3.28 area and the rising trendline, I will be bullish. A move above $3.35 would set a target of the 3.40-3.46 area, and a move below $3.20 would negate the bullish case.
WTI Crude Oil Technical Analysis: USOIL Holds $93.94 as $96.57 Becomes the Next Upside Test
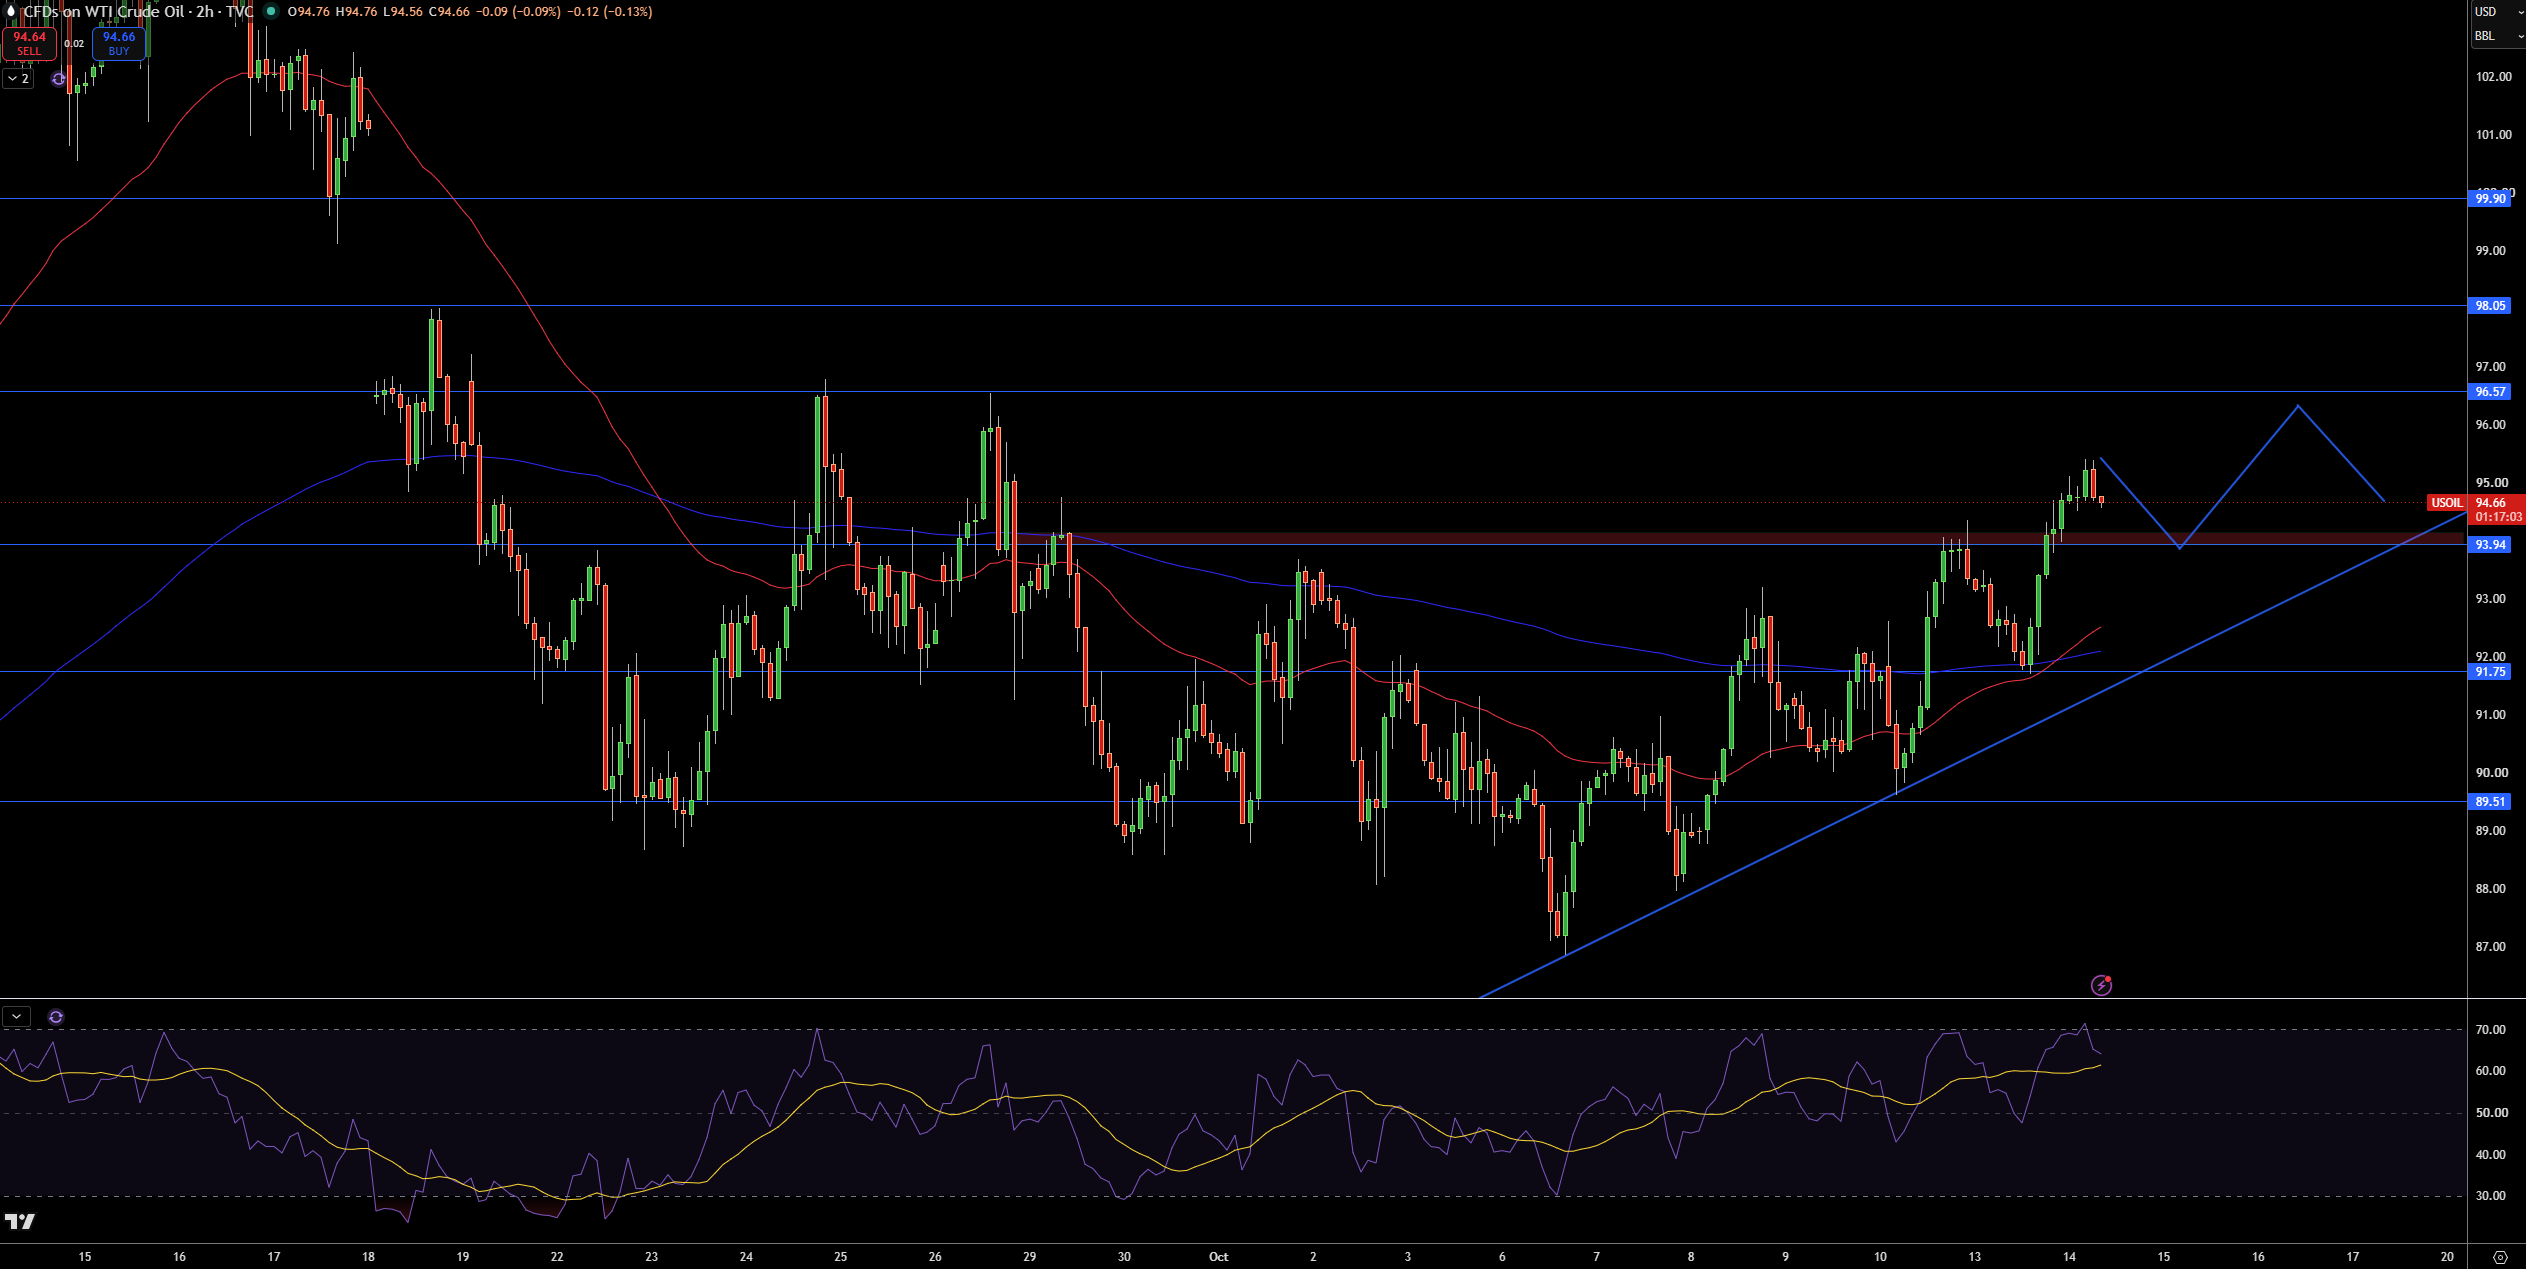
WTI is at $94.66 on the 2-hour chart after extending its recovery from the rising trendline and the $91.75 area. What is interesting here is price created a sequence of higher lows, and is above both moving averages. The former area of resistance at $93.94 is now an area of support. With price holding above the rising trendline and $93.94, the near-term outlook is positive.
The first area of resistance is at $96.57. A daily close above that would shift the focus to $98.05 and $99.90. On the downside, $93.94 would be the first level of support, with $91.75 and $89.51 coming into play with a further move to the downside.
RSI is in the upper half of its range showing positive momentum. I am looking for an upside target at $96.57. While price holds above $93.94 and the rising trendline, I am bullish on WTI. A daily close below $91.75 would negate the bottoming process, and focus on the broader bear trend. A daily close above $96.57 would have an intermediate target at $98.05, and then $99.90.
Brent Crude Oil Technical Analysis: UKOIL Holds Above $105 as $107.22 Caps the Advance
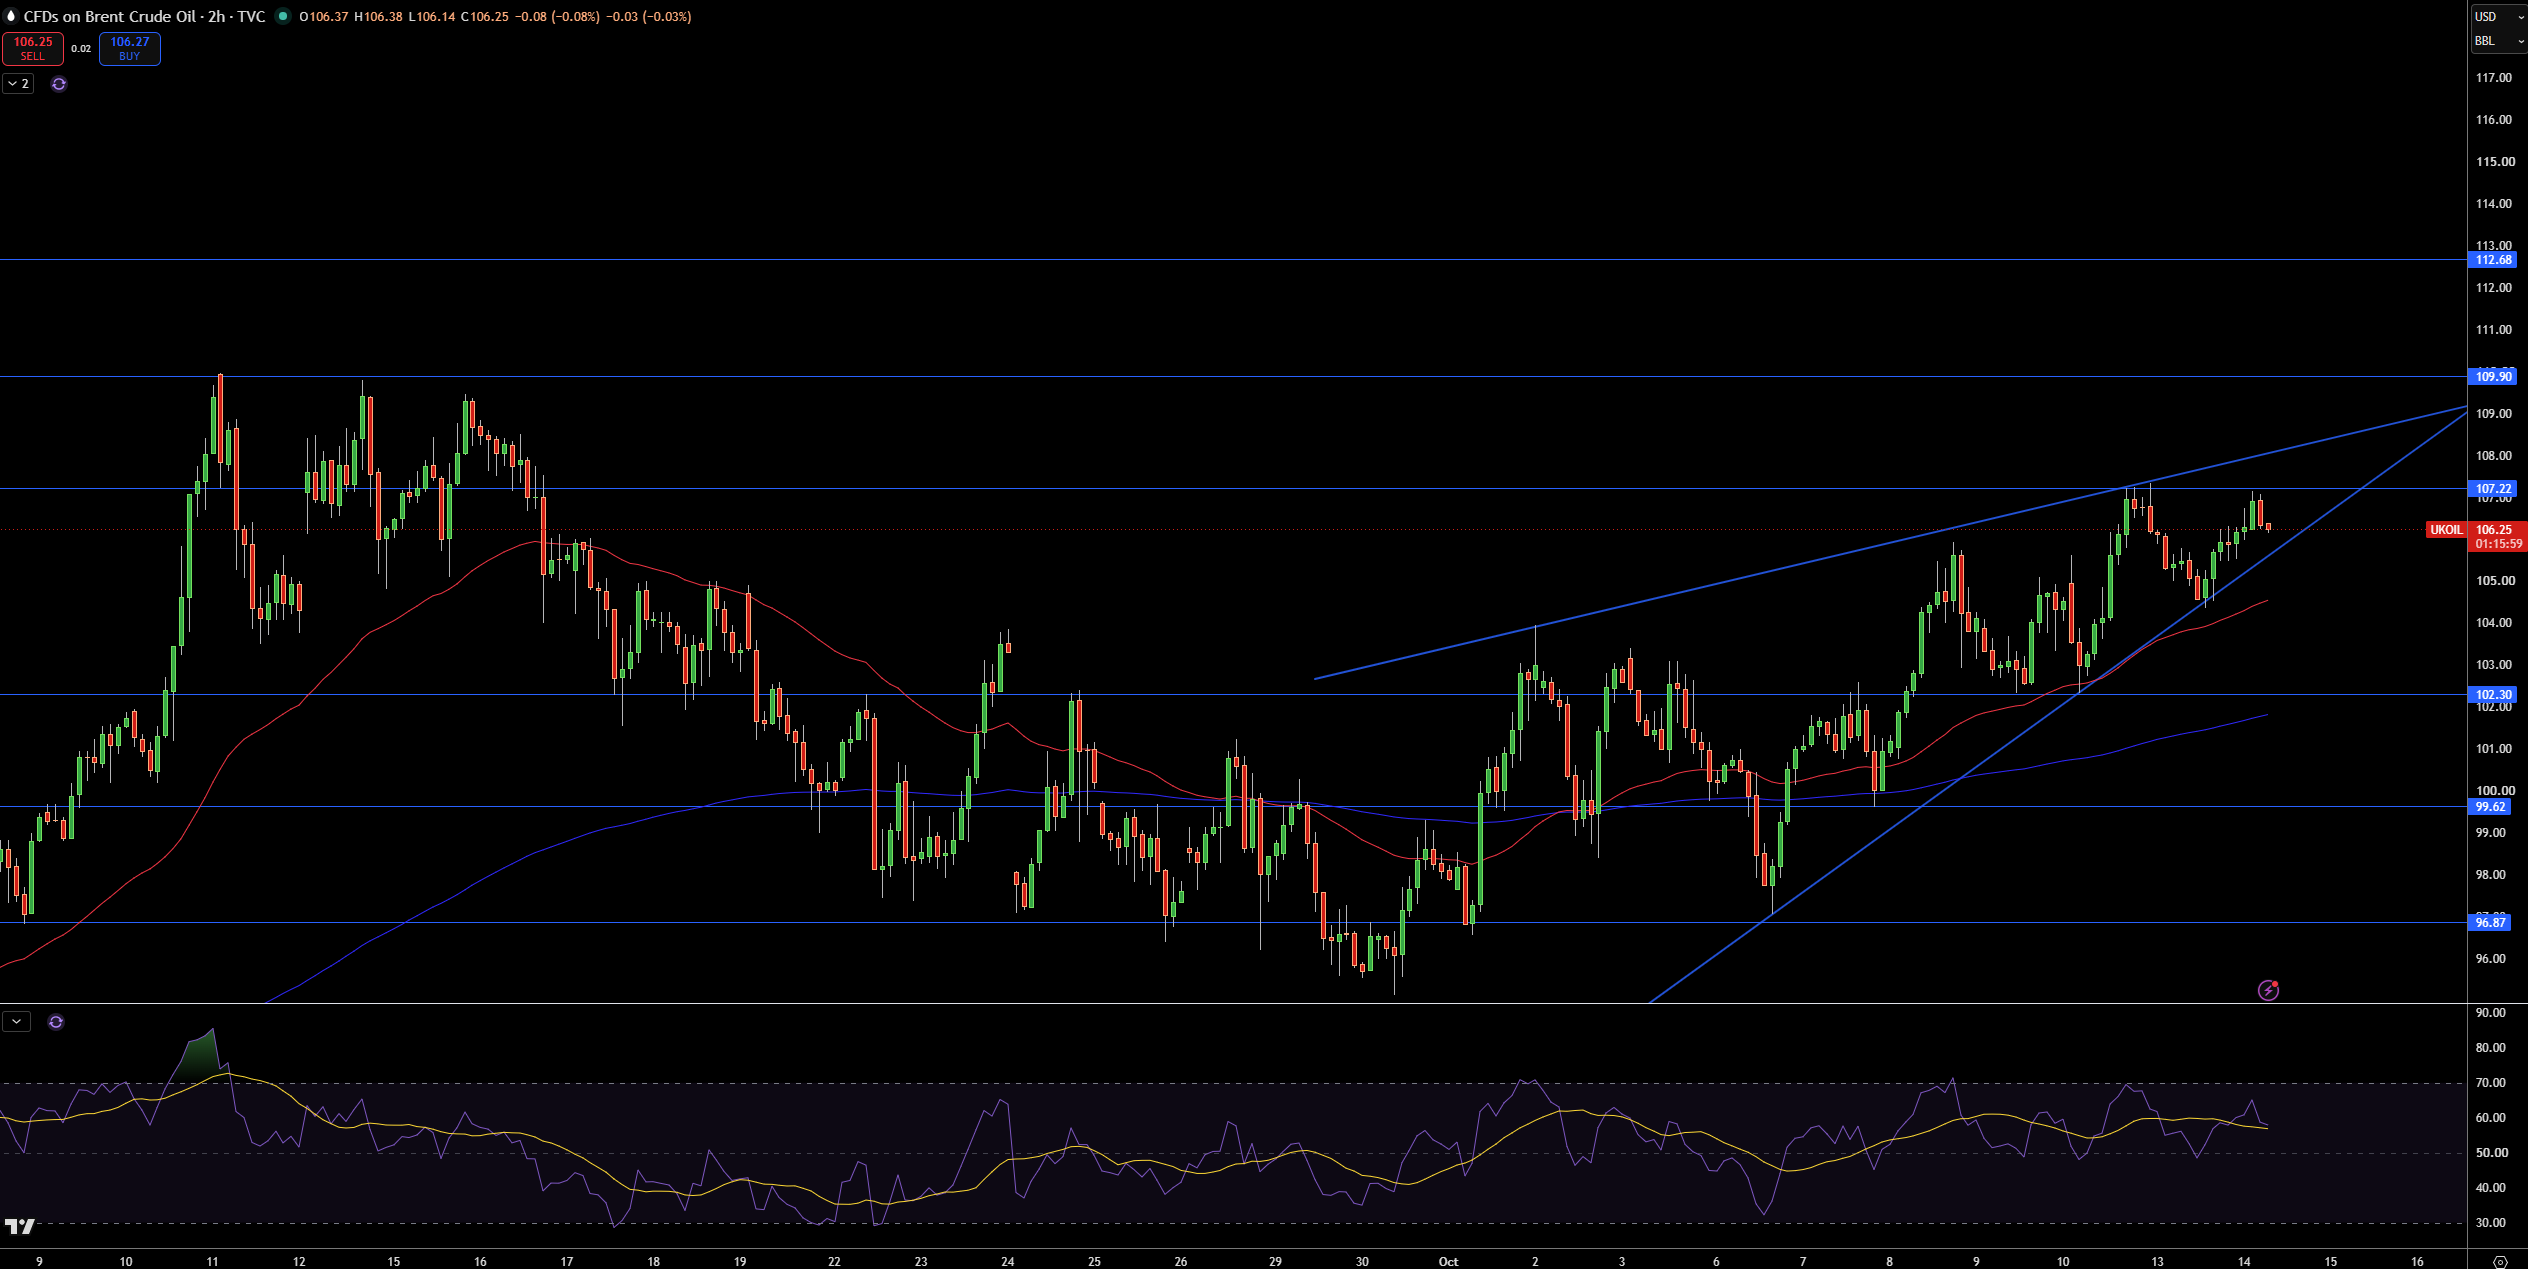
On the 2-hour chart, Brent crude is trading near $106.25 after forming a higher low on the daily chart since the October low. I see that price is above the two moving averages, currently below the channel’s upper trendline, and still following the uptrend, but is finding resistance in the $107.22 area.
The first area of resistance is found at $107.22. If price moves above this level, $109.90 and $112.68 are next. Support is found at $102.30, $99.62, and $96.87.
RSI is above the 50 center line, indicating a slight bullish edge. After the recent bullish move, price is finding resistance near $107.22, while RSI remains above the 50 center line. With this, I see price above the $102.30 as bullish and above the uptrend line as bullish. Above $107.22, $109.90 becomes the next target, and if this area breaks, $112.68 comes into focus. Below $102.30, I see the trend as bearish.